
A chromosome-level genome assembly of the red drum, Sciaenops ocellatus
2021-04-10 09:57:30TinjunXuYeLiQingChuWeiweiZheng
Aquaculture and Fisheries 2021年2期
Tinjun Xu, Ye Li, Qing Chu, Weiwei Zheng
aLaboratory of fish Molecular Immunology, College of fisheries and Life Science, Shanghai Ocean University, Shanghai, 201306, China
bLaboratory of Marine Biology and Biotechnology, Qingdao National Laboratory for Marine Science and Technology, Qingdao, 266200, China
cKey Laboratory of Exploration and Utilization of Aquatic Genetic Resources (Shanghai Ocean University), Ministry of Education, 201306, China
dNational Pathogen Collection Center for Aquatic Animals, Shanghai Ocean University, 201306, China
ABSTRACT
Keywords:
Red drum
Whole-genome
Chromosomal assembly
Phylogenetic
Genome evolution
1.Introduction
The red drum (Sciaenops ocellatus) belongs to Sciaenidae and is considered to originally range from Tuxpan to Massachusetts in the Atlantic Ocean (Pattillo, Czapla, Nelson, & Monaco, 1997). With the development of aquaculture technology, the commercial aquaculture of this species gradually spread all over the world. S. ocellatus larvae were introduced from Texas to China in July 1991, and the first generation of S. ocellatus larvae were successfully bred in 1995 (Lu, 2003). At present,it has become an important fish breed in China because of its high economic value (Hong & Zhang, 2003). S. ocellatus can survive in different saltwater concentrations and temperatures (Gaylord & Gatlin,1996). They not only grow rapidly but also have strong environmental adaptability, making this species less prone to infections (Lutz, 1999).S. ocellatus has become a significant commercial fish in China since the 1990s. Its annual production reaches to 68.6 thousand tons in China(Zhang et al., 2018). However, due to the germplasm degeneration and abundant diseases, the commercial cultivation of S. ocellatus is destroyed. The genetic improvement of farmed aquatic species is a permanent and cumulative solution to maximize production efficiency(Gjedrem, Robinson, & Rye, 2012, pp. 350-353). For the purpose of effective conservation, management and cultivation of S. ocellatus, genetic studies have been carried out. In 1991, 397 individuals from 13 different geographic locations were collected to examine mtDNA to study intraspecific and interspecies variations (Gold & Richardson,1991). Recently, based on the linkage data of two full sibling families, a genetic linkage map of anonymous and gene-linked microsatellites was generated for S. ocellatus (Hollenbeck, Portnoy, & Gold, 2015). This map provided a valuable resource for S. ocellatus aquaculture and a framework for genome assembly. In addition, transcriptomes from the testis,liver, and head kidney of S. ocellatus were identified and annotated to provide basic functional genomic information (Sherwood, Main, &Wetzel, 2019).
Compared to second-generation sequencing technologies, which assembles a complete genome with numerous small sequencing reads, 10X Genomic Chromium sequencing provides long range information between read pairs. Each read pair is linked to a group of reads by a barcode index within a fragment size typically between 50 and 100 kb. This technology makes up for the short board of the second-generation sequencing platform that cannot obtain long fragment information and has important application value in the field of whole genome sequencing and exome sequencing, especially in de novo assembly. 10X Genomic Chromium has been adopted in many genome assemblies(Girollet et al., 2019; Lian et al., 2019; Ran et al., 2019).
Currently, genomes from more than 330 fish species have been submit to NCBI (https://www.ncbi.nlm.nih.gov/genome/browse#!/overview/ fish). However, the genome of S. ocellatus is absent.Genomic breeding techniques for economical traits in S. ocellatus and effective strategies for disease control of this commercial species are lacking. An available complete genome will facilitate further studies on population genetics and make us better understand molecular mechanisms of fish immunity. Besides, these resources would further inform people how to breed S. ocellatus to strength its economic features. In our study, we report a chromosome-level genome of S. ocellatus to improve our understanding of phenotypic evolution of S. ocellatus. Moreover, the genome assembly can be a valuable resource to help improve genomic breeding techniques and provide insights into disease control of this species.
2.Materials and methods
2.1.Sample collection and sequencing
Given the complexity of S. ocellatus genome, we performed a genome survey analysis. Valuable information about genome characteristics of this species was determined to provide reference for subsequent sequencing schemes, genome assembly schemes and genome structure annotation. For genome sequencing, we extracted gDNA from the muscle tissue of a male red drum obtained from Zhoushan Aquaculture Farm (Zhejiang, China) in accordance with DNA extraction protocol (Li,2018; Shao et al., 2018). All animal experimental procedures were performed according to the National Institutes of Health’s Guide for the Care and Use of Laboratory Animals. The experimental protocols were approved by the Research Ethics Committee of Shanghai Ocean University (No. SHOU-DW-2018-047).
In the genome survey, the qualified DNA samples were randomly interrupted to 350 bp fragments, followed by modifications, and one paired-end library was generated. In the next, we then used Illumina HiSeq 2000 platform to perform paired-end sequencing. The invalid data generated in these steps, such as the deviations and sequencing errors in the sequencing, will seriously hamper the advanced analysis of bioinformatics data. Thus, we used SOAPnuke (Chen et al., 2018) to filter out low-quality reads with parameters “-n 0.05 -l 10 -q 0.1 -M 2 -Q 2 -G”.
In order to facilitate de novo genome assembly, we used 10X Genomics Chromium system (Weisenfeld, Kumar, Shah, Church, & Jaffe,2017) to construct a new pair-end library with insert sizes ranging from 50 bp to 100 kb. Then we performed sequencing with BGISEQ-500 platform and each read length was 150 bp. To filter out the low qualities, we used SOAPnuke with parameters “-n 0.05 -l 10 -q 0.1 -M 2 -Q 2-G”.
To construct Hi-C library, we mixed a blood sample of S. ocellatus with formaldehyde. The DNA was then digested with restriction enzyme Mbo I, followed by repair of 5’ overhang with biotinylated residues. One PE library was constructed following Hi-C library preparation protocol with approximately 300 bp insert size (Belton et al., 2012). We then performed sequencing with BGISEQ-500 platform, where read length for each end was 100 bp. The raw data were filtered using SOAPnuke with parameters “-n 0.05 -l 5 -q 0.5 -A 0.5 -M 1 -Q 2 -G -d”.
2.2.Genome assembly
A k-mer (k =17) frequency distribution analysis on the 39.31 Gb clean sequence data was conducted to estimate genome size. In this process, 17-bp k-mers (17mers) were extracted from the sequencing data and the frequency of each 17-mer was calculated. The 17-mer analysis conformed to a Poisson distribution (Fig. S2) and provided an estimate of 711.58 Mb for genome size (Table S1).
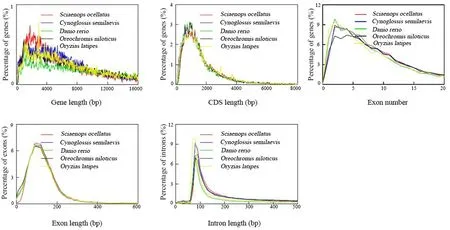
Fig. 5.The distributions of gene features in five species. We compared gene features among Sciaenops ocellatus, Oreochromis niloticus, Oryzias latipes, Cynoglossus semilaevis and Danio rerio.
Subsequently, we used 10X genomics sequencing data to assemble the genome with a specialized assembly software, Supernova (Weisenfeld et al., 2017), developed by 10X genomics for its linked-read experimental technology. To further improve the quality of the assembly, we filled the gaps in the assembly with krskgf (version 1.19) and Gapcloser (version 1.10).
To better assemble the genome of S. ocellatus, we used sequencing data from Hi-C library (Burton et al., 2013). The invalid data was filtered out using HiC-Pro (version 3.2) (Servant et al., 2015) with default parameters. Firstly, we used bowtie2 (version 2.2.5) (Langmead, Trapnell,Pop, & Salzherg, 2009) to compare the raw reads to the draft assemble sequence. We then used Jucier (version 1.5) (Durand et al., 2016), an open source tool for analyzing Hi-C datasets, and the 3D de novo assembly (3D-DNA, version 170.123) (Dudchenko et al., 2017) pipeline to scaffold red drum genome to 24 pseudochromosomes with parameters“-m haploid -s 0 -c 24”. Detailed information about the Hi-C assembly is available on protocol.io (Xin, 2018).
2.3.Annotations of gene structure and function
With the completion of abundant biological genome sequencing work, numerous repetitive sequences have been found. They are rarely found in viruses and prokaryotes, but widely distributed in eukaryotes(Treangen & Salzberg, 2012). Firstly, we used TRF (version 4.07)(Benson, 1999), RepeatMasker (version 4.0.6) and RepeatProteinMask(version 4.0.6) (Tarailo-Graovac & Chen, 2009) to detect repeat sequences and classify different types of repetitive sequences by aligning genome sequences to the Repbase liabrary (version 17.01) (Jurka et al.,2005). After that, we made a RepeatModeler analysis, followed by the classification of different types of transposable elements (TEs) with RepeatMasker (version 3.3.0) (Jurka et al., 2005) and LTR_FINDER(version 1.0.6). Lastly, the results were integrated and redundancy was eliminated.
After screening out the repetitive contents, gene annotations were conducted. For the genome structure annotation, we used de novo and homolog-based methods. Firstly, the repetitive sequences observed above were covered before annotating gene sequences. We then used Augustus (version 3.1) (Stanke et al., 2006) for de novo structure prediction. In the next, we used the BLAST-like alignment tool to collect the genes of 10 homologous species from NCBI: Cynoglossus semilaevis(GCF_000523025.1), Oreochromis niloticus (GCF_001858045.2), Danio rerio (GCF_000002035.6), Gadus morhua (GCF_902167405.1), Gasterosteus aculeatus (GCA_006229165.1), Seriola lalandi(GCA_003054885.1), Takifugu rubripes (GCF_901000725.2), Oryzias latipes (GCF_002234675.1), Ictalurus punctatus (GCF_001660625.1) and Poecilia formosa (GCF_000485575.1). Finally, we performed CLEAN(Elsik et al., 2007) to integrate genes generated by two methods and removed some genes supported by only one homologous species.
The predicted genes in S. ocellatus were then functionally annotated with TrEMBL, Swiss-Prot (Bairoch & Apweiler, 2000), Gene Ontology and Kyoto Encyclopedia of Genes and Genomes (Harris et al., 2004;Kanehisa & Goto, 2000), and InterProScan (version 4.7) (Jones et al.,2014). Finally, functional annotations of the best alignments in each database were used as the final consensus gene annotation result.
2.4.Evaluation of the assembly and annotation
To assess the completeness of the assembly, we selected small fragments of query libraries to compare the assembled genome with BWA(version 0.7.12) (Houtgast, Sima, & Al-Ars, 2018). We also conducted single-nucleotide polymorphism (SNP) analysis using Genome Analysis Toolkit(GATK) (version 4.0.2.1). Moreover, we performed analysis with Benchmarking Universal Single-Copy Orthologs42 (BUSCO,version 3.0.2) (Simao et al., 2015) with an Actinopterygii gene set. To validate the completeness of the gene structure annotation, we also used BUSCO (version 3.0.2) (Simao et al., 2015).
2.5.Genome evolution analysis
The identification of gene families among related species provides an important perspective on the evolutionary relationship between different species. We used BLAST searches to identify gene families in red drum genome against ten other fish species including Larimichthys crocea (GCF_000972845.2), Miichthys miiuy (GCA_001593715.1), Danio rerio (GCF_000002035.6), Oryzias latipes (GCF_002234675.1), Gasterosteus aculeatus (GCA_006229165.1), Tetraodon nigroviridis(GCA_000180735.1), Takifugu rubripes (GCF_901000725.2), Cynoglossus semilaevis (GCF_000523025.1), Xiphophorus maculatus(GCF_002775205.1), Callorhinchus milii (GCF_000165045.1) with C. milii genome as an outgroup. Firstly, we performed all-to-all BLAST to determine the similarities between genes with an E-value threshold of 1e-5. Then we used TreeFam (Li et al., 2006) to generate orthologous and paralogous relationships among all organisms. The single-copy orthologs were generated and we used them to construct the phylogenetic tree. Firstly, MUSCLE (Edgar, 2004) was used to compare the protein sequences of a single copy gene family. After that, we reversed transcribed of the protein sequence into a CDS sequence on the basis of the alignment result and extracted four times degenerate sites of each alignment into a super gene. Subsequently, we used MrBayes (Huelsenbeck & Ronquist, 2001) to build a phylogenetic tree. MCMCTREE in PAML package (Yang, 2007) was used to estimate species divergence time and LASTZ (version 0.9) (Harris, 2007) was used to align S. ocellatus genome to one species which is most closed to S. ocellatus according to the phylogenetic tree.s
2.6.Gene family expansion and contraction analysis
Based on the results of gene family clustering and phylogenetic relationships among species, CAF′E (De Bie, Cristianini, Demuth, & Hahn,2006) was used to analyze the expansion and contraction of gene families of 9 species including D. rerio, S. ocellatus, L. crocea, O. latipes,T. nigroviridis, X. maculatus, G. aculeatus, C. semilaevis and T. rubripes. We conducted enrichment analyses of these expanded and contracted families using GO and KEGG database.
3.Results
3.1.Sequencing and assembly
Using Illumina HiSeq 2000 platform, we gained 39.45 Gb raw sequence data. After filtering out invalid reads, we obtained a total of 39.31 Gb clean data. In order to facilitate de novo genome assembly, we used 10X Genomics Chromium system and performed sequencing with BGISEQ-500 platform. Finally, we obtained 86.90 Gb raw data(Table S2). We also obtained 1008.20 million pairs of Hi-C raw data. The raw data were filtered out and we got 246.6 million pairs of valid data,accounting for 24.46% of the total sequencing data.
Firstly, using 86.89 Gb 10X genomics sequencing data to assemble the genome, we obtained a size of approximately 686.43 Mb genome assembly with contig and scaffold N50 values of 99.71 and 7358 kb,respectively (Table S3). Using the Hi-C assembly technology, we obtained a size of approximately 686.62 Mb genome assembly with 24 pseudochromosomes (Table S4). The lengths of the 24 pseudochromosomes ranged from 13.89 Mb to 32.50 Mb. We then evaluated the accuracy and completeness of the assembly. Firstly, we aligned small fragments to the genome. The mapping reads covered 99.92% of the genome assembly, showing that reads and assembled genome have good consistency. We also identified a total of 1,828,583 SNPs, including 1,823,279 heterozygosis SNPs and 5274 homozygous SNPs. Approximately 95.9% of the complete BUSCO and 2.2% fragmented BUSCO were found in the assembly in accordance with Actinopterygii gene set.The results showed that the genome assembly was relatively complete(Table S5).
3.2.Genome annotation
The results from de novo prediction and homology search were overlapped, revealing that 19.45% of the genome comprised a repeat content with a total length of 133.55 Mb (Table S6). Finally, 120.88 Mb TE was detected, accounting for 17.60% of the assembled genome. TEs were then classified, and 68.18 Mb of DNA transposons were found,occupying 9.93% of the assembled genome, followed by long interspersed elements (LINEs, 6.50%) and long terminal repeats (LTRs,3.30%) (Table S7).
For de novo structure prediction, 26,099 protein-coding genes were predicted. For the homolog-based method, we searched against protein sequences of the 10 homologous species obtained from NCBI database.After moving the redundancy, we obtained 20,053 protein-coding genes, with average gene and CDS lengths of 14,371.04 and 1829.95 bp, respectively (Table S8). We further evaluated the completeness of gene structure annotation in accordance with the Actinopterygii gene set. The BUSCO assessment result showed that these genes covered 88.3% of the complete single-copy reference genes (Table S9). All these results indicated that our genome annotation was relatively complete.Among these genes, 20,039 (99.93%) were functionally annotated(Table S10). Non-coding RNAs, such as rRNA, tRNA, snRNA, miRNA, are non-translating proteins with important biological functions. We identified 3700 non-coding RNA, including 314 miRNA, 1270 tRNA and 713 rRNA (Table S11).
3.3.Genome evolution analysis
In gene family clustering, we obtained 12,116 gene families(Table S12 and Fig. 1a). Furthermore, the gene families in five presentative teleost species (L. crocea, M. miiuy, G. aculeatus, T. nigroviridis, T.rubripes) and S. ocellatus genomes were subjected to cluster analysis. We identified 78 unique gene families in S. ocellatus genome, and these lineage-specific genes may be associated with the features specific to S. ocellatus (Fig. 1b). In our study, 1608 single copy gene families were identified to construct phylogenetic trees. The result showed that L. crocea were two most closed to S. ocellatus from the point of view of evolutionary relationship. The two species diverged from their common ancestor 30 million years ago (Mya) (Fig. 2a).

Fig. 2.Genome evolution analysis. (a) Phylogenetic tree constructed with orthologous genes. Phylogenetic tree was constructed using 1608 single-copy orthologous gene families from 10 teleost species. Divergence times from C. milii-D. rerio (452.8-496.8 Mya), D. rerio-C. semilaevis (207-251.7 Mya), C. semilaevis-O. latipes(141.5-167 Mya), and O. latipes-X. maculatus (90.8-115.2 Mya) from the TimeTree database were used as the calibration times. The blue numbers on the branches indicate the estimated diverge times in Mya, and red circles indicate the calibration time. (b) Collinear blocks between the red drum (S. ocellatus) and large yellow croaker (L. crocea) genomes. Each colored arc represents a best match between the two species. Soc_HiC1-24 represents pseudochromosomes 1-24 of the red drum genome and Lcr_LG1-24 represents chromosomes 1-24 of the large yellow croaker genome.
We then compared chromosomes between L. crocea and S. ocellatus to examine the chromosome evolution events after speciation. Each S.ocellatus chromosome we generated was exactly aligned to L. crocea genome (Fig. 2b). The average coverage ratio was 0.62, indicating that S. ocellatus genome assembled by Hi-C was of high accuracy and continuity (Table 1).
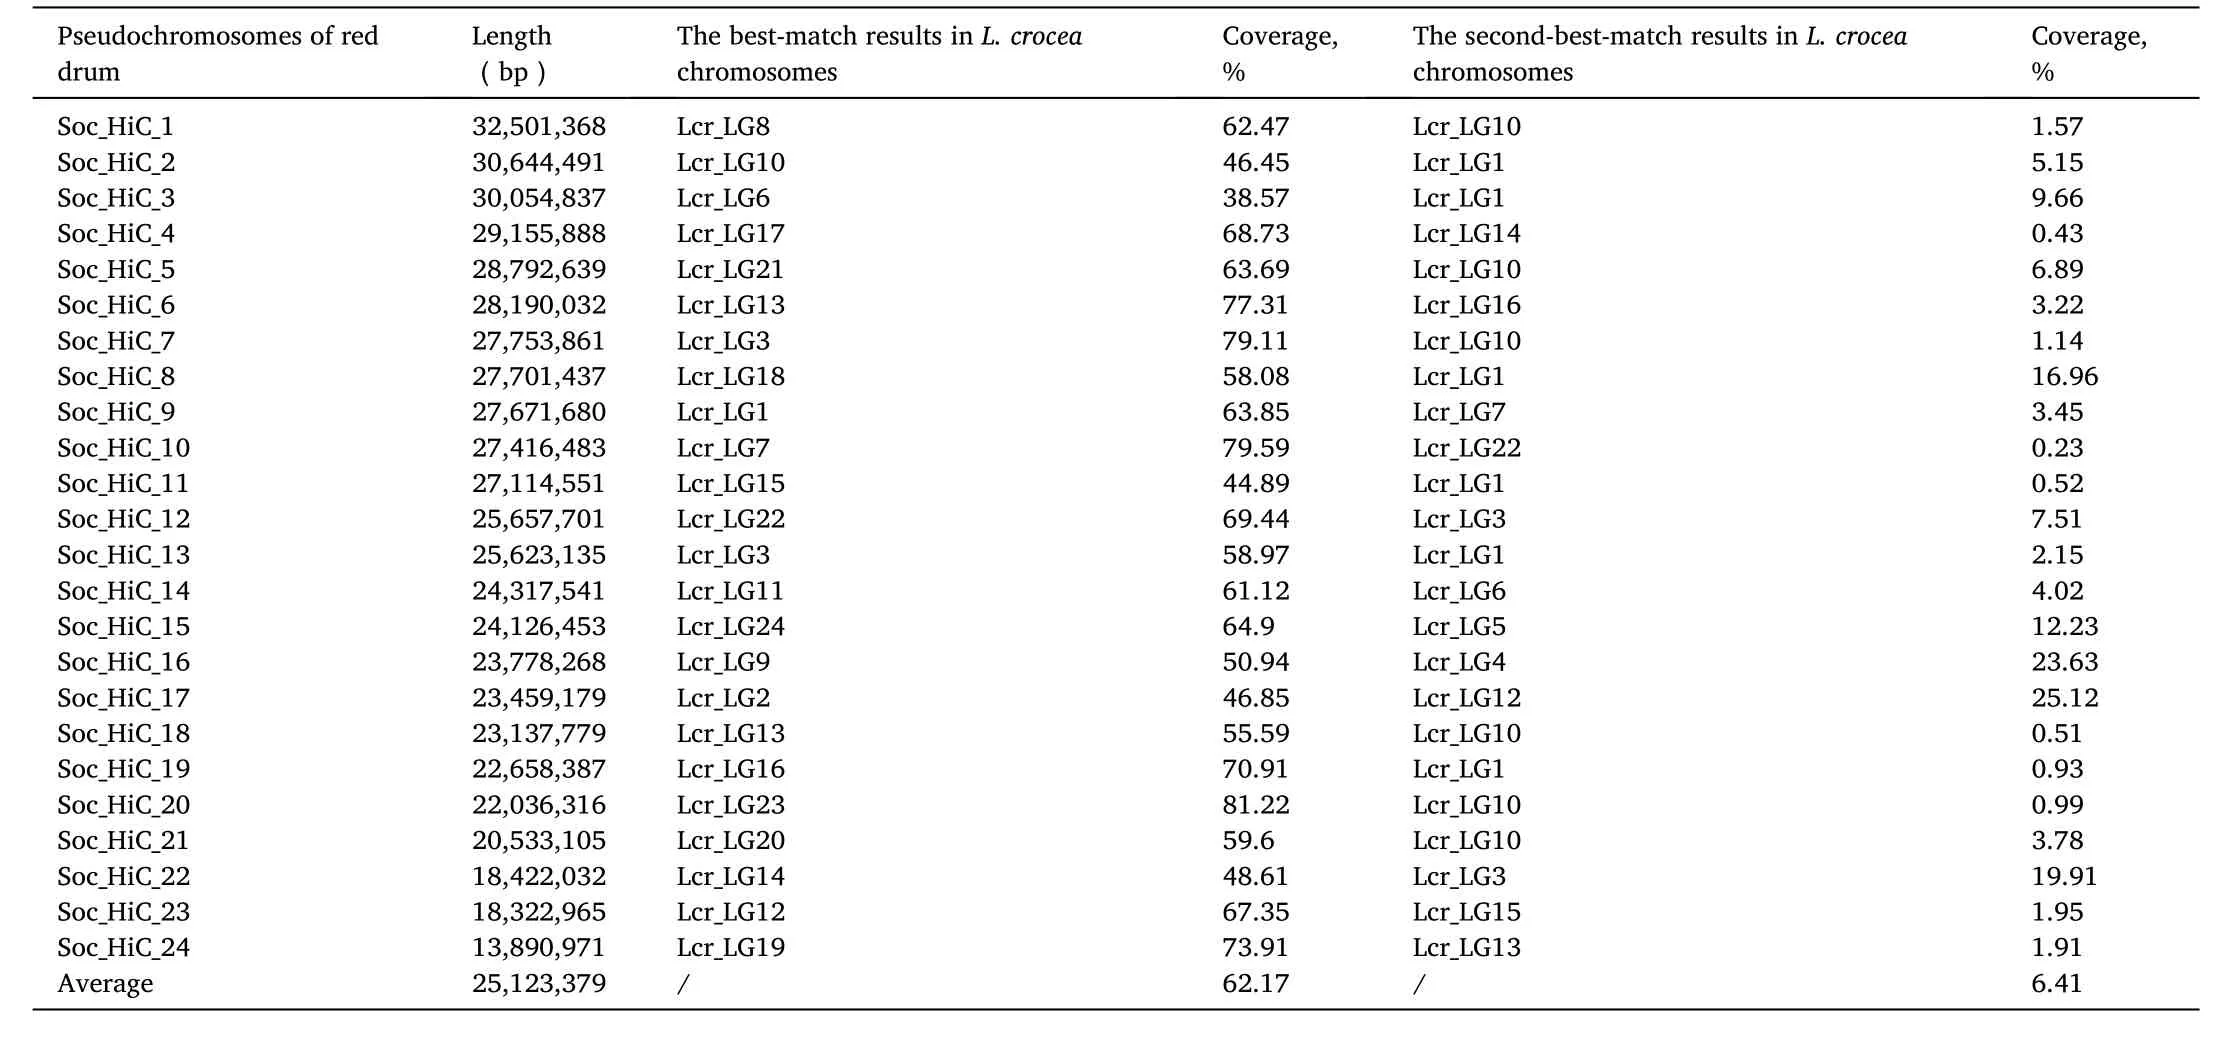
Table 1Whole genome alignment results between S. ocellatus and L. croea genomes. The collinear analysis results were generated by LASTZ.
3.4.Gene family expansion and contraction analysis
Based on the results of gene family clustering (S. ocellatus, L. crocea,M. miiuy, D. rerio, O. latipes, G. aculeatus, T. nigroviridis, T. rubripes, C.semilaevis, X. maculatus and C. milii) and phylogenetic relationships among these species, we obtained expanded and conttracted gene families. The analysis showed that 890 gene families were expanded in S. ocellatus, whereas 1256 gene families were contracted (Fig. 3). The expanded and contracted gene families were enriched in GO terms and KEGG pathways. We listed the expanded and contracted families that were significantly enriched in GO terms. In KEGG enrichment, we listed expanded and contracted families that related to immunity, endocrine and metabolism (Fig. 4). According to the pvalue and rich factor, we found that some genes involved in immunity were significantly enriched NOD-like receptor signaling pathway.
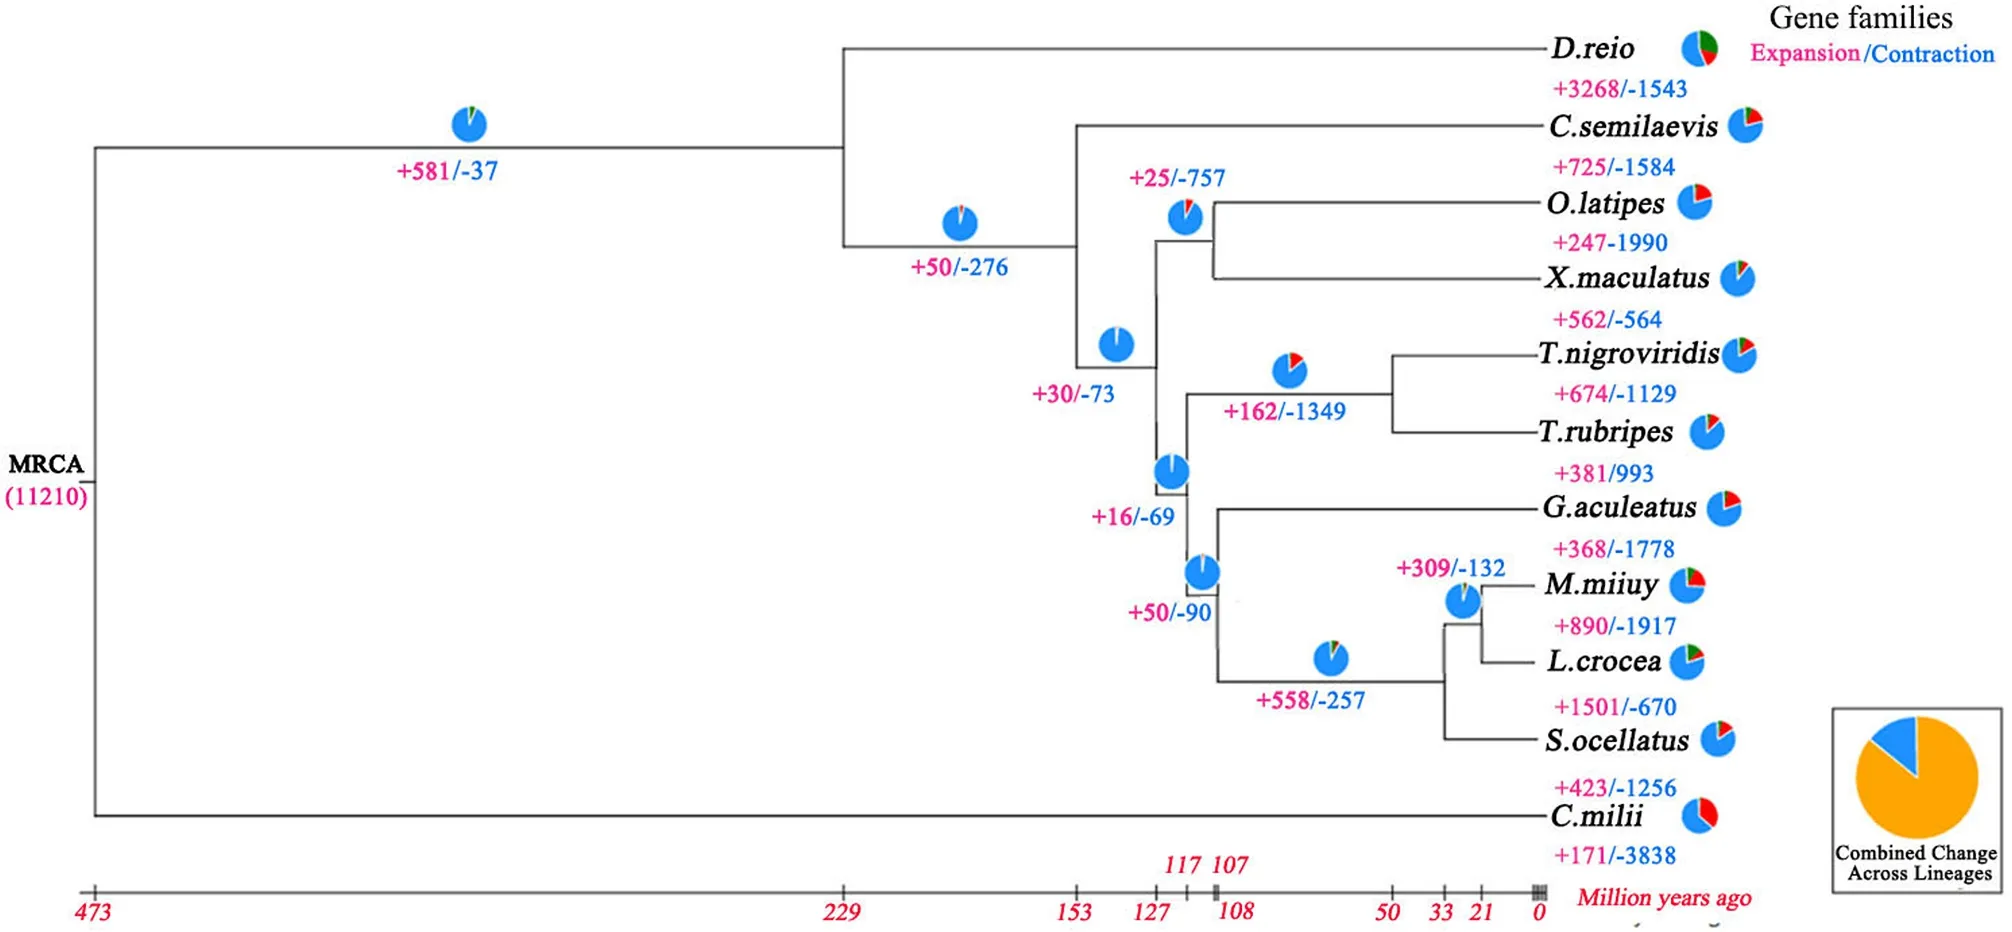
Fig. 3.Expansion and contraction of gene families. The number of gene families that expanded or contracted in each lineage after speciation is shown on the corresponding branch, with “+” referring to expansion and “-” referring to contraction. MRCA (11210) is the gene family number of the most recent common ancestor.
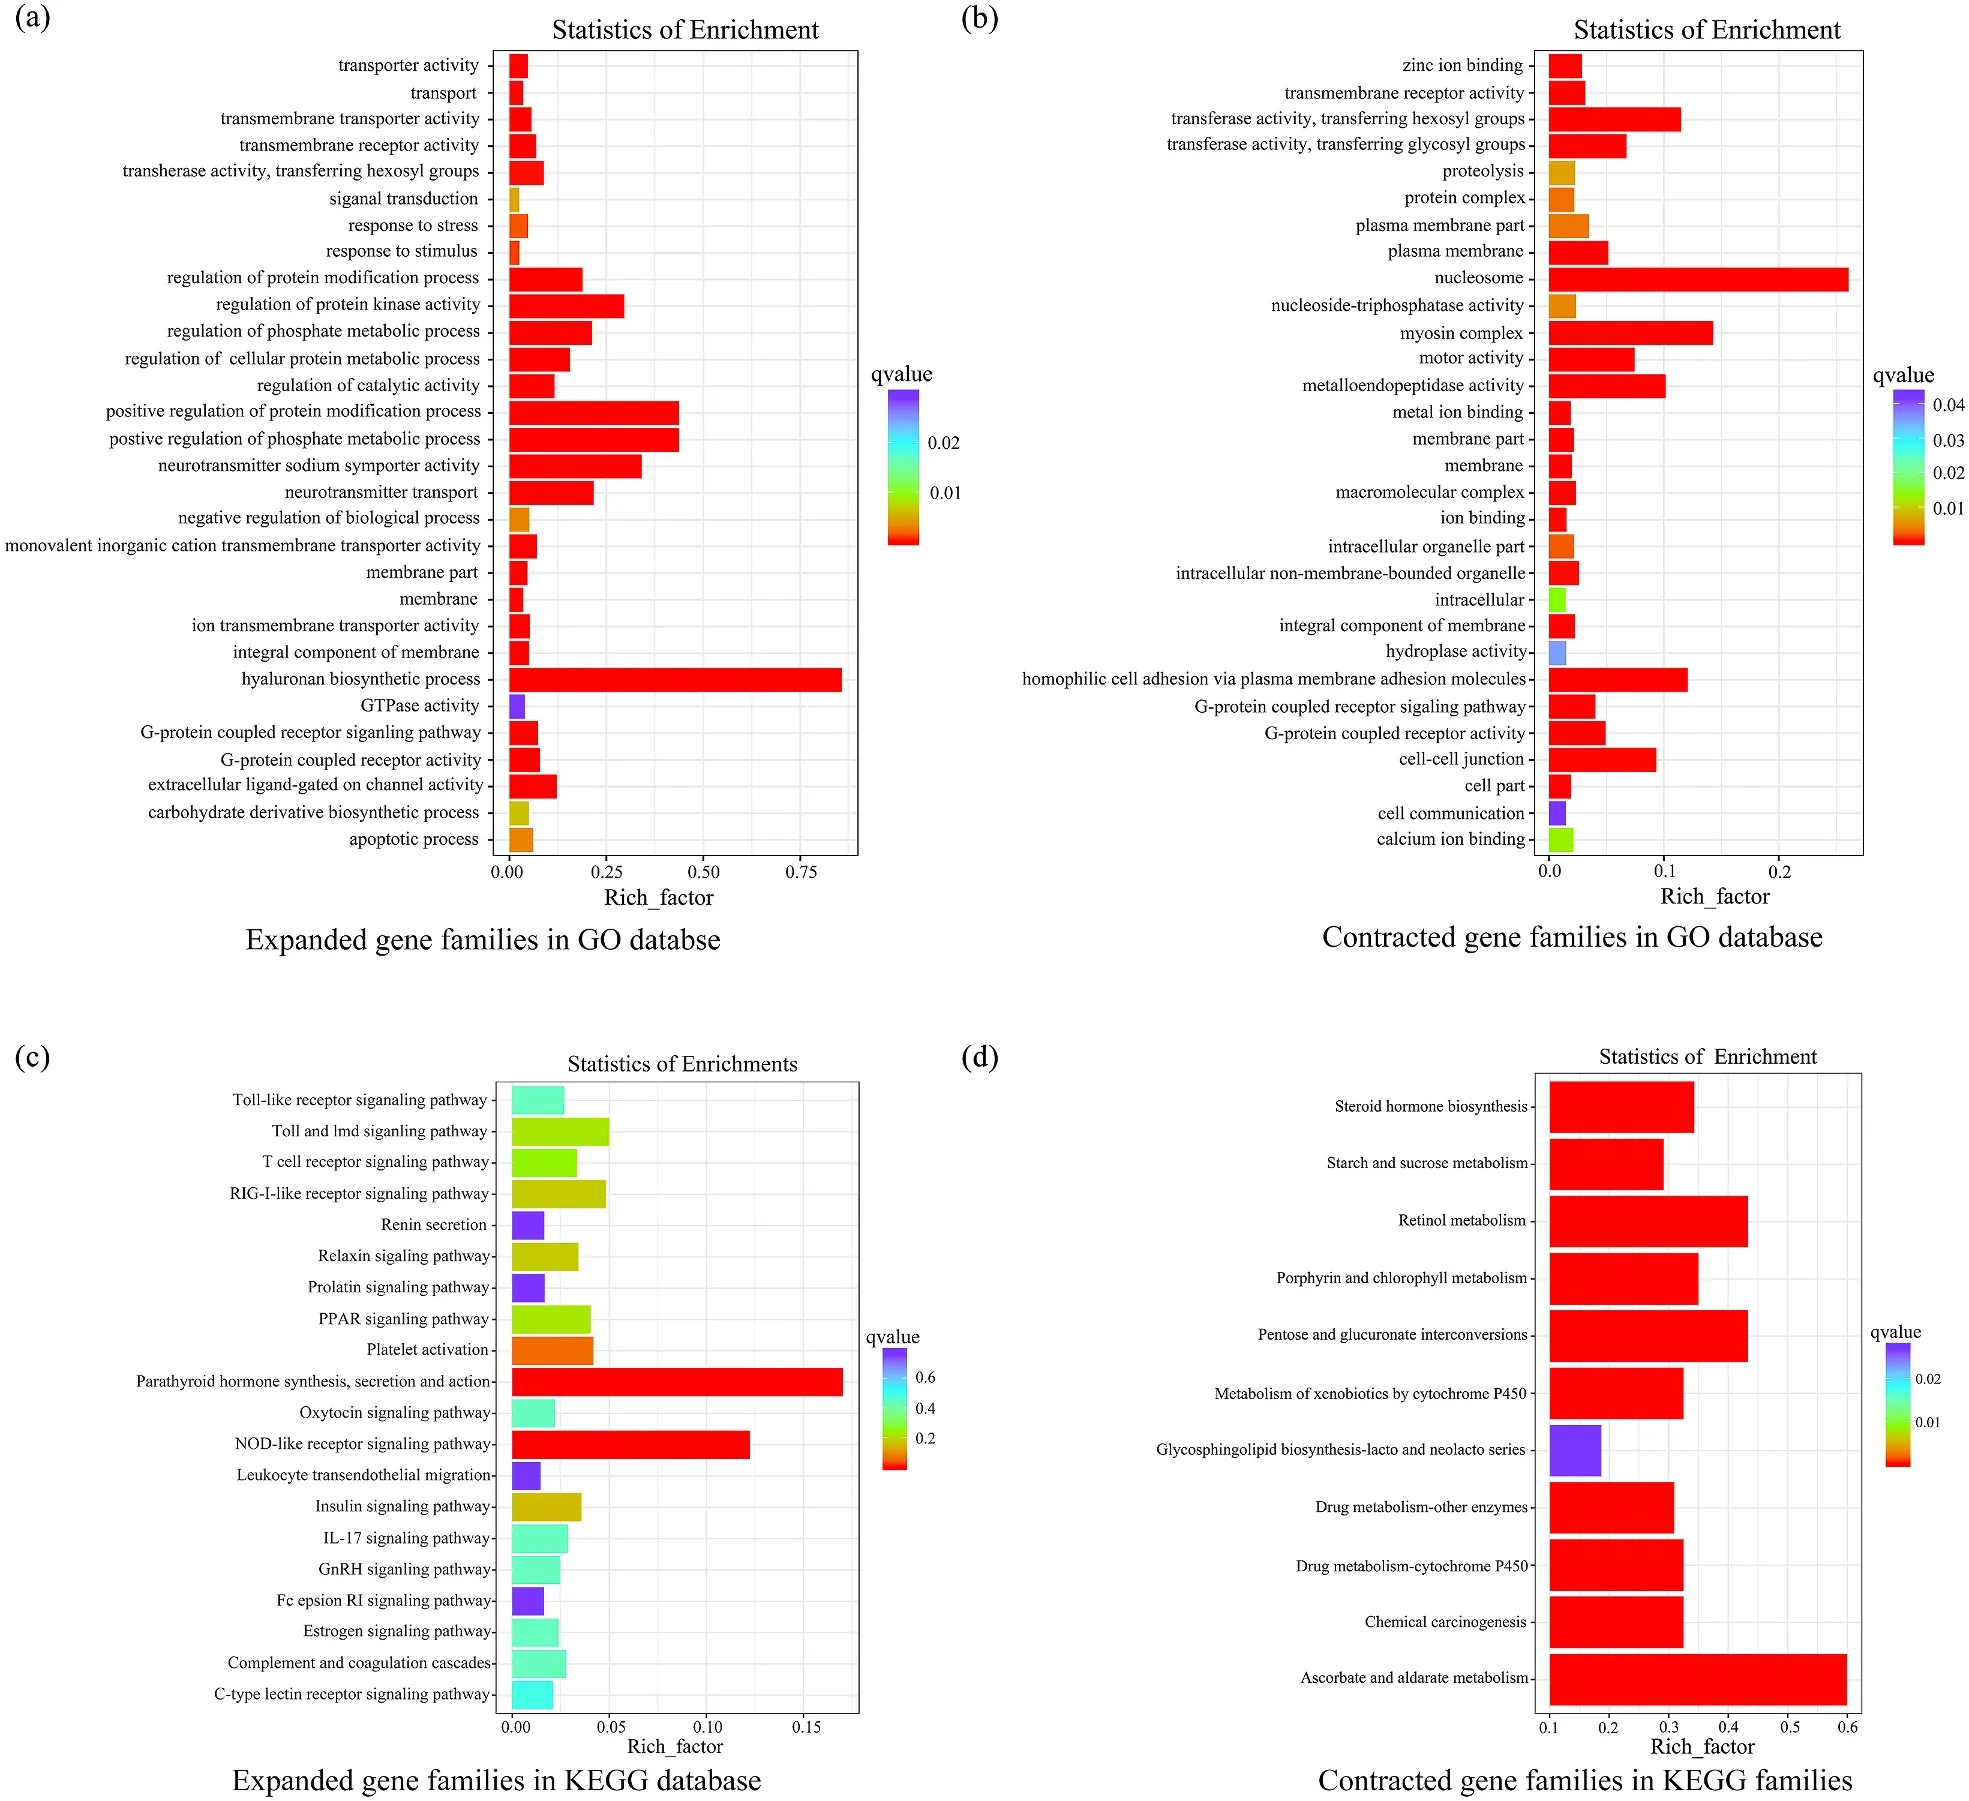
Fig. 4.Enrichments of GO and KEGG. we conducted enrichment analysis of GO and KEGG for expanded and contracted gene families. (a) Expanded gene families that were significantly enriched in GO terms. (b) Contracted gene families that were significantly enriched in GO terms. (c) Expanded gene families involved in immunity, endocrine and metabolism were listed according to the result of KEGG enrichment. (d) Contracted gene families involved in immunity, endocrine and metabolism were listed according to the result of KEGG enrichment.
4.Discussion
Although some genomic studies have been conducted, the study of genomic breeding and diseases of S. ocellatus were limited due to the absent of a complete genome assembly of this species. We first present a chromosome-level genome assembly of S. ocellatus. The final genome was 686.62 Mb and N50 lengths of contig and scaffold were 99.71 Kb and 25.62 Mb, respectively. To evaluate the quality of genome assembly,we compared the assembly metrics of S. ocellatu to those of other teleost genomes (Shao et al., 2018; Xu et al., 2018) which were generated using NGS reads and found their assembly metrics are similar. In addition, the BUSCO assessment and SNP analysis were conducted to evaluate the completeness and accuracy and the results are similar to those of other teleost assemblies (Shao et al., 2018; Xu et al., 2018; Zhou et al., 2019).All evidences suggest that the genome assembly is of high quality.
We not only compared the metrics of assembly, but also the result of genome annotation. In this study, we totally obtained 20,053 genes.Average gene and CDS length were 14,371.04 bp and 1829.95 bp,respectively (Table S8), which were consistent with the distribution of gene features in other teleosts (Fig. 5). It suggested that the genes are successfully identified and will be reliable for further analysis. Interestingly, we find that the contents of repetitive elements vary a lot in different fish species. In our study, repetitive elements comprised 19.45% of the S. ocellatus genome, which was much lower than that of D. rerio (52.2%) (Home et al., 2013), but higher than O. lapties (17.5%)(Kasahara et al., 2007). The proportion of repeated elements even varies greatly among species in the same family. For example, L. croea, one species of Sciaenidae, has a larger proportion of repetitive elements(26.6%) (Chen et al., 2019) than S. ocellatus (19.45%) and M. miiuy(19.51%) (Xu et al., 2016). This is a very interesting phenomenon that requires more studies. The genome assembly and annotation will be valuable to help study the fish immunity of the Sciaenidae family to prevent these species from being infected by related pathogens or cure sick fish to a certain degree. This study may provide a valuable resource to improve molecular assisted breeding techniques for this important valuable species.
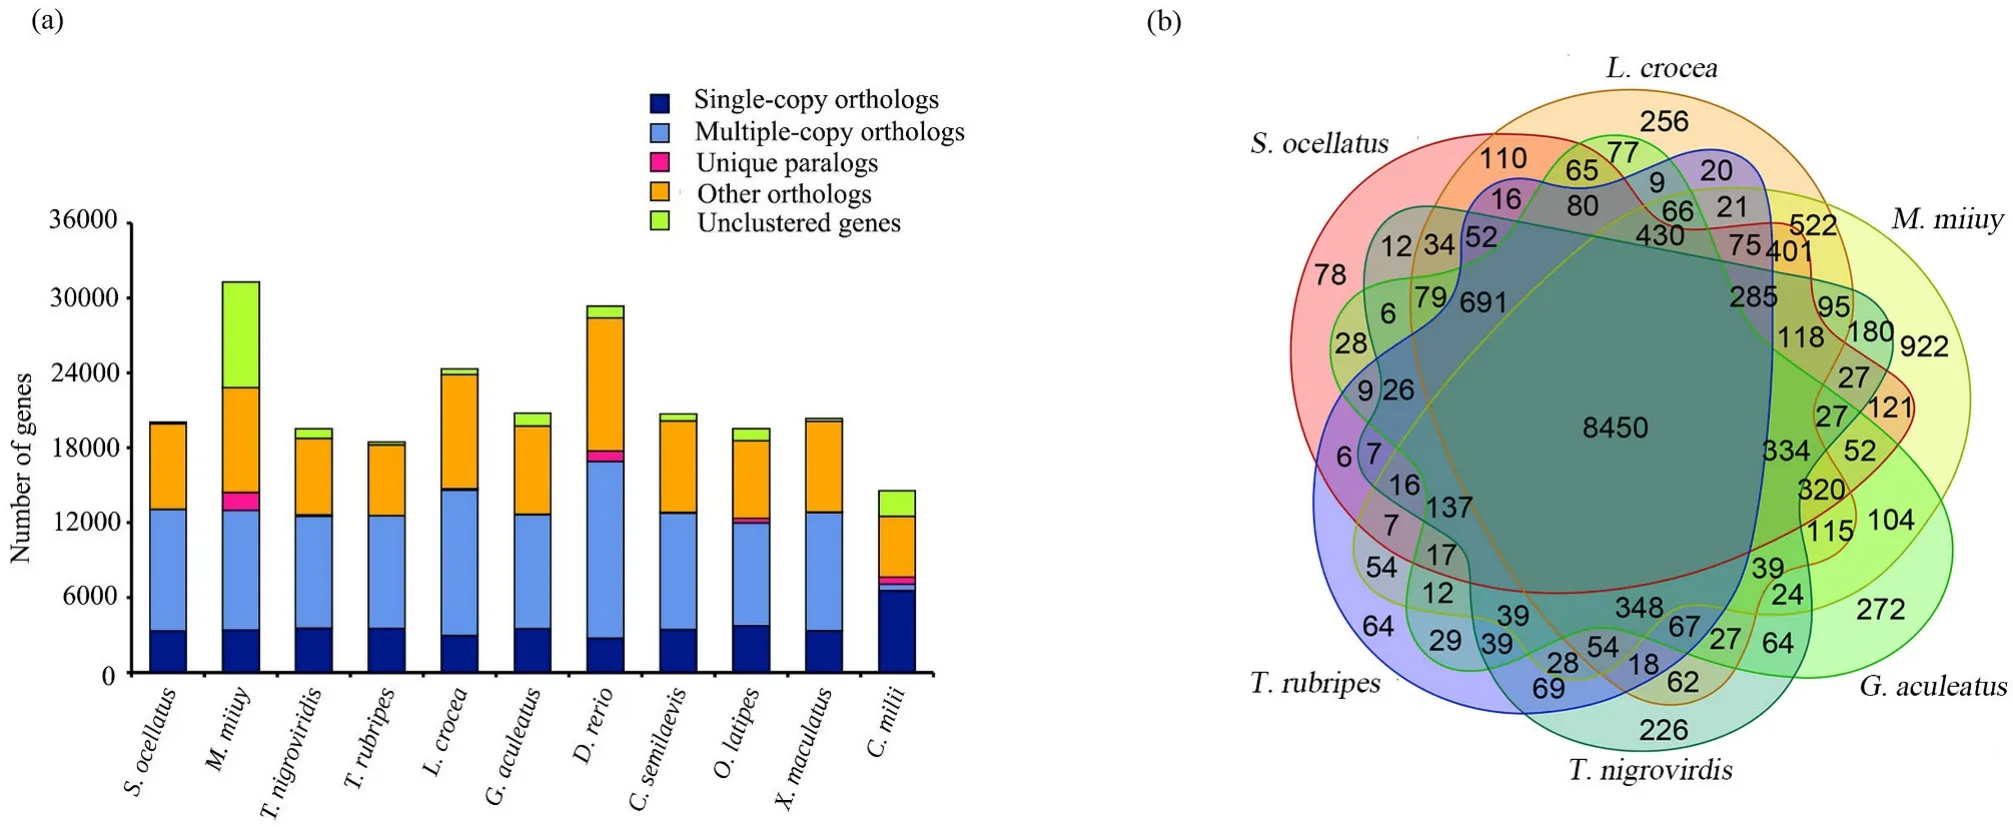
Fig. 1.Comparison of the number of homolog genes. (a) Comparison of the number of homolog genes among S. ocellatus, M. miiuy, L. crocea, D. rerio, O. latipes, G.aculeatus, T. nigroviridis, T. rubripes, C. semilaevis, X. maculatus with C. milii genome as outgroup. (b) Venn diagram of orthologous gene families. Four teleost species(S. ocellatus, L. crocea, M. miiuy, G. aculeatus, T. rubripes and T. nigrovirdis) were used to generate the Venn diagram in accordance with gene family cluster analysis.
In genome evolution analysis, the phylogenetic results showed that L. crocea was most closed to S. ocellatus. From the point of view of evolutionary relationship, this result can be an important basis for dividing them into one family. In the next, we compared the two species’chromosomes to examine the chromosome evolution events. Although each S. ocellatus chromosome was exactly aligned to L. crocea, there are also some sequences which have no valid alignment results. To figure out whether these sequences contain genes specific to the species, more studies are required. In addition, according to the Venn diagram of orthologous gene families, we found that these two species have some identical gene families although they diverged from their common ancestor 30 million years ago (Mya). To further study the relationships between the two species, these gene families can be a value resource.
In the gene family expansion and contraction analysis, we observed that 890 expanded families and 1256 contracted families. Among the expanded gene families, some of them were enriched NOD-like receptor signaling pathway. It indicates that NOD-like receptor family may play an important role in immune system of S. ocellatus. Further studies should concentrate on identifying genes that related to growth and immunity. With a large wealth of gene information available, we can understand the molecular mechanism behind the features of S. ocellatus.
5.Conclusion
Combined with long reads from 10X Genomic Chromium system and Hi-C reads, we obtained a chromosome-level genome assembly of S. ocellatus. The 686.62 Mb genome assembly consists of 49,517 contigs with N50 length of 99.71 kb and 37,872 scaffolds with N50 length of 25.6 Mb. In addition, we annotated 20,053 protein-coding genes, 99.3% of which can be functionally annotated. What’s more, we found that S. ocellatus is most related to L. crocea and we compared the chromosomes of these two species. This reference genome will be valuable resource to improve molecular assisted breeding techniques for this important valuable species. Moreover, it will provide references for the study of the genome of sciaenids.
CRediT authorship contribution statement
Tianjun Xu: analyzed the data, prepared the samples and conducted the experiments, wrote and revised the manuscript. Ye Li: analyzed the data, wrote and revised the manuscript. Qing Chu: analyzed the data,prepared the samples and conducted the experiments, wrote and revised the manuscript. Weiwei Zheng: analyzed the data.
Declaration of competing interest
The authors declare that they have no competing interests.
Acknowledgements
This work was supported by National Key Research and Development Project (2018YFD0900301).
Appendix A.Supplementary data
Supplementary data to this article can be found online at https://doi.org/10.1016/j.aaf.2020.08.001.
Date availability statement
The genome assembly have been deposited into the NCBI under accession number PRJNA578506.
 Aquaculture and Fisheries2021年2期
- Aquaculture and Fisheries的其它文章
- Editorial: Global fish passage issues
- Analysis of the impacts of socioeconomic factors on hiring an external labor force in tilapia farming in Southern Togo
- Using Bayesian Bio-economic model to evaluate the management strategies of Ommastrephes bartramii in the Northwest Pacific Ocean
- Endosymbiotic pathogen-inhibitory gut bacteria in three Indian Major Carps under polyculture system: A step toward making a probiotics consortium
- Expression of multi-domain type III antifreeze proteins from the Antarctic eelpout (Lycodichths dearborni) in transgenic tobacco plants improves cold resistance
- Loss of scleraxis leads to distinct reduction of mineralized intermuscular bone in zebra fish