
Systematically optimized topical delivery system for Loperamide hydrochloride:Formulation design,in vitro and in vivo biopharmaceutical evaluation
2018-05-17 06:35:30
Nanjing Sanhome Pharmaceutical CO.,LTD.R&D Insititute,Nanjing 211100,PR China
1.Introduction
Analgesics of opiates act to produce antinociception not only through central mechanisms but also peripheral mechanisms by local actions.The peripheral analgesic effects in response to pain by local actions of opiates exhibit greater efficacy compared with nonsteroidal anti-in flammatory agents[1]and central analgesic.Loperamide hydrochloride is a hydrophobic compound which has been originally developed as a drug for the symptomatic relief of diarrhea associated with inflammatory bowel diseases for decades[2].Meanwhile,Lop was also found to be a useful antihyperalgesic agent as a peripheral opiate agonist.Due to its high affinity and selectivity for the μ subtype of the opioid receptor,Lop has received attention as an antihyperalgesic agent that reduces pain without addiction and any other central nervous system(CNS)side effects associated with other opiate administration such as morphine and heroin[1,3].As a result,Lop could be a potent and fully efficacious hyperalgesic agent and the analgesic effects were due to topical actions at the opioid receptors in nociceptor associated with cutaneous nerves[1].
The noninvasive transdermal administration is a preferred method for pain relief.For topical drug delivery system,the main challenge was to penetrate across through the stratum corneum(SC)barrier and target the active drug into injury sites as much as possible without producing potential side effect to non-suffering organs.Thus effective drug concentration at the deeper layer(dermal/epidermal junction)must be achieved.
In topical application formulation studies,vehicle can affect both drug release and percutaneous absorption due to different solubility and different transport actions from the vehicle into the skin.Therefore,the interest of researchers has been particularly focused on the study of the effect of vehicle as possible permeation enhancers for topical drug transport[4,5].As for Lop,some of the ordinary effective topical preparations took N-methyl-2-pyrrolidone(NMP)as main vehicle in commercial products,whereas skin toxicity caused by NMP has been examined in studies of Jungbauer and the clinical use of pyrrolidone derivatives is precluded because of adverse reactions and a toxic hygroscopic contact reaction to NMP has been reported[6].DGME has been approved by the FDA for the use of cosmetic.It has been recognized as a potential transdermal permeation enhancer and drug solvent due to its lowtoxicity and biocompatibility with skin or its well solubilizing properties.Several studies have shown that DGME can significantly enhance penetration of various active compounds[7,8].DGME has also been reported to form cutaneous deposition in the skin with poorly soluble drugs like corticosteroids and griseofulvin[9,10].These emphasized the significance of DGME as vehicle in the optimization studies of topical delivery for Lop.
The systematical optimization technique includes designing a set of experiment that will credibly measure the response variables, fitting a mathematical model to the data,conducting appropriate statistical tests to ensure the best possible model is chosen and determining the optimum formulation composition[11].Thus,the objective of this study was to develop an optimum topical delivery system for Lop by 2-factor,3-level Central-Composite design,to evaluate its pharmaceutical and biopharmaceutical characteristics of Lop and finally to performin vitro-in vivocorrelation.
2.Materials and methods
2.1.Materials
Lop was purchased from Sanyou chemical company(Changzhou,China).NMP,DGME and EtOH were provided by Yuanli chemical company(Tianjin,China).Rodamine 6G was purchased from Sigma Chemical Co.(St.Louis,USA).Acetonitrile and methanol were obtained from J.T.Baker(USA)of HPLC grade.All other reagents were readily from various commercial sources of analytical grade.
2.2.Preparation of gel formulations
The formulation solution with 5%(w/v)Lop was made with vehicle mixture by agitating on an environmental shaker at 32oC.After Lop was dispersed in the formulation solution,0.75%Klucel?MF 4000(w/v)was added to the solution with continuous stirring until the solution was gelled.
2.3.HPLC analysis of Lop
The quantitative determination of Lop was performed with an HPLC system(HP1100,Agilent Technologies,Inc.)using acetonitrile-PBS(pH 3.0)(45:55,v/v)as mobile phase at a flow rate of 1.0 ml/min.The injection volume was 20μl.A 250 mm×4.6 mm C18 column(4.5μm,Hypersil,USA)was used.The UV detector was set at 220 nm and the column was maintained at 35°C.
2.4.In vitro skin permeation study
2.4.1.Skin membrane
Abdominal skin of male hairless mice was used forin vitropermeation studies.Male hairless mice(30–40 days old)weighing 18–20 g were obtained from Radiation Medicine Institute for Laboratory Animal Research,Chinese Academy of Medical Sciences(Tianjin,China).Mice were sacrificed humanely.Hair was carefully trimmed,then the abdominal skin was separated and subcutaneous fat was carefully removed.The skin membrane samples were stored at?20 °C.They were thawed to room temperature before used and equilibrated at 37°C for 1h in receptor medium(PBS,pH6.8)in Franz Diffusion Cell.
2.4.2.Skin permeation study
The excised skin mounted and clamped between the donor and receptor compartments of a Franz diffusion cell(1.77 cm2)assembly with the SC facing the donor compartment.900μl of the test formulation was applied to skin surface(35μl/cm2).The occlusive experiments were carried out with occluded donor compartments which were then covered with Para film?to minimize evaporation process.The receptor compartment(Volume=16 ml)was filled with receptor medium which was stirred continuously at 37±0.2°C with a magnetic stirrer at 500 rpm.At each predetermined time intervals(1,2,4,6,8,9,10,12 and 24 h),a sample was withdrawn from the receptor medium.
2.4.3.Skin retention determination
At the end of each time interval(1,2,4,6,8,9,10,12 and 24 h),the drug deposited within the skin was determined.The skin surface was wiped with cotton ball soaked with 50%ethanol.The tape-stripping method(average 10 strips)was used to remove the SC layer.The remaining skin(epidermis/dermis)was weighed,cut into small pieces and homogenized with 0.5 ml of methanol.The extraction solution was thencentrifuged for 10 min.The supernatant was combined and filtered for HPLC analysis.
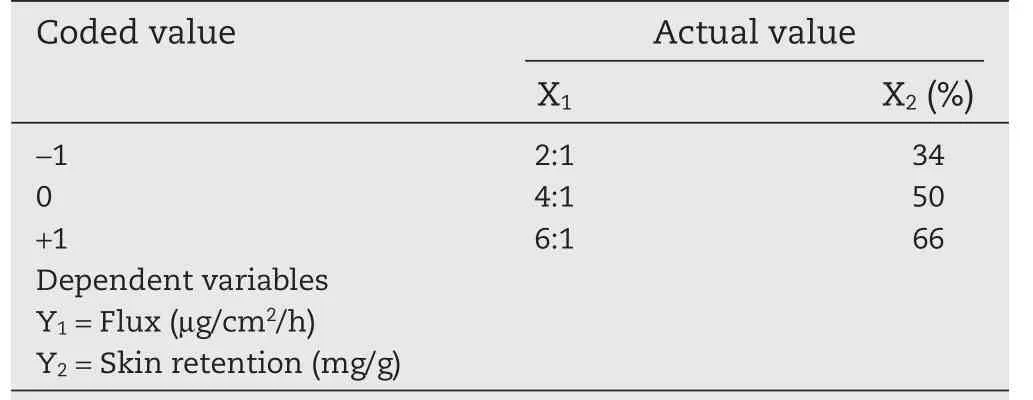
Table 1–Coded and actual values of variables in central-composite design for the preparation of Lop formulations.
2.5.Optimization studies
A faced centered cubic Central-Composite design for 32level was selected to optimize response variables by constructing second order polynomial models and exploring quadratic response surfaces with Design Expert?(version 8.0.7.1,Stat-Ease Inc.,Minneapolis,Minnesota).Mathematical modeling was carried out by the polynomial equation as follows[12]:

where Y is the dependent variable associated with each factor level combination;b0is constant;b1,b2represent linear coefficients,b3is interaction coefficient between the two factors,b4,b5are quadratic regression coefficients calculated from the observed experimental values of Y from experimental runs;the terms X1X2and X12indicates the interaction and quadratic terms,respectively[13].
The selected independent variables were the EtOH:DGME ratio(X1)and EtOH concentration(X2).The dependent variables were flux(Y1)and skin retention(Y2).The independent and dependent variable with coded levels,low(?1),medium(0)and high(+1)levels were listed in Table 1.Table 4 summarized an account of the 13 experimental runs studies.Twodimensional contour plots and three-dimensional response surface plots were also developed.
2.6.In vivo studies
2.6.1.In vivo skin permeation study
The back hair of each Wistar rat(200 g)was removed under anesthesia.The test formulations(20 mg/kg)of were applied to a circular test area.The application sites(1.77 cm2)were protected by placing a self-adhering foam pad(RestonTM,3M)supported a teflon ring chamber around the back surface.Blood samples were drawn at 0.17,0.5,1,2,4,6,8,10,12 and 24 h via retinal venous plexus.The applied skin of each rat was excised after sacrifice by cervical dislocation at the end of the experiments(24 h).Skin samples were treated same asin vitrostudy.
2.6.2.Pharmacokinetic study
The blood samples were immediately centrifuged at 10,000 rpm for 10 min,and the plasma was separated and stored at?20 °C until HPLC analysis.Analysis of pharmacokinetic data was carried out using a non-compartmental method.Pharmacokinetic parameters Cmax,Tmax,mean residence time(MRT),halflife time(T1/2),AUC0-24hand AUMC were derived directly from KINETICA 4.4(Thermo Scientific,USA).
To developin vitro-in vivocorrelation,the cumulative amount of Lop permeated across hairless mouse skinin vitrowas compared against the absorption and cumulative AUC valuesin vivo.
2.7.Confocal laser scanning microscopy(CLSM)study
For CLSM study,skin samples were obtained by mechanical vertical-section at 10μm thickness.The analysis was carried out using a Leica TCS SP5(Leica,Germany)laser scanning confocal microscopy operating at excited wavelength of 543 nm and emission wavelength of 560 nm for Rhodamine 6G(Rh6G)probe.
2.8.Statistical analysis data presentation
All of the results were statistically analyzed by Excel software.Paired two-tailed Student’s t-test was conducted to calculate the statistical significance andP<0.05 was considered to be statistically significant.Data were expressed as mean±the standard deviation.
In this paper,the penetration parameters were explained as below:
Flux:rate of steady-state penetration(diffusion process)(μg/cm2/h)
Ps:coefficient of penetration process(cm/h)
Tlag:the lag time of percutaneous penetration of drugs(The intercept on the horizontal axis)
Q24h:cumulative percutaneous penetration of drugs(skin deeper layer and blood/receptor medium)per unit area(μg/cm).
Modifier ratio(MR)for flux,lag-time and concentration of skin retention were calculated by using the following formula:
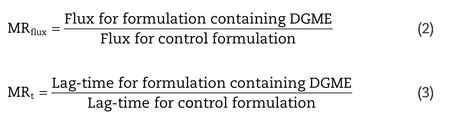


Table 2–Formulations containing Lop.
3.Results and discussion
3.1.Preliminary study of Lop formulation
The preliminary study of Lop formulation was carried out using test formulations Fcand F0(Table 2).The patent formulation Fc(NMP solvent system)was regarded as control formulation,while F0was formulation containing vehicle DGME instead of NMP without changing other compositions.The penetration parameters of flux,Ps,Q and Tlag(lag-time)were reported in Table 3.Flux of F0(21.20±6.12μg/cm2/h)suggested no clear difference with control formulation(26.11±3.29μg/cm2/h)(P>0.05,MRflux=0.81).However,the lag-time for F0(3.04±1.00h)was significantly lower than Fc(P<0.01,MRt=0.50),which revealed Lop in F0was more rapidly accumulated in the skin tissue.Meanwhile,Lop retained in skin of F0(5.69±0.79 mg/g)significantly increased compared to Fc(4.06±0.45 mg/g),which suggested Lop in F0obtained a higher skin retention concentration(MRc=1.40).
In general,the results of topical application of F0and Fcdemonstrated when DGME vehicle was employed,reduction of lag-time and almost the same skin permeation flux value were observed.DGME has been reported to increase the skin accumulation of topically applied compounds[9,14,15].This provides evidence of the significance of DGME in the formation of cutaneous depots of Lop and the ternary cosolvent gel containing DGME(DGME-EtOH-Water)seems to be candidate for a low-toxic and effective vehicle system for topical delivery of Lop.
3.2.Optimization studies
3.2.1.Fitting data to the model
For the 13 run formulations,the flux value and skin retention were taken as dependent variables and results wererecorded in Table 4.The flux value and skin retention for the 13 formulations showed a variation from 9.78±1.99μg/cm2/h to 65.48±1.67μg/cm2/h and 2.53±0.56 mg/g to 9.86±0.97 mg/g,respectively.Data was subjected to multiple regressions to yield a second-order polynomial equation.Full model of Y1and Y2were established by putting values of regression coefficients for the two response variables(Y1and Y2)respectively in Eq.1.
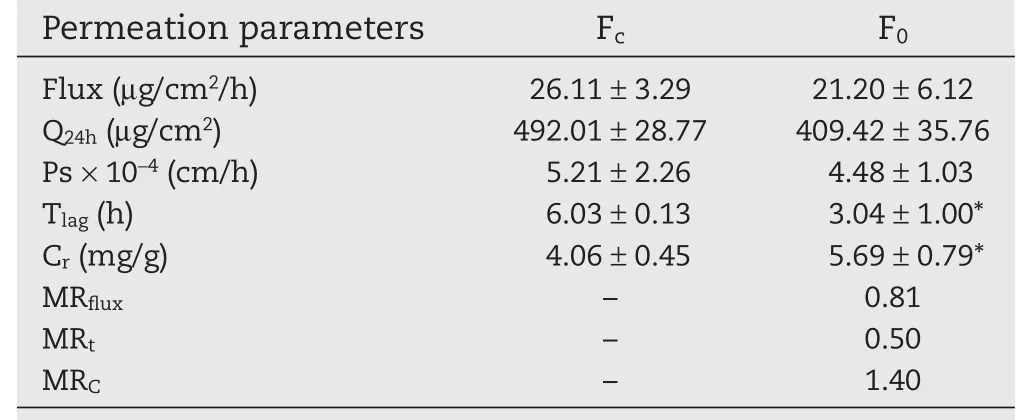
Table 3–Results ofin vitropermeation study of Lop(Preliminary study).
For flux,
For skin retention,
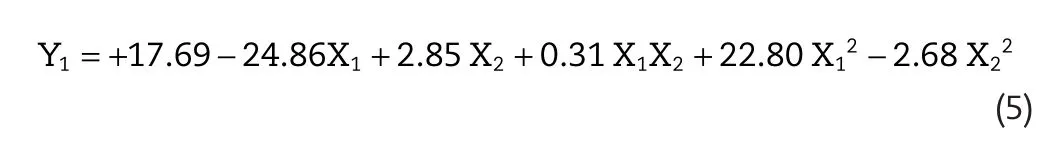
The significance of each coefficient of Eqs.5 and 6 was conducted by F-statistics andP-value.The smaller theP-value,the more significant is the corresponding coefficient[16].Based on this,effect of EtOH:DGME ratio(X1)and EtOH concentration(X2)on flux value and skin retention were found to be significant,while the quadratic term X22in skin retention and interaction term X1X2both in flux and skin retention were found to be non-significant.Non-significant terms(P>0.05)were reduced and multiple regression was carried out between the significant terms for reduced model(Eq.7 and Eq.8).
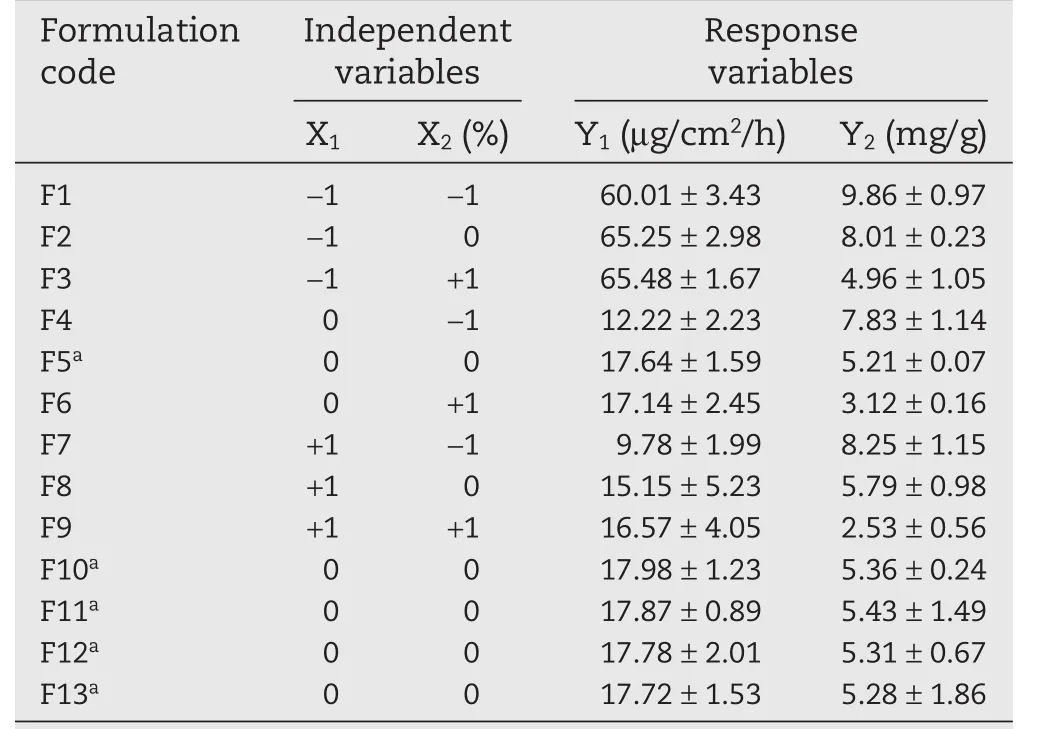
Table 4–Layout of 32factorial design showing the values of dependent variables of 13 formulations.
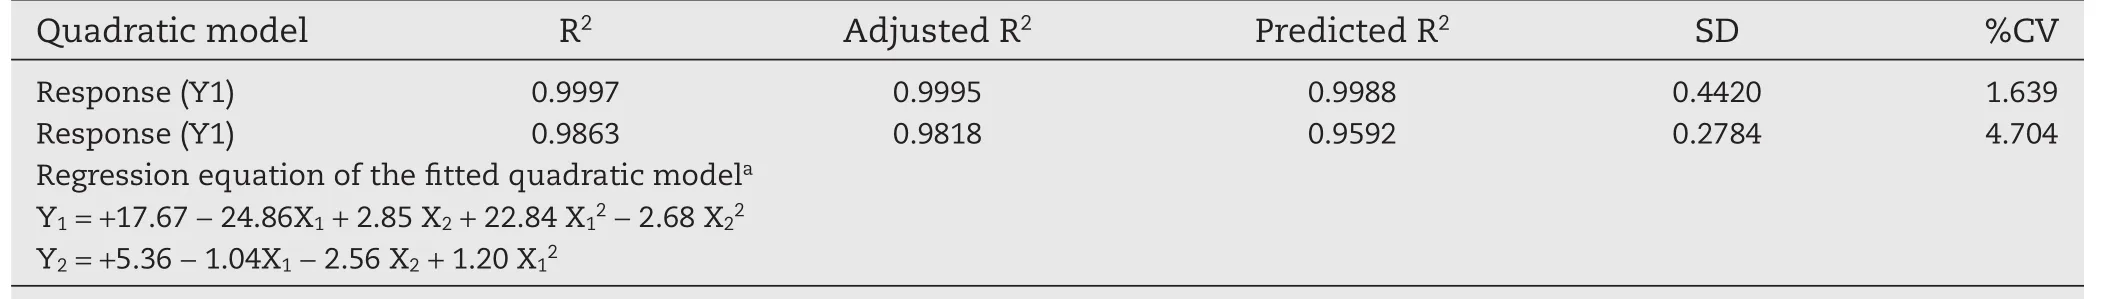
Table 5–Summary of results of regression analysis for response Y1and Y2for fitting to reduced quadratic model.
For flux,
For skin retention,
The goodness of fit of the model was checked by the determination coefficient and calculated%error value(%CV)indicates the correlation between observed values and predicted values(R2,SD,and%CV are given in Table 5).Since the values of R2were quite high for all the two responses,i.e.0.9997 and 0.9863(P<0.001),the generated polynomial equations formed excellently fits to the experimental data.The values of adjusted determination coefficients(Adj.R2=0.9995 for flux and Adj.R2=0.9818 for skin retention)were also high,which indicated a high significance of the reduced model.The predicted R2of Y1and Y2were in reasonable agreement with the adjusted R2of Y1and Y2,which proved that the derived reduced polynomial equation could be useful in prediction.
3.2.2.Effect on flux:response Y1
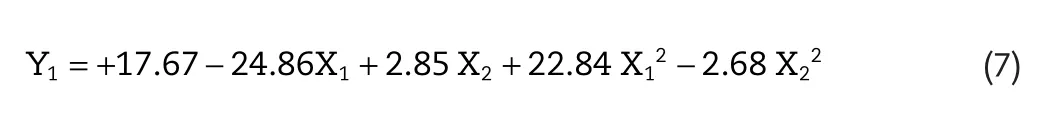
Skin permeation flux is a very important criterion for Lop topical formulation.The lowest flux was found for F7(9.78±1.99μg/cm2/h),and maximum flux(65.25±2.98μg/cm2/h)was found for F3,respectively.The following polynomial equation was generated for flux of Lop:Y1=+17.67?24.86X1+2.85 X2+22.84 X12?2.68 X22.A positive value in regression equation for a response represents an effect that benefit the optimization(synergistic effect),whereas a negative value suggests an inverse relationship(antagonistic effect)between the factor and the response[17].From the equation,it is evident that the independent variables X1have a negative effect on the response Y1( flux)whereas X2has a positive effect.
Fig.1A portrayed 2D contour plot systematically showing effect of X1and X2on flux.From the contour plot,it was found that Y1showed a low value(below 10μg/cm2/h)in the area of 0.094<X1<1,?1<X2<?0.391,while the flux above 60μg/cm2/h could be achieved with X1ranging from ?1 to ?0.922.
As seen in Fig.1B,it was observed that at fixed levels of X2,flux of Lop first decreased with increase of X1from?1 to 0.534 and further increased with X1varying from 0.534 to 1.These results clearly indicated the X1was the major factor in determining flux value and this result thereby con firmed the significant role played by X1in the skin penetration behavior.The effect of this factor might be attributed to the interaction of EtOH-DGME vehicle mixture with skin tissue.The EtOHDGME vehicle mixtures interacted with SC by altering the structure of lipophilic or keratinized domains in SC which caused a SC lipid fluidization and consequently reduced the penetration barrier properties of skin by disrupting the tightly packed lipid structure of the SC.It is worth noting that the effect of penetrating DGME itself across and into the skin should be considered especially.Some authors have con firmed that DGME itself can pass through the dense lipophilic matrix of SC and penetrate into skin[7].
3.2.3.Effect on skin retention:response Y2
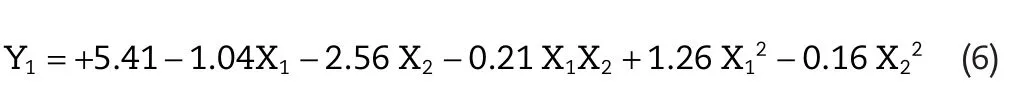
When optimizing topical drug delivery,emphasis should be placed on drug concentration in the target tissues.Thereby skin retention concentration is another important criterion for optimization of topical delivery system for Lop.F1 and F9 presented the highest(9.86±0.97 mg/g)and lowest(2.53±0.56 mg/g)skin retention value,respectively.The developed contour(Fig.1C)was found to be non-linear with upward and downward trends,indicating non-linear relationship between X1and X2.
The response Y2relating to skin retention was revealed by the equation Y2=+5.36?1.04X1?2.56 X2+1.20 X12.As revealed by the equation,when the independent variable X1was fixed,there existed a direct negative effect between EtOH concentration and skin retention.In the 3D-response surface plot showing effect of two independent variables on skin retention,it was also observed that skin retention of Lop decreased with increase in concentration of EtOH(Fig.1D).This trend of variation of skin retention with varying EtOH concentration was significantly observed in this study,which indicated skin retention of Lop were sensitive to the concentration of EtOH.It suggested that,in this case,X2showed a dominant effect in skin retention of Lop.
3.2.4.Optimization
The optimum topical formulation of Lop was selected based on the criteria of attaining the maximum value of skin retention and flux by applying point prediction method of the Design Expert software?[18]and total desirability was calculated.The desirability lies between 0 and 1 and it represents the closeness of a response to its ideal value.The selected optimum formulation,with coded values for EtOH:DGME ratio(X1)and EtOH concentration(X2)as?1 and ?0.935,respectively.The calculated desirability factor for offered formulation was 0.948,indicating suitability of the designed factorial model.The optimum formulation(denoted as Fop)contained EtOH:DGME ratio as 2:1 and EtOH concentration as 35%showed permeation flux of 60.34μg/cm2/h and skin retention of 10.01 mg/g,respectively.
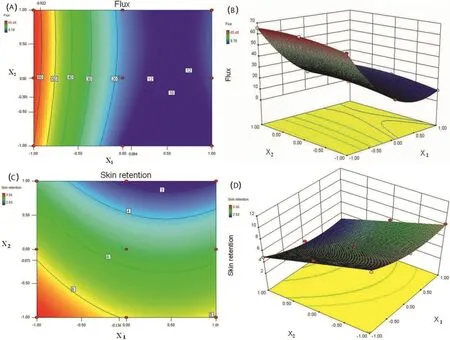
Fig.1–(A)Contour plot showing effect of X1and X2on flux value.(B)3D response surface plot showing effect of X1and X2on flux value.(C)Contour plot showing effect of X1and X2on skin retention.(D)3D response surface plot showing effect of X1and X2on skin retention.
3.3.In vitro studies
3.3.1.In vitro permeation and CLSM study
The selected optimum formulation Fopwas compared with control(Fc)forin vitroskin permeation study(Fig.2).Significant differences could be found between these two gel formulations with respect to flux and penetration lag-time(P<0.01,P<0.05).Flux for Fopgel was promoted to more than 2-fold of Fcgel(MRflux=2.31).Skin retention enhancing effect of Fopgel was also observed(MRc=2.47).
In order to visualize the skin delivery of Fop and Fc,they were made fluorescent by the inclusion of Rhodamine 6G,a red dye(logP=3.4,Rh6G),which was supposedly to imitate the behavior of Lop(logP=3.1).As shown in Fig.2,it was clear that the penetration of Fc was con fined to the upper skin layer with less retention in the deeper skin than Fop.While the CLSM images of Fop(with bright fluorescence throughout epidermis/dermis)showed enhanced delivery of active agents as far as the deeper layer of skin and improved skin retention.
3.3.2.In vitro dermatokinetic study
Fig.2 also showed the distribution of Lop skin retention(epidermis/dermis)of the hairless mice.Delivery of Lop in the skin layers by optimum gel Fop was found to be significantly greater than Fc.Table 6 gives the numeric values of dermatokinetic parameters AUC,Cskin max and Tskin max.The maximum concentration achieved in skin(Cskin max)for Fop and Fc was 22.44±3.81 mg/g and 16.56±1.88 mg/g,respectively.Moreover,AUC of Lop in skin for Fop was also found to be higher than Fc.The results,therefore,con firmed that Lop in Fop travelling as far as the deeper skin layer and forming deposition within the skin.The main challenge for topical delivery system is to penetrate across through the SC barrier and target the active drug into injury sites as much as possible.Thus,the transport characteristics of Fop showed the expected results.
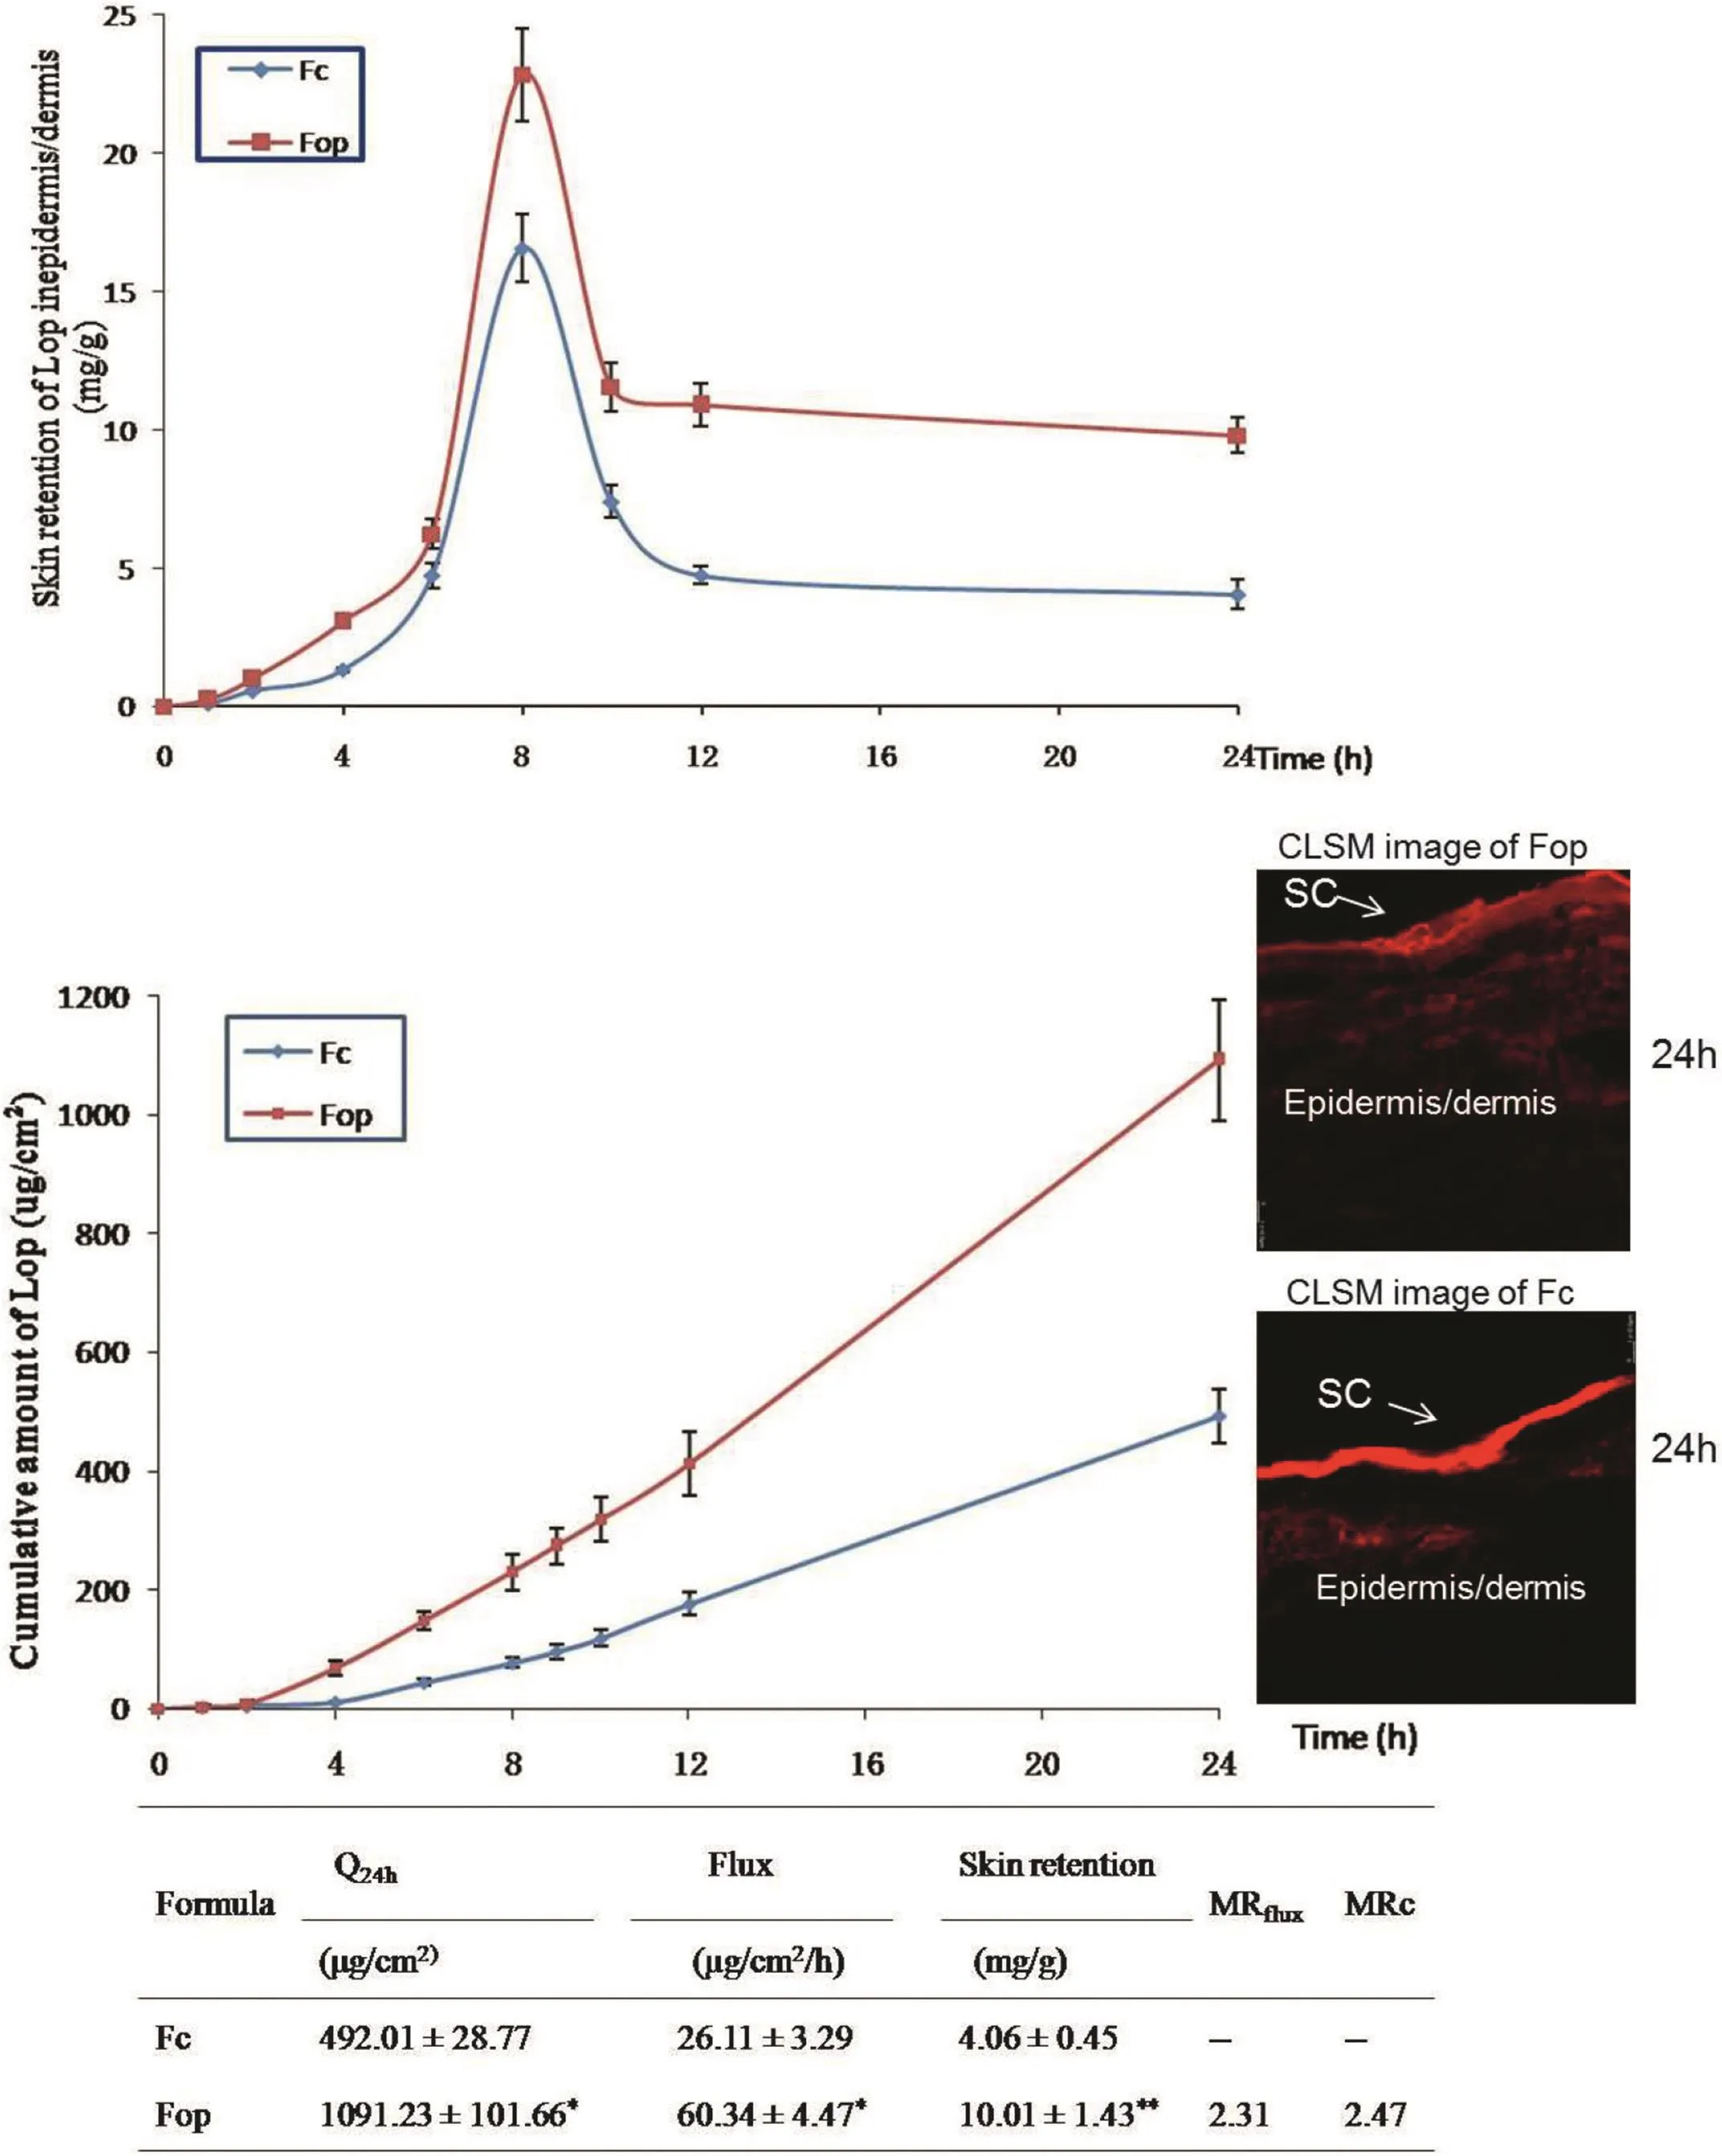
Fig.2–The amount of drug present in the skin(epidermis/dermis)of hairless mice at various time points,in vitropermeation pro files and CLSM images of vertical section of skin incubated with corresponding formulations(Fop,Fc)containing the label Rhodamine 6G.Data were presented as mean±SD(n=6).
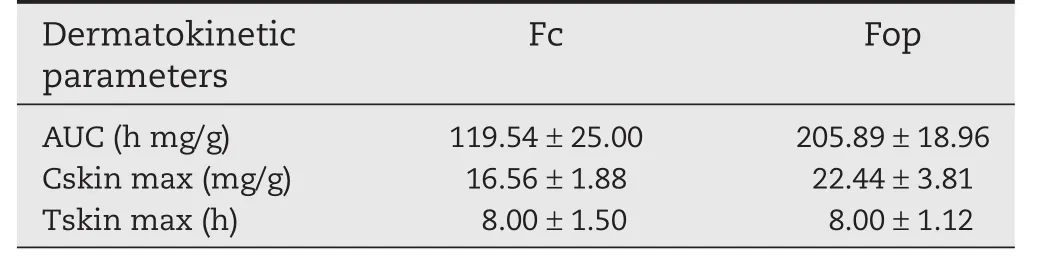
Table 6–Dermatokinetic parameters of Lop topical formulations in epidermis and dermis retention in hairless mice skin(n=3).
3.4.In vivo studies
3.4.1.In vivo skin permeation study
After 24 h ofin vivoapplication experiment,the amount of lop retained in the epidermis/dermis of rat skin was determined by HPLC to evaluatein vivoskin retention.Fc delivered only 6.78%of applied Lop dose to deeper layer,whereas Fop delivered a significantly higher(P<0.05)skin retention to deeper layer(epidermis/dermis)compared to Fc,i.e.it provided 13.12%of the initial dose.The DGME containing formulation Fop showing superior efficacy inin vitroskin permeation study,displayed the same tendency inin vivostudy.Such a result was in agreement within vitrostudies.
3.4.2.Pharmacokinetic study
The mean plasma concentration-time curve of Lop after topical application of Fop and Fc was presented in Fig.3A.Pharmacokinetic parameters were fitted by non-compartment analysis model.AUC-time of Lop was displayed in Fig.3B and the pharmacokinetic parameters were also shown in Table 7.MRT of Fop(24.10±0.12 h)was much longer than Fc(10.42±2.69 h),which strongly veri fied drug retainedin vivofor longer time.Though exhibited sustained release behavior,Fc approached the maximum concentration within 4 h,which was shorter than Fop(Tmax=6.0 h).Hence,pharmacokinetic results demonstrated that Fop significantly improve the sustained release of Lopin vivo.
Furthermore,Fop provided much lower AUC0-24hvalue(974.23±81.12 h ng/ml)than Fc(1751.39±198.55 h ng/ml).The results revealed,for Fop,small amount of drug accessed intoblood circulation.For topical drug delivery,enhancing retention of the applied active ingredients in the skin layer with fewer amounts into blood circulation leads to low potential systematic side and toxic effects.
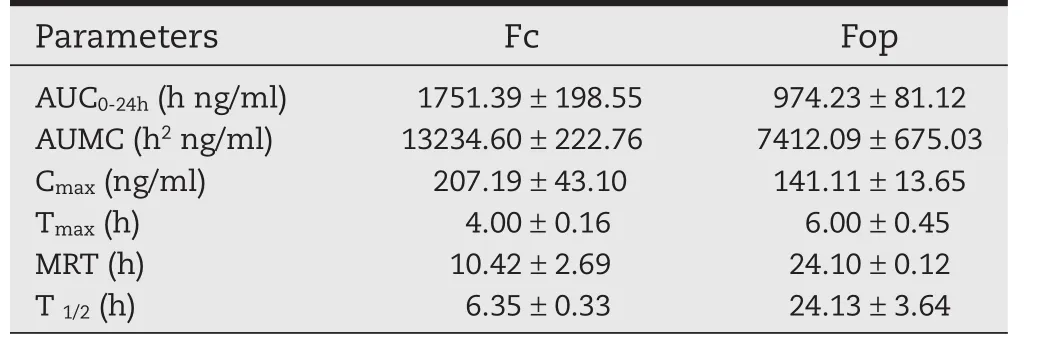
Table 7–Pharmacokinetic parameters of Lop after topical application of Fc and Fop in rats(n=3).
3.4.3.In vitro-in vivo correlation
In vitro-in vivocorrelation between the cumulative amounts of drug permeated across hairless micein vitroand AUC plasma at the same time point showed triphasic curve pattern(Fig.4).It can be distinguished into three stages for both Fc and Fop.Correlation coefficient R2values during the three phases were all observed to be over 0.970,which indicated good linear correlation.This point to point correlation ofin vitropermeation toin vivoperformance followed type A correlation[19].This excellentin vitro-in vivorelationship demonstrated thatin vitroexperiments of Lop can be used to screen formulations and predict preclinical and clinical pharmacokinetics in further studies.
4.Conclusions
In summary,the optimum formulation was evaluated byin vitropermeation study,dermatokinetic analysis andin vivopharmacokinetic study.Goodin vitro-in vivocorrelation was obtained.Bothin vitroandin vivostudies showed consistent results that Fopcan achieve sufficient delivery across skin,enhance intracutaneous depot and decrease the risk of side effect.
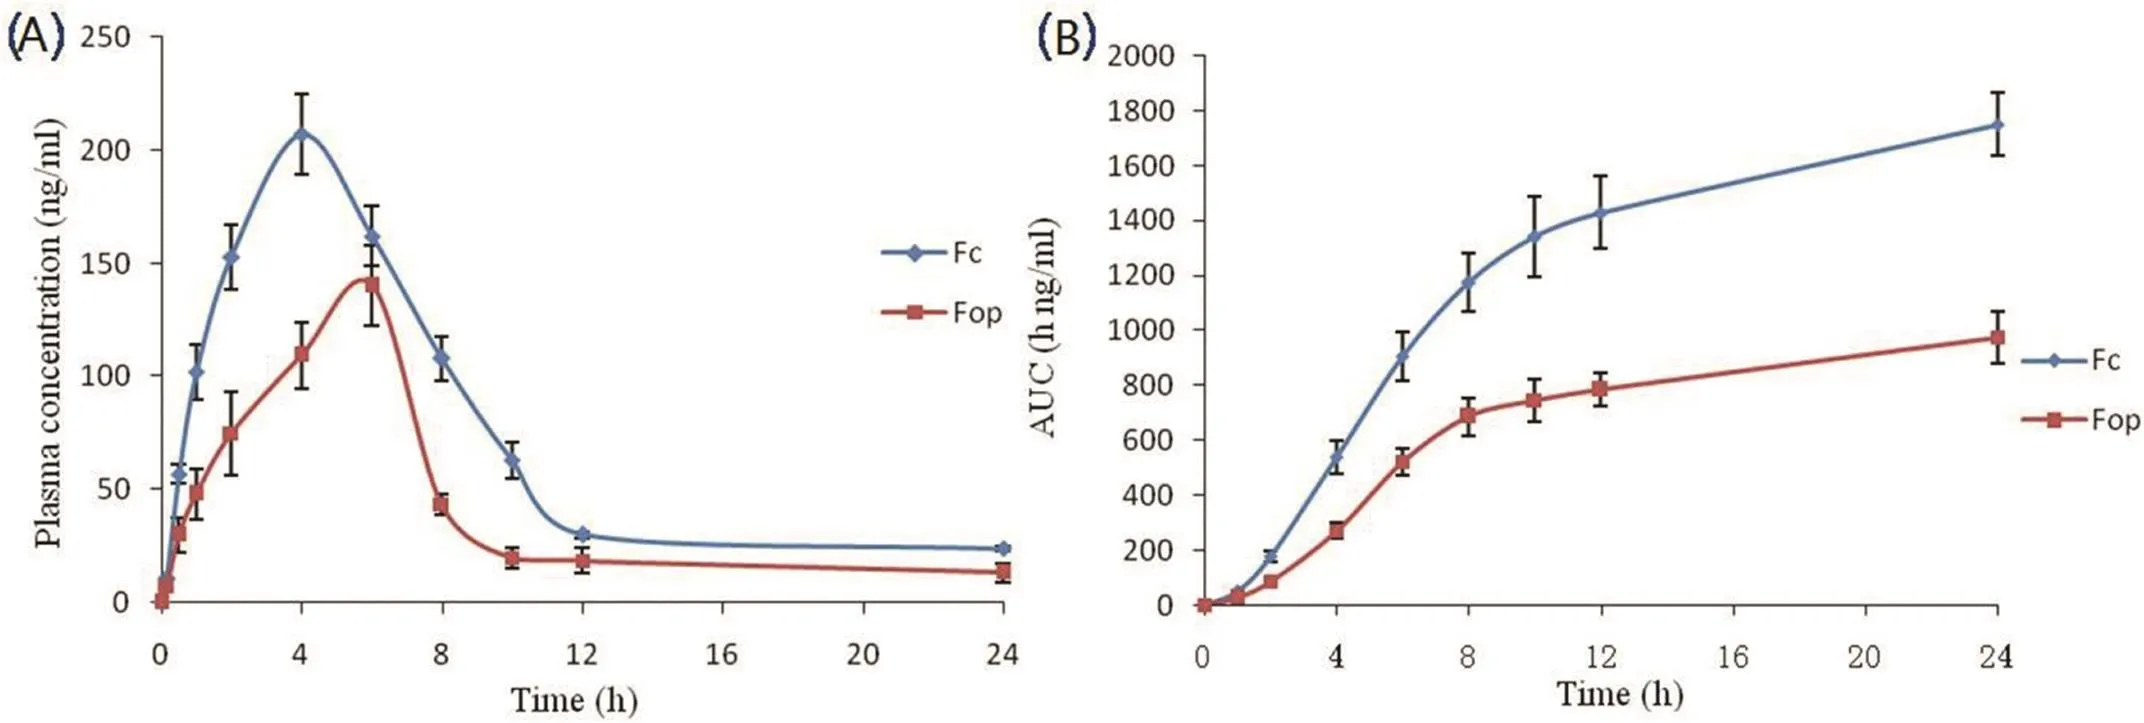
Fig.3–(A)Plasma concentration–time pro files of Lop after topical application of Fop and Fc.(B)AUC-time pro files of Lop after topical application of Fop and Fc.Data were presented as mean±SD(n=3).
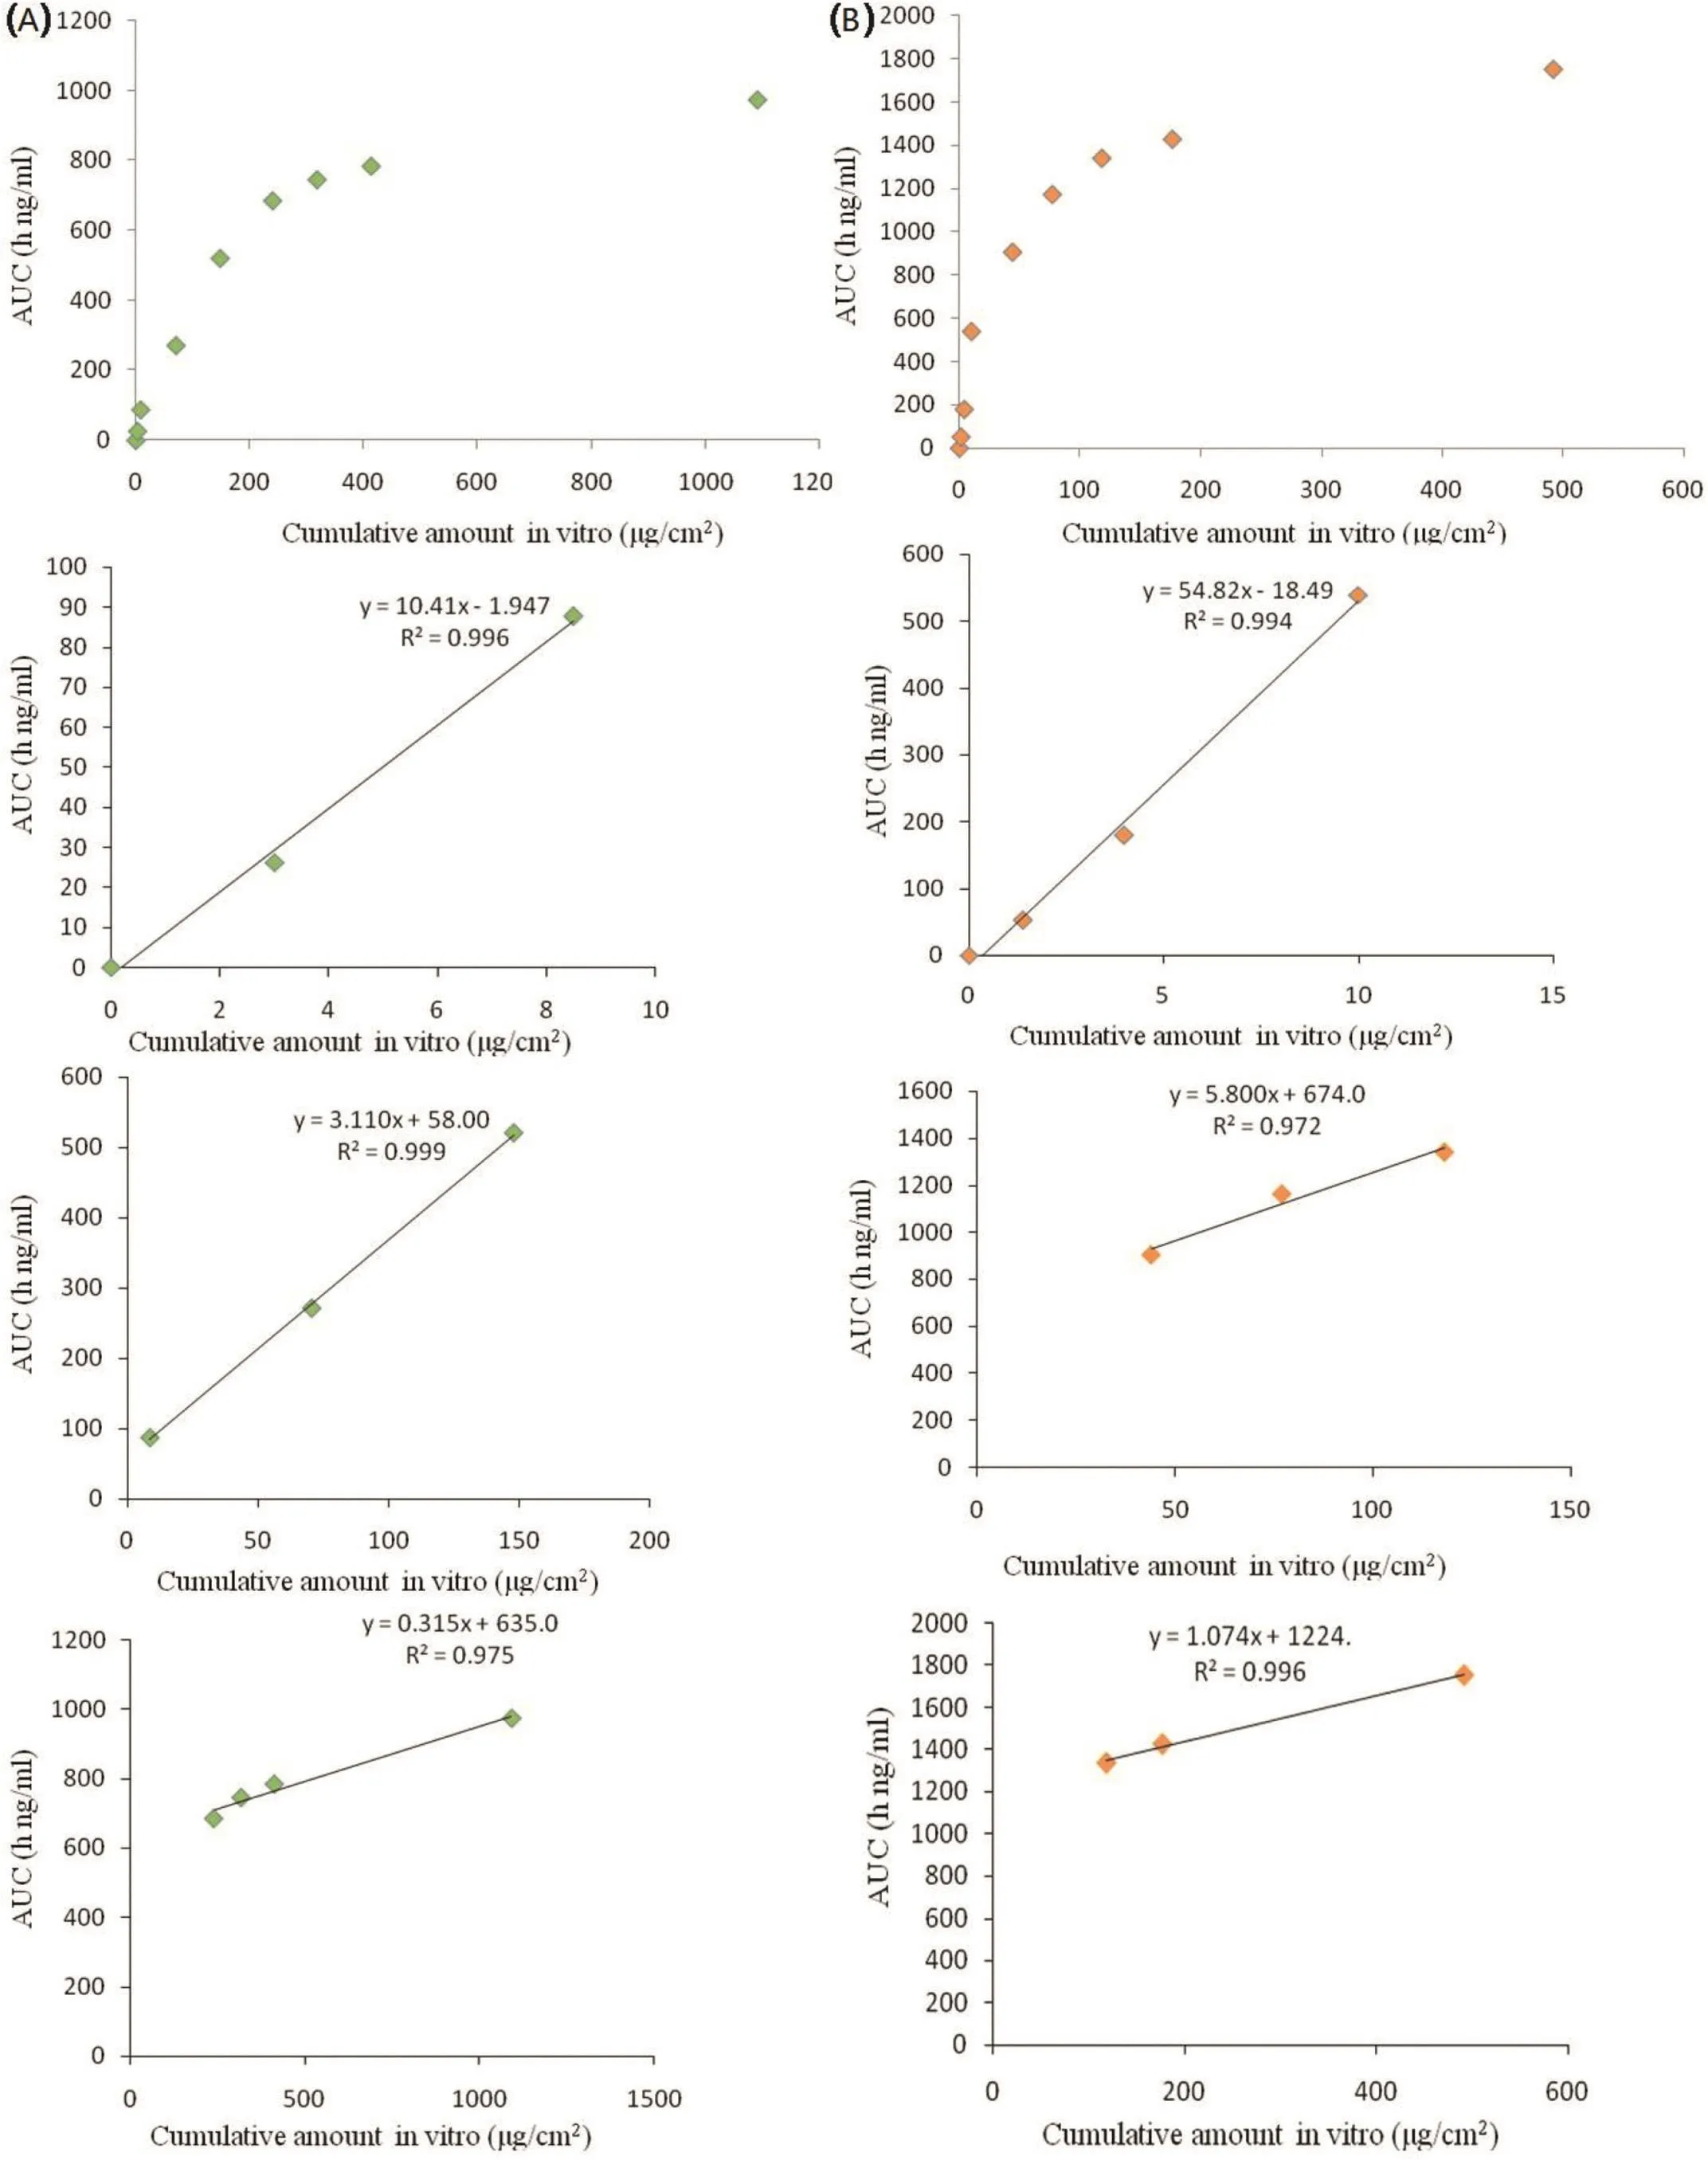
Fig.4 –In vitro–in vivocorrelation for Fop(A)and Fc(B)of cumulative amount permeatedin vitroversus plasma AUC in rats(n=3).
Declaration of con flict interest
The authors report no conflicts of interest.The authors alone are responsible for the content and writing of this article.
R E F E R E N C E S
 Asian Journal of Pharmacentical Sciences2018年3期
- Asian Journal of Pharmacentical Sciences的其它文章
- LAL test and RPT for endotoxin detection of CPT-11/DSPE-mPEGnanoformulation:What if traditional methods are not applicable?
- Activity of Brucea javanica oil emulsion against gastric ulcers in rodents
- Model evaluation for the prediction of solubility of active pharmaceutical ingredients(APIs)to guide solid–liquid separator design
- Investigating the molecular dissolution process of binary solid dispersions by molecular dynamics simulations
- Preparation of glutinous rice starch/polyvinyl alcohol copolymer electrospun fibers for using as a drug delivery carrier
- Intra-articular delivery of tetramethylpyrazine microspheres with enhanced articular cavity retention for treating osteoarthritis