Temporal variations in aerosol composition at Lanzhou City, Northwestern China
Feng She, YiFan Cheng, ShiGong Wang, YongTao Guo,JinYan Wang, MinJing Ma, KeZheng Shang
Key Laboratory for Semi-Arid Climate Change of the Ministry of Education, College of Atmospheric Sciences, Lanzhou University,Lanzhou 730000, China
Temporal variations in aerosol composition at Lanzhou City, Northwestern China
Feng She, YiFan Cheng, ShiGong Wang*, YongTao Guo,JinYan Wang, MinJing Ma, KeZheng Shang
Key Laboratory for Semi-Arid Climate Change of the Ministry of Education, College of Atmospheric Sciences, Lanzhou University,Lanzhou 730000, China
Although Lanzhou is one of the most heavily polluted cities in China, the composition of its air pollutants have not yet been studied in detail. The data of four months on the concentrations and compositions of ions from daily air-filter samples in the winter and spring during 2007–2008 were analyzed to investigate temporal trends and their possible causes. The results indicate that mean concentrations of almost all the aerosol components are greater in winter than in spring due to stronger emissions in winter and weaker localized dispersion. Spring dust storms are the major cause of the highest peak PM10concentrations recorded during the study period; however, these elevated levels were transient. Ion concentrations related to coal combustion show the greatest reduction from winter to spring, while the concentrations of strong crustal components show a less-pronounced reduction. Strong cycles in the levels of particulate matter (PM) and all ions are also observed during the winter months due to meteorological conditions.Depending on the season, nine different ions accounted for 20%–50% of the PM concentration. The particle size of polluting ions was constant at times of increasing PM concentrations (particularly during winter), whereas the particle size of crustal ions increased dramatically during spring dust storms. Local meteorological conditions (especially wind speed) have a strong influence on the levels of pollutants. Four dust storms were noted, including one during winter. In summary, the regional transport of desert dust from the Gobi can significantly affect air quality and the chemical composition of aerosols in Lanzhou. The dust storms can strongly increase concentration of crustal ions, which are characteristics of deserts in northwestern China. This observation is in agreement with back-trajectories, which show reduced levels of pollutant ions during dust storms. Data on nitrate:sulfate ratios indicate that stationary point sources are the main source of ions rather than mobile sources.
dust storm; ions; Lanzhou City; PM10; PM2.5
1. Introduction
In recent years, particulate matter (PM) has attracted increasing scientific interest due to its important role in many atmospheric processes (Popeet al., 2002; Watson, 2002;Tsaiet al., 2003; Penget al., 2005; Yuanet al., 2006; Intergovernmental Panel on Climate Change (IPCC), 2007).
Lanzhou is one of the largest cities in northwestern China and is also the most polluted city in the country, particularly during winter (Chuet al., 2008b). Aerosol PM is the main pollutant. The web site of the Ministry of Environmental Protection of People’s Republic of China (MEPPRC)(http://datacenter.mep.gov.cn/) provides pollution data for Lanzhou, revealing that since June 2000, the number of days with pollution levels worse than Grade II (Air Pollution Index, API > 100) and worse than heavy pollution (API > 300)have ranked third and second, respectively, among major Chinese cities. Nearly 66% of these days (API > 100), 88%of these days (API > 200), and 90% of these days (API > 300)were during the winter (December–February) and spring(March–May). On these polluted days, the primary air pollutant is PM; consequently, Lanzhou is facing long-term problems with PM, especially in spring and winter.
Several factors contribute to high PM levels in Lanzhou,including strong local emissions (industry, traffic,etc.), restricted air circulation in the valley surrounding the city, and dust intrusions from deserts to the north and west (Wanget al., 2009). Some preliminary studies have assessed PM concentrations (Chuet al., 2008b) and their influence on human health in Lanzhou (Huanget al., 2001; Yanget al.,2005). Wanget al. (1999) found positive correlations between dust storm occurrence in the Hexi Corridor and PM concentrations in Lanzhou. In our previous work, we studied annual and diurnal variations in concentrations of PM of different sizes (TSP, PM10, PM2.5and PM1.0) in Lanzhou(Wanget al., 2009). However, few studies have examined the ionic component of PM. In the atmosphere of many urban areas, particulate matter is dominated by inorganic constituents. The presence of ionic components results in increased solubility of toxic organic compounds, thereby increasing their toxicity (Wanget al., 2003). In other Chinese cities, ionic components may constitute up to one third of the aerosol component (Heet al., 2001; Huet al., 2002; Yaoet al.,2002; Wanget al., 2006; Shenet al., 2009a). Because most of the common ions in aerosols are pollutants in these cities,ion levels are good indicators of overall pollution levels.
This study documents concentrations of a variety of PM and ions in Lanzhou aerosols based on continuous sampling during two seasons with strong pollution (December 2007 to February 2008, and in May 2008). Data on the relative abundance of ions, and their temporal variations, also provide an insight into the sources of PM and ultimately enable us to evaluate air quality in Lanzhou City.
2. Experimental methods
2.1. Description of study area
Lanzhou (36.04°N, 103.51°E; elevation 1,518 m) is the capital of Gansu Province and one of the major industrial cities in northwestern China. Lanzhou’s population of 1.5 million is distributed over 210 km2, in a narrow (2–8 km wide) and long (approximately 35 km) northwest–southeast trending valley at the intersection of the Qinghai-Tibet Plateau, the Inner Mongolian Plateau, and the Loess Plateau.The valley is surrounded by mountains with heights of 500–600 m above the valley floor. The background climate of Lanzhou is a continental semiarid climate, with an annual mean air temperature of 9.3 °C and precipitation of 327.7 mm (Taet al., 2004). Major industries in the urban area are petrochemical refining and manufacturing, and coal combustion provides the predominant energy source for Lanzhou (Zhanget al., 2001). There has been a rapid increase in vehicle exhaust emissions in recent years.
The topography and meteorology of Lanzhou are favorable to the development of air pollution especially in winter.According to Jianget al. (2001), the annual frequency of inversions in Lanzhou valley is 81% (the maximum occurs in winter (96%) and the minimum in summer (66%)). The frequent development of inversions limits the dispersion of air and traps aerosol particles, which accumulate in the valley and cause heavy air pollution. In addition, the process of dust storms transportation also impacts Lanzhou air pollution. The storms originate mainly from the Tarim Basin and from the Alashan–Hexi Corridor region, which are both directly upwind of Lanzhou in terms of the dominant winds.Dust storms are frequent in spring, supplying large amounts of aerosol particles to the atmosphere; this, coupled with local emissions in Lanzhou itself, leads to complex variations in the aerosol composition during winter and spring.
2.2. Sampling
PM10and PM2.5samples were simultaneously collected from December 2007 through February 2008, and in May 2008, using medium-volume samplers (Wuhan Tianhong Instrument Co., Ltd.; TSP/PM10/PM5/PM2.5detection; flow rate of 100 L/min), located on the roof of an office building of Lanzhou University in the eastern part of the city, at a height of 55 m (high enough to avoid contamination by locally re-suspended dust). There were no significant pollution sources near the collection site. Samples were usually collected daily from 10:00 to 22:00 local time (all times are given in local time); during dust storms, additional samples were collected overnight (22:00 to 10:00). The samples were collected on glass-fiber filters (Shanghai Huanao Scientific Trading Co., Ltd; diameter 90 mm); they were placed in polyethylene plastic bags immediately after sampling and were refrigerated until analysis. Before weighing, the filters were equilibrated for 24 hrs at constant temperature (20–23°C) and relative humidity (35%–45%). Following equilibration, each filter was weighed (Mettler Toledo balance,model AE200; reading precision 10 μg) at least three times before and after sampling.
A total of 187 aerosol samples were collected (109 PM10and 78 PM2.5fractions), including seven pairs of dust storm(DS) samples (five pairs in spring and two pairs in winter;one PM2.5winter sample was missing because of equipment failure). Three blank samples were collected as controls.During the sampling periods, meteorological data such as air temperature, atmospheric pressure, dew point temperature,surface wind speed, horizontal visibility, and rainfall were recorded from the Lanzhou surface meteorological station of the China Meteorological Administration. The measurements were conducted with strict adherence to the Chinese National Standards of Ambient Air Quality Monitoring, including "GB/T 15432", "GB 6921-86" and "HJ/T 194-2005"(http://kjs.mep.gov.cn/hjbhbz/).
2.3. Ion analyses
Three-quarters of each sample or blank was extracted ultrasonically in 10 mL of water deionized to a resistivity of 18 MΩ/cm (Millipore, France), and then placed in an ultrasonic water bath and shaken three times for 20 min each(total of 60 min), to completely extract the ions. After all the extracted samples had been filtered through microporous membranes (pore size 0.45 μm; diameter 25 mm; Shanghai Jicheng Analytical Instruments Co., Ltd.), the filtrates were stored at 4 °C in a clean plastic bottle before analysis. Concentrations of four anions (F–, Cl–, NO3–, and) and five cations (Na+, NH4+, K+, Ca2+, and Mg2+) were determined by ion chromatography (IC) (Metrohm, model 792). Cation concentrations were determined with a Metrosep C2 column(4.0×150 mm), using an eluent of 4 mmol/L tartaric acid plus 0.75 mmol/L pyridine-2-carboxylic acid (Eastgate,White Lund, Morecambe, England). The detection limits of Na+,, K+, Ca2+, and Mg2+ions were 0.01, 0.01, 0.01,0.03, and 0.05 mg/L, respectively. Anions were separated with a Metrosep A Supp4 column (4.0×250 mm), using an eluent of 4 mmol/L NaHCO3plus 1 mmol/L Na2CO3. The detection limits of F–, Cl–,, andions were 0.001,0.001, 0.01, and 0.001 mg/L, respectively. The reproducibility of the results was better than 98% for all ions. Analytical grade reagents and solvents were used in all analyses. Sample concentrations were corrected by subtracting the mean values obtained for blanks.
2.4. Air mass trajectories
To identify the transport pathways of dust, air mass back-trajectories were calculated with the NOAA Hybrid Single-Particle Lagrangian Integrated Trajectory (HYSPLIT)model (National Oceanic and Atmospheric Administration(NOAA), www.arl.noaa.gov/ready/hysplit4.html). Figure 1 shows air mass back-trajectories for 2 and 3 May 2008, indicating two different dust-invasion pathways. In Figure 1a and 1b, the surface layer below 1,500 m appears to be influenced by the dust storms, as the back-trajectories from all heights within this layer shows that air masses reaching the city originated from the arid region northwest of Lanzhou(particularly from the Alashan–Hexi Corridor region). In Figure 1c, the surface layer below 600 m appears to be influenced by the dust storms, via a similar pathway to that above, but the higher troposphere over Lanzhou was dominated by a different pathway, which originated from the Tarim Basin (Figure 1d). Overall, the atmospheric boundary layer in Lanzhou appears to have been influenced by the dust storms.
3. Results and discussion
3.1. Mean concentrations of PM and ions
Mean concentrations of PM10and PM2.5during the winter and spring of 2007 and 2008 are presented in Table 1.Average PM10concentrations are 420 μg/m3and 330 μg/m3during winter and spring, respectively, and average PM2.5concentrations are 190 μg/m3and 75 μg/m3. During these periods, PM10concentrations far exceed the Chinese Grade III air quality standard (daily mean of 250 μg/m3) (MEPPRC,1996, http://www.sepa.gov.cn/image20010518/5298.pdf).The result is slightly higher than the value reported previously in 2005 for Lanzhou (Wanget al., 2009). The PM2.5concentration exceeds the 24-h American air quality standard of 35 μg/m3and the yearly mean standard of 15 μg/m3(EPA, 2006). PM10concentrations in Lanzhou are higher than those reported in other Chinese cites, including Hangzhou in 2001–2002 (Caoet al., 2009), Chongqing in 2001(Luoet al., 2005), Guangzhou and Hong Kong in 2002 (Laiet al., 2007), and Kaohsiung in 1998–1999 (Jim, 2002). The PM2.5concentration in Lanzhou is also much higher than those in other major Chinese cities, including Qingdao in 1997–2000 (Huet al., 2002), Xiamen in 1993 (Gaoet al.,1996), and Hong Kong in 2000 (Hoet al., 2003). Historically the concentration of PM2.5has shown a marked increase.
The concentrations of PM2.5and PM10are higher in winter than in spring, while the coefficients of variation are higher in spring, especially for PM10. Peak PM2.5and PM10values are 560 μg/m3and 1,220 μg/m3, respectively, far exceeding Chinese air quality standards. High particulate concentrations (PM2.5> 100 μg/m3and PM10> 400 μg/m3) occur on many days during the observational period.
Wangset al. (2006) found that most dust storm events in China occurred during the spring. The dust that influences air quality in Lanzhou probably originates from arid regions in the northwest (Figure 1). Moreover, the appearance of high PM concentrations generally coincides with dust storm events, indicating that PM levels are related to dust transportation from arid regions rather than local sources. Dust contributes to higher concentrations of coarse (vs. fine) particles, indicative of dust’s coarse nature. The PM10maximum appears during a dust storm event in spring, while the PM2.5maximum takes place during a heavy pollution day in winter. The dust also increased the coefficient of variation(Cv= SD/mean) of PM10in spring.
PM2.5and PM10concentrations show a strong linear correlation in both winter (December–February, DJF) (r=0.90,n=49) and spring (r=0.83,n=29); linear regressions for these relationships arey=0.45x+6.7 andy=0.15x+27, respectively,indicating the steeper slope (higher ratios of PM2.5to PM10)of the wintertime relationship. The slope differences between winter and spring reflect variations of the sources of the particles in the two seasons;i.e., internal combustion sources in winter and external dust sources in spring. The one outlier from the winter dataset (PM2.5=160 μg/m3,PM10=967 μg/m3) represents a dust storm event in the late December (Figure 2), indicating that dust storms in winter are similar to those of spring. The contribution of coarse dust storm particles to Lanzhou air pollution is also reflected by the mean PM2.5:PM10ratio of 0.37, which is lower than values observed in many other areas of China;e.g., Nanjing(Wanget al., 2003), Hong Kong (Hoet al., 2003), central Taiwan (Fanget al., 1999), and Kaohsiung (Jim, 2002).
The concentrations of ions in Lanzhou air samples are given in Table 2. Of the PM10fraction, the principal ion species in decreasing order in winter are>>4> Cl–, while in spring the species are> Ca2+>>Cl–. The sum of these principal ions constitutes 84.8% and 83.5% of the total ion concentrations in winter and spring,respectively. In the PM2.5fraction, the principal ion species in winter, in the order of decreasing abundance, are SO42–>>> Cl–, while in spring are>> Ca2+>; these ions constitute 89.3% and 83.1% of the total ion concentrations in winter and spring, respectively. The most abundant ionin all samples mostly refers to the energy source, reflecting the coal combustion in Lanzhou.
Ions constitute a high percentage of the total mass of the PM10and PM2.5fractions: 40% and 53% respectively in winter, and 17% and 37% respectively in spring. These values indicate that ions are a higher proportion of the fine particle component than of the coarse particle component.
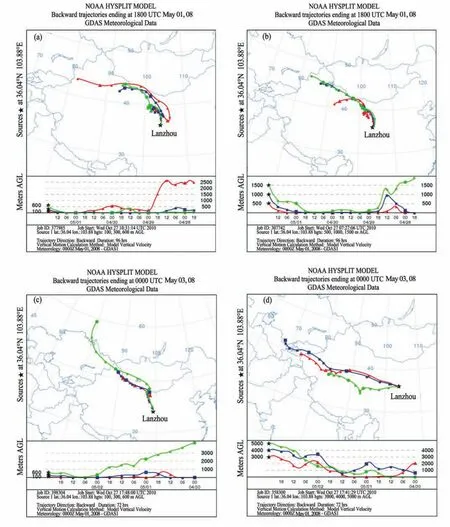
Figure 1 Air mass back-trajectories at different heights in Lanzhou during dust storms.(a) (b) Data for heights of 100 m, 300 m, 0.5 km, 0.6 km, 1 km, and 1.5 km on May 2, 2008, at 02:00 local time (May 1, 18:00 UTC) for 96 hrs; (c) (d) data for 100 m, 200 m, 400 m, 3 km, 4 km, and 5 km on May 3, 2008, at 08:00 local time (May 3, 00:00 UTC) for 72 hrs.

Table 1 Concentrations (μg/m3) of PM10 and PM2.5 fractions as a function of season in Lanzhou, including statistical values representing the sample size (n), maxima, minima, mean, standard deviation (SD) and the coefficient of variation (Cv).
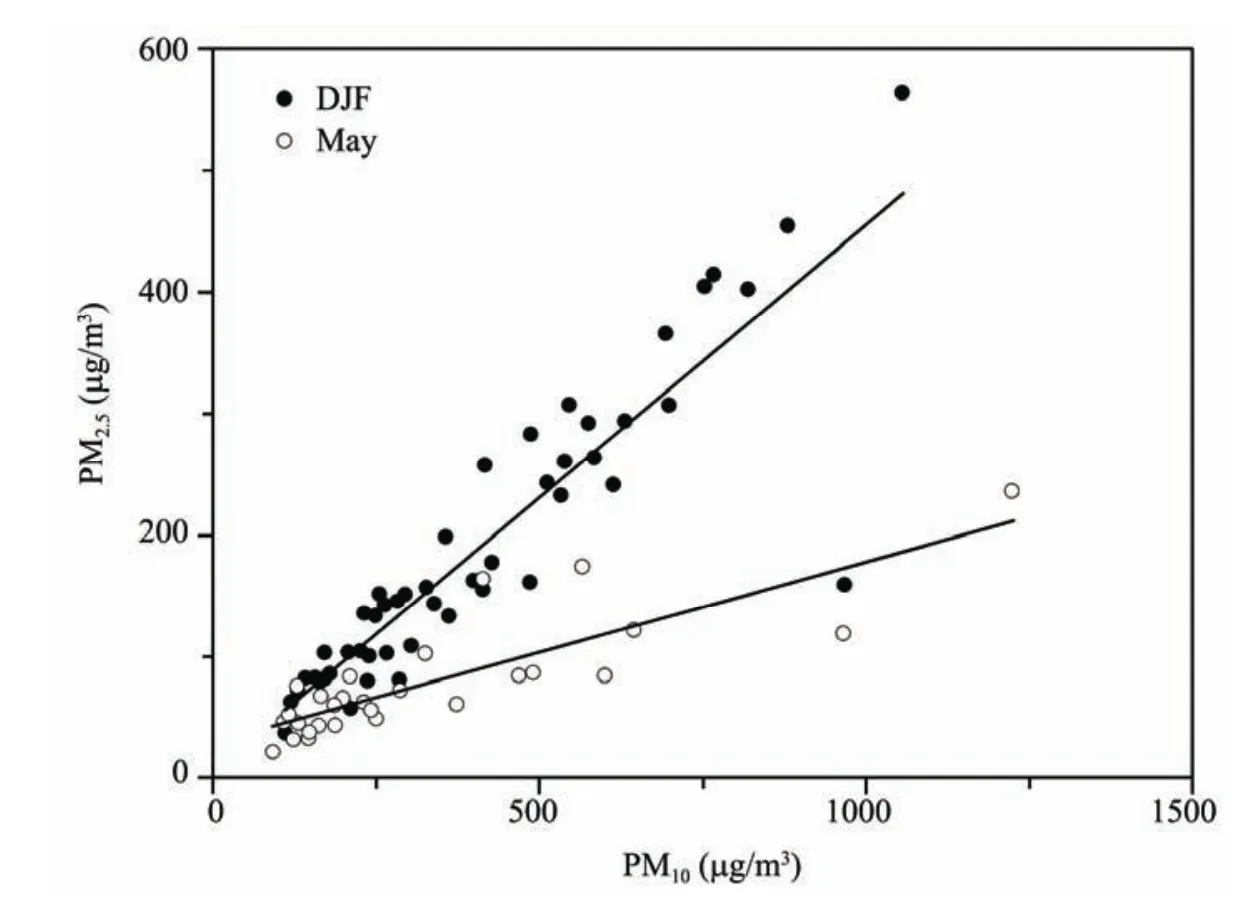
Figure 2 Relationships between PM2.5 and PM10 concentrations during the winter months of December–February (DJF)and the month of May (spring).
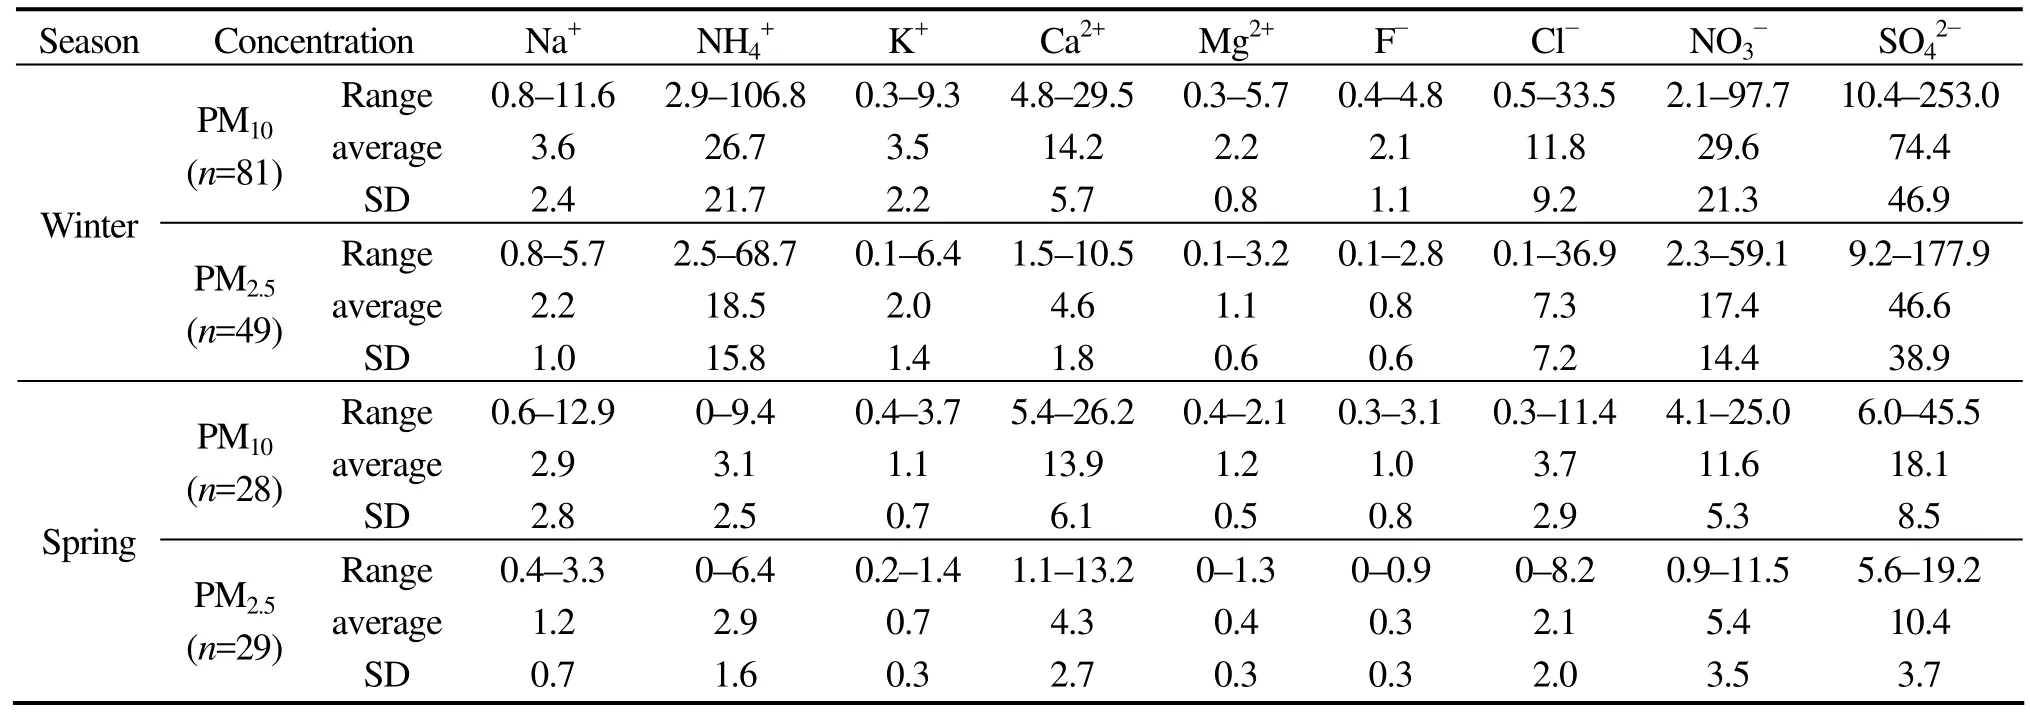
Table 2 Concentrations of ions in winter and spring air for ionic species in the PM10 and PM2.5 fractions (μg/m3). Data are presented on the range of concentration values, the average concentration, and the standard deviation (SD) for each ion species.
3.2. Fractional contributions to PM
The fractional contribution of each ion to total PM can be determined as a scatter plot to evaluate the relationships between ion concentration and total PM concentration(PM2.5or PM10). For instance, a regression analysis of the relationship between the concentrations of Na+and total PM10(Figure 3a) indicates that Na+constitutes about 0.8%of the PM10fraction in winter (slope = 0.008).
Analyses of individual ions indicate that ion species can be separated into two classes in terms of seasonal variation.In the first class, represented by Na+and Ca2+, ion concentrations show similar percentages of the total PM in both winter and spring (i.e., regression slopes in winter and spring are similar;e.g., see Figure 3a). In the second class, represented by(Figure 3b), ion concentrations contribute much less to total PM in spring than in winter. For example,a regression analysis of the relationship betweenand PM10concentrations shows that nitrate constitutes about 8%of the PM10fraction in winter, but only 1% or less in the spring. Other ions assigned to the second class are, K+,F–, Cl–, and. Mg2+shows an intermediate pattern between the two classes.
The low percentage contribution of ions to the total PM fraction in the second class during spring suggests that the PM content is dominated by an unmeasured PM constituent,probably soil dust. Air mass back-trajectories reveal that the atmospheric boundary layer in Lanzhou was influenced by the dust storms, indicating that the regional transport of desert dust from the Gobi and from the Tarim Basin can significantly affect air quality and the chemical composition of aerosols in Lanzhou.
3.3. Particle sizes
The PM2.5:PM10mass ratios have often been used to evaluate the size distributions of ionic species (e.g., Wanget al., 2006; Laaksoet al., 2008); a mass ratio less than 0.5 indicates that coarser particles constitute a larger proportion of total PM content. In this paper, the relative particle sizes of the PM and ions can be represented by the ratios of their concentrations in the PM10versus PM2.5fractions. Higher PM10:PM2.5ratios frequently represent dust storm events,whereas lower ratios (close to 1) usually represent pollution constituents.
Scatter plots of the PM10:PM2.5concentration ratio vs.the PM10concentration indicate two principal relationships involving two groups of ions. The first group, which represents pollution-source ions, shows PM10:PM2.5converging to a stable value;i.e., the samples that reflect the accumulation of contaminants in the valley. The second group,which represents soil ions, shows PM10:PM2.5ratio increasing with PM10, as the samples become more affected by coarse soil dust. The two groups are distinct because some ions are pollution-derived in winter but show strong soil influences in spring, whereas the other ions are always pollution-derived.
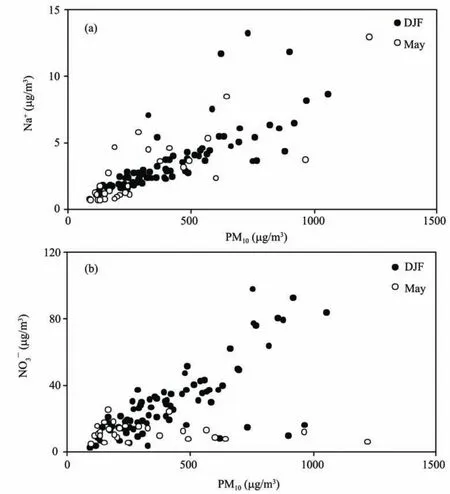
Figure 3 Relationship between the concentration of ions and total PM10 during winter and spring. (a) Na+;the slope of the regression for winter values is 0.008. (b).
The PM10:PM2.5ratios in Figure 4a represent ions that show the pollution-derived pattern for winter and the soil-derived pattern for spring; the winter PM10:PM2.5ratio is approximately constant at a value of 2 (indicating equal concentrations between coarse and fine aerosol components),whereas in the spring the ratio quickly reaches values between 6 and 8 (representing contributions from dust storms).
A scatterplot for Na+concentration ratios (Figure 4b)shows a relationship similar to the PM ratio relationships but with less differentiation between winter and spring values.Elevated Na+ratios in spring show that Na+is a constituent of dust storm PM, most likely because of the high salt content of soils in arid regions (marine influences on urban aerosol particles are expected to be negligible, because Lanzhou is located far inland). A scatter plot of nitrate ()versus(in PM10) (Figure 4c) shows varying relationships. During winter and spring,appears to be pollution-derived, with an asymptotic value of about 1.5 in winter.
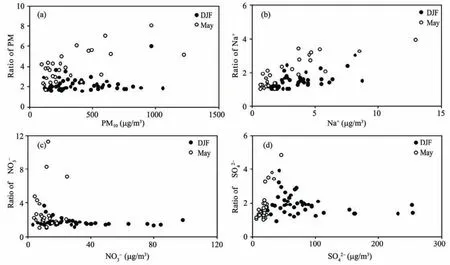
Figure 4 Relationships between X (in PM10) and X (in PM2.5) concentration ratios and X (in PM10) concentrations in winter and spring,where X represents (a) PM, (b) Na+, (c), and (d) .
3.4. Temporal variations
Temporal variations in PM and ion concentrations in Lanzhou can be considered at two scales, seasonal (winter vs. spring) and intraseasonal. Below, the variations are discussed in this order.
Concentrations of all ions (except Ca2+) were higher in winter than in spring, for both particle size fractions, presumably the combination of high-concentration emissions in winter (especially from coal combustion for heating), frequent inversions, and the effects of local terrain. Ions such as chlorine (Cl–) are probably from coal combustion sources(Yaoet al., 2002; Wanget al., 2006). Potassium (K+) has been used as a marker for biomass combustion, with enhanced levels in the winter heating season. High sulfate() levels would be derived from high levels of sulfur dioxide (SO2) emission in winter, in spite of the slow reaction rate of the SO2totransformation at cold temperatures; the liquid-phase reaction and sufficient sources of SO2result in the generation of large volumes of, as reported in Shanghai (Wanget al., 2006) and Beijing (Yanget al., 2002). Chuet al. (2008a) reported that SO2pollution in Lanzhou depends primarily on the source of the emissions;highest concentrations of SO2were observed in winter. High levels of nitrate () may result from nitric acid transforming from the gas phase to the particulate phase at cold temperatures.
Levels of calcium (Ca2+) ion concentrations did not vary significantly from winter to spring, probably because the magnitude of contributions from coal combustion in winter is similar to levels contributed by desert dust in spring. The particles in PM10collected at Lanzhou during non-dust-storm periods are composed of coal fly ash, soot aggregates, and minor mineral components (Xiaoet al.,2010). The seasonal variations of sodium (Na+) and magnesium (Mg2+) levels resemble the variations of Ca2+, but with less influence by springtime dust storms relative to Ca2+.
Pollution levels in Lanzhou also show significant intraseasonal variations. Contrary to the popular impression of persistent heavy pollution throughout the winter, Lanzhou’s PM and ion concentrations exhibit cyclic variations at scales ranging from days to weeks.
Figure 5a shows daily variations of the fraction PM10fraction, revealing that not only baseline concentrations are higher in winter than in spring, but also that concentration maxima (approximately 800–1,000 μg/m3) and minima (approximately 100–200 μg/m3) in the two seasons are similar.Several strong cycles exist during the winter, with frequencies on the order of days to weeks.
Ion concentrations also show similar intraseasonal variations. Figure 5b shows a typical pattern of variability, represented by variations in Na+concentrations. During winter,Na+levels show approximately seven cycles, with durations ranging from 4 to 9 days (average of 6–7 days). Because daily emissions in Lanzhou are approximately constant,these cycles must be considered to reflect local meteorological conditions. Periodicities of about one week probably correspond to weak synoptic weather conditions (Renet al.,2004). For ions species with low background concentration levels, such as ammonium (see Figure 5c), the amplitudes of temporal variations are large (factors of 5–15, versus factors of 2–4 observed for Na+).
3.5. Influence of local meteorological conditions
Local meteorological conditions can significantly affect the concentrations of pollutants in Lanzhou; however, the mechanisms of interaction are complex. For example, high temperatures can favor the evaporation of volatile components from particulates; solar radiation can supply energy to form secondary compounds such as sulfates and nitrates;and a high dewpoint is advantageous to wet deposition and the formation of secondary ions.
In this study, the relation between ion concentrations and meteorological elements was statistically analyzed, revealing that the meteorological elements show a stronger correlation with the logarithm of ion concentrations than with the concentrations themselves. Therefore, the correlation between local surface meteorological parameters (air temperature, surface wind speed, horizontal visibility, and relative humidity) and the logarithm of ion concentrations is statistically analyzed in order to evaluate the effects of the former on the latter (Table 3). The statistical analysis indicates that ion concentrations correlate well with the meteorological parameters, as most of the correlation coefficients are significant at the 0.05 confidence level (2-tailed t-test).
Surface wind speed is negatively correlated to concentrations of PM and the major ions, indicating that particles are readily diffused by gravitational effects related to wind-driven processes. The correlation between relative humidity and the concentration of PM is not relevant, because of the absence of precipitation during the sampling period; however, its significant positive correlation with the concentration of major ions may be important because relative humidity affects the liquid-phase reactions of ionic compounds. Temperature is negatively correlated with the concentrations of PM2.5, as well as with the major ions, reflecting higher emissions of pollutants associated with the requirements of heating during periods with low temperatures. Increased concentrations of PM and ions during periods with colder temperatures reflect weakened convection and the presence of temperature inversions which retard the vertical transport of aerosols. There exists no correlation between temperature and PM10because of the effect of coarse particles carried by dust storms in spring. Horizontal visibility is negatively correlated with PM concentrations and the major inorganic ions.
3.6. Ion balance
The ion balance, expressed at the ratio of the summed equivalent concentrations (meq/m3) of cations to anions(C:A), is usually regarded as an indicator of the completeness of the measured major constituents. The ion balance is as follows:

Strong correlations are found between cation and anion equivalents in both the PM10and PM2.5fractions (r=0.97 andr=0.98, respectively) (Figure 6); the mean ratios of cations to anions, determined as the inverse of the slopes of the linear regressions, are 1.10 and 1.03, respectively. Cation:anion ratios with values close to 1 indicate that the ions measured in our analyses closely represent the total ion components of Lanzhou air samples. The mild anionic deficit (A:C < 1) is probably a consequence of carbonate species bound to Ca2+,which are not detected by IC analyses.

Figure 5 Temporal variations in the concentration of X in Lanzhou during the study periods,where X represents (a) PM10, (b) Na+, and (c)

Table 3 Correlation coefficients between local meteorological parameters and the logarithm of concentrations of PM and principal ions.
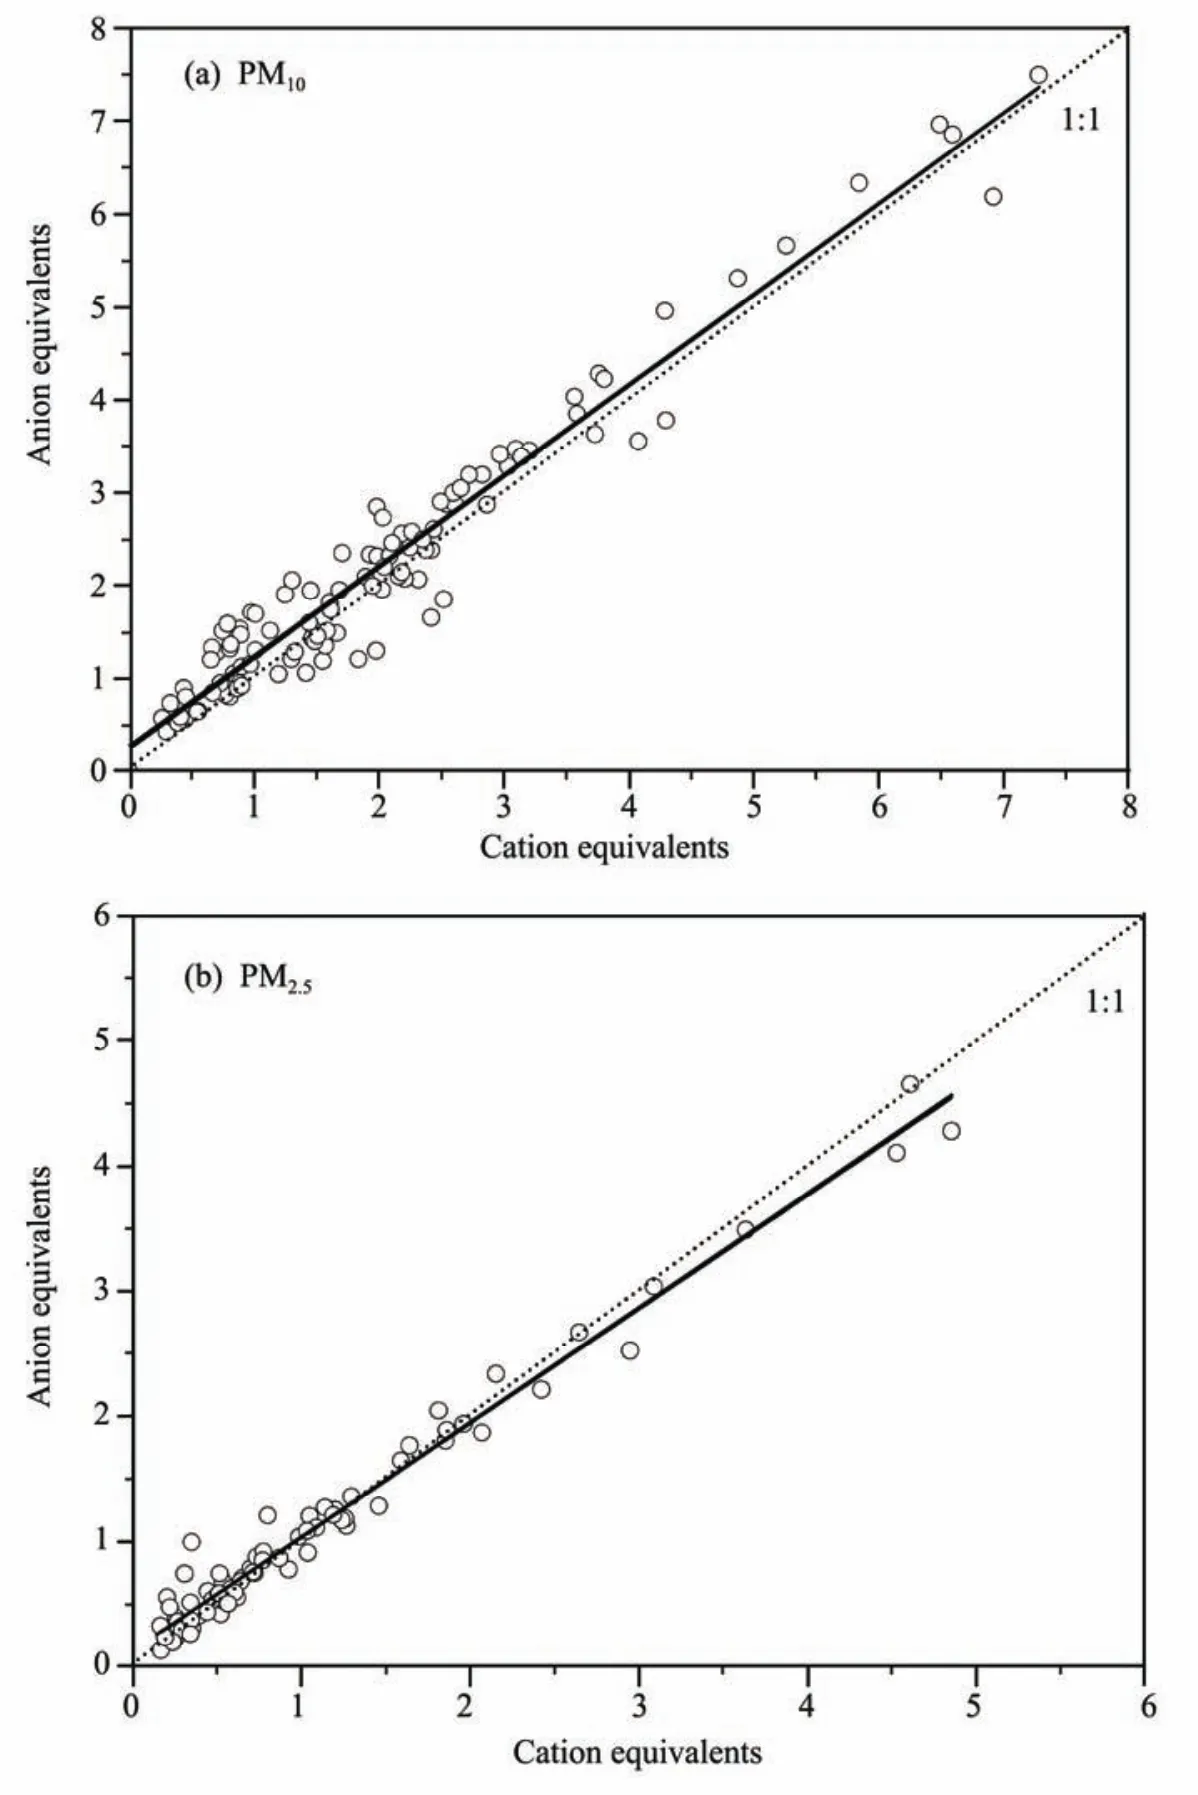
Figure 6 Total cation micro-equivalents versus total anion micro-equivalents in the (a) PM10 and (b) PM2.5 fractions
3.7. Source identification based on the: ratio
The mass ratio of nitrate to sulfate has been used as an indicator of the relative importance of mobile vs. stationary sources of aerosols (Arimotoet al., 1996; Yaoetal., 2002;Xiao and Liu, 2004; Wanget al., 2006). The estimated ratios of NOxto SOxfrom the combustion of gasoline and diesel fuel in China are 13:1 and 8:1 respectively, versus 1:2 from coal combustion (Kato, 1996). In Lanzhou, the nitrate to sulfate ratio in the PM10fraction ranged from 0.12 to 1.34(mean values of 0.40 ± 0.15 in winter and 0.71 ± 0.30 in spring), and in the PM2.5fraction ranged from 0.13 to 1.01(mean values of 0.38 ± 0.14 in winter and 0.50 ± 0.24 in spring); these relatively low values strongly suggest that stationary sources are more important than vehicular emissions in the contribution of PM and ions to the atmosphere.
3.8. Effects of dust storms
Five dust storm events reported in Lanzhou during the sampling periods strongly affect the concentrations of PM.Concentrations of the major ions on dust storm (DS) days and non-dust storm (ND) days are presented in Table 4. In general, dust storm days correspond to increased levels of Na+, Ca2+, Mg2+, Cl–(in spring PM10), and(in spring PM10), and decreased levels of, K+,, and Cl–(in spring PM2.5and in winter items) and(in spring PM2.5and in winter items). Differences between concentration levels in these two groups were greatest for the PM10fraction during the springtime dust storm events, indicating that levels of the first-group ions are elevated in dust, and levels of the second-group ions are elevated in pollution.

Table 4 Concentrations (μg/m3) of ions in PM2.5 and PM10 fractions on dust storm (DS) days and non-dust storm (ND) days
4. Conclusions
The results of this study clearly show that air pollution is still a serious problem in Lanzhou. PM10concentrations far exceed the Chinese Grade III air quality standard during the sampling period and PM2.5pollution levels are much higher than those in 2005–2006. The linear correlation of PM10and PM2.5and its slope indicate main influence factors on air pollution are coal combustion in the winter but dust storms in the spring. Similarly, the PM10:PM2.5ratio shows that different composition of particle sizes in the air between winter and spring is due to the different sources and meteorological conditions. Ions from daily filter samples provide a surprisingly effective method for revealing the compositional and temporal characteristics of aerosols in Lanzhou. The abundance of ion species presents different decreasing orders between winter and spring. Totally, fine particles have a high proportion of ions compared to coarse particles. In detail, the ion species separated into two classes have distinguishable characters of percentage variations from the winter to the spring,eg., Na+and Ca2+concentrations show unchangeable percentages to the total PM in the both seasons but thepercentage shows large variations. The interseasonal variations of aerosol composition demonstrate that no PM or ion concentrations (except Ca2+) are higher in winter than in the spring, andconcentration is sensitive to changes during the seasonal period but Ca2+keeps almost a constant value. The intraseasonal variations break the stereotypical impression of heavy pollution throughout the winter in Lanzhou and that both PM and ion concentrations present cyclic variations at scales of days to weeks. The ratio of cations to anions which is close to 1 is an indicator that the ions are balanced and total components are analyzed in the samples. Smallratio indicates stationary sources are still major air pollution sources in Lanzhou. Air mass back-trajectories show that Lanzhou in spring is vulnerable to dust invasion from arid areas located in northwest of the city. During DSs, most of the ions originate from the crust,and high concentrations of Ca2+are found, combined with low concentrations of ammonium ions.
These positive results are, however, only a beginning.Further research is required to determine, for example, the relative contributions of inorganic and organic constituents,as well as aerosol levels in the summer and fall. The meteorological influences that appear to drive weekly and monthly variations also require documentation. Further studies will provide the proper context for Lanzhou’s air quality compared to the air quality of other Chinese cities.
This work was supported by the National Special Project for Commonweal Industry in China (GYHY201106034), the National Support Project for Science and Technology of China (2007BAC29B03; 2009BAC53B02) and the Project of National Natural Science Foundation of China(41075103). The authors wish to express their gratitude to Dr. Kenneth A. Rahn, University of Rhode Island, for his assistance with this paper.
Arimoto R, Duce RA, Savoie DL, Prospero JM, Talbot R, Cullen JD, Tomza U, Lewis NF, Ray BJ, 1996. Relationships among aerosol constituents from Asia and the North Pacific during PEM-West A. Journal of Geophysical Research, 101: 2011–2023.
Cao J, Shen Z, Chow JC, Qi G, Watson JG, 2009. Seasonal variations and sources of mass and chemical composition for PM10aerosol in Hangzhou,China. Particuology, 7: 161–168.
Chu PC, Chen Y, Lu S, 2008a. Atmospheric effects on winter SO2pollution in Lanzhou, China. Atmospheric Research, 89: 365–373.
Chu PC, Chen Y, Lu S, Li Z, Lu Y, 2008b. Particulate air pollution in Lanzhou China. Environment International, 34: 698–713.
EPA, 2006. United States Code of Federal Regulations, Title 40, Subchapter C, Air Programs. National Primary and Secondary Ambient Air Quality Standards.
Fang GC, Chang CN, Wu YS, Peter PF, Yang DG, Chu CC, 1999. Characterization of chemical species in PM2.5and PM10aerosols in suburban and rural sites of central Taiwan. The Science of the Total Environment,234: 203–212.
Gao JH, Wang W, Du J, Liu HJ, Pang YB, Tang DG, 1996. Preliminary Study on the Aerosol Characteristics of Xiamen in Spring. Research of Environmental Sciences, 9(5): 33–37.
He K, Yang F, Ma Y, Zhang Q, Yao X, Chan CK, Cadle S, Chan T, Mulawa P,2001. The characteristics of PM2.5in Beijing, China. Atmospheric Environment, 35: 4959–4970.
Ho KF, Lee SC, Chan CK, Yu JC, Chow JC, Yao XH, 2003. Characterization of chemical species in PM2.5and PM10aerosols in Hong Kong. Atmospheric Environment, 37: 31–39.
Hu M, He LY, Zhang YH, Wang M, Kim YP, Moon KC, 2002. Seasonal variation of ionic species in fine particles at Qingdao, China. Atmospheric Environment, 36: 5853–5859.
Huang YX, Wang XW, Wang BJ, 2001. The relationship between respiratory system disease and the sandstorm weather in Lanzhou. Gansu Meteorology, 19(3): 41–44.
Intergovernmental Panel on Climate Change (IPCC Fourth Assessment Report), 2007. Climate Change. Cambridge University Press, New York.
Jiang DB, Wang SG, Lang XM, Shang KZ, Yang DB, 2001. The characteristics of stratification of lower-layer atmospheric temperature and their relations with air pollution in Lanzhou proper. Journal of Lanzhou University (Natural Sciences), 37(4): 133–139.
Jim JL, 2002. Characterization of water-soluble ion species in urban ambient particles. Environment International, 28: 55–61.
Kato N, 1996. Analysis of structure of energy consumption and dynamics of emission of atmospheric species related to the global environmental change (SOx, NOx, and CO2) in Asia. Atmospheric Environment, 30:2757–2785.
Laakso L, Laakso H, Aalto PP, Keronen P, Petaja T, Nieminen T, Pohja T,Siivola E, Kulmala M, Kgabi N, Molefe M, Mabaso D, Phalatse D, Pienaar K, Kerminen VM, 2008. Basic characteristics of atmospheric particles, trace gases and meteorology in a relatively clean Southern African Savannah environment. Atmospheric Chemistry and Physics, 8:4823–4839.
Lai SC, Zou SC, Cao JJ, Lee SC, Ho KF, 2007. Characterizing ionic species in PM2.5and PM10in four Pearl River Delta cities, South China. Journal of Environmental Sciences, 19: 939–947.
Luo QQ, Xian XF, Chen GC, Yang QL, 2005. Water soluble components of PM10in Chongqing, China. Chinese Journal of Geochemistry, 24(2):155–157.
Peng RD, Dominici F, Barriuso RP, Zeger SL, Samet JM, 2005. Seasonal analyses of air pollution and mortality in 100 US Cities. American Journal of Epidemiology, 161: 585–594.
Pope CA, Burnett RT, Thun MJ, Calle EE, Krewski D, Ito K, Thurston GD,2002. Lung cancer, cardiopulmonary mortality, and long-term exposure to fine particulate air pollution. JAMA–Journal of American Medical Association, 287: 1132–1141.
Ren ZH, Wan BT, Su FQ, Zhang ZG, Hong ZX, Hu F, Cheng SY, 2004.Several characteristics of atmospheric environmental quality in China at present. Research of Environmental Sciences, 17(1): 1–6.
Shen ZX, Cao JJ, Arimoto R, Han ZW, Zhang RJ, Han YM, Liu SX, Okuda T, Nakao S, Tanaka S, 2009a. Ionic composition of TSP and PM2.5during dust storms and air pollution episodes at Xi’an, China. Atmospheric Environment, 43: 2911–2918.
Shen ZX, Caquineau S, Cao JJ, Zhang XY, Han YM, Gaudichet A, Gomes L, 2009b. Mineralogical characteristics of soil dust from source regions in northern China. Particuology, 7: 507–512.
Ta W, Wang T, Xiao H, Zhu X, Xiao Z, 2004. Gaseous and particulate air pollution in the Lanzhou Valley, China. Science of the Total Environment, 320: 163–176.
Tsai YI, Lin YH, Lee SZ, 2003. Visibility variation with air qualities in the metropolitan area in southern Taiwan. Water, Air and Soil Pollution, 144:19–40.
Wang GH, Wang H, Yu YJ, Gao SX, Feng JF, Gao ST, Wang LS, 2003.Chemical characterization of water-soluble components of PM10and PM2.5atmospheric aerosols in five locations of Nanjing, China. Atmospheric Environment, 37: 2893–2902.
Wang SG, Feng XY, Zeng XQ, Ma YX, Shang KZ, 2009. A study on variations of concentrations of particulate matter with different sizes in Lanzhou, China. Atmospheric Environment, 43: 2823–2828.
Wang SG, Yang M, Qi B, Xin CL, Yang MF, 1999. Influence of Sand-dust Storms occurring over the Gansu Hexi District on the Air Pollution in Lanzhou City. Journal of Desert Research, 19(4): 354–358.
Wang SG, Yuan W, Shang KZ, 2006. The impacts of different kinds of dust events on PM10pollution in northern China. Atmospheric Environment,40: 7975–7982.
Wang Y, Zhuang GS, Sun YL, An ZS, 2005. Water-soluble part of the aerosol in the dust storm season-evidence of the mixing between mineral and pollution aerosols. Atmospheric Environment, 39: 7020–7029.
Wang Y, Zhuang GS, Zhang XY, Huang K, Xu C, Tang A, Chen JM, An ZS, 2006. The ion chemistry, seasonal cycle, and sources of PM2.5and TSP aerosol in Shanghai. Atmospheric Environment, 40: 2935–2952.
Watson JG, 2002. Visibility: science and regulation. Journal of the Air and Waste Management Association, 52(6): 628–713.
Xiao HY, Liu CQ, 2004. Chemical characteristics of water soluble components in TSP over Guiyang, SW China, 2003. Atmospheric Environment,38: 6297–6306.
Xiao Z, Shao L, Zhang N, Li W, 2010. Composition variation of PM10during a dust storm episode in Lanzhou, Northwestern China. Journal of Liaoning Technical University (Natural Science), 29(3): 506–508.
Xuan J, Sokolik IN, 2002. Characterization of sources and emission rates of mineral dust in Northern China. Atmospheric Environment, 36:4863–4876.
Yang F, He K, Ma Y, Zhang Q, Yao X, Chan CK, Cadle S, Chan T, Mulawa P, 2002. Chemical characteristics of PM2.5species in Beijing ambientair.Journal of Tsinghua University (Science and Technology), 13:1605–1608.
Yang M, Ding RQ, Wang SG, Shang KZ, 2005. The characteristics of aerosols over Lanzhou city and their influence on respiratory disease. Arid Meteorology, 23(1): 54–57.
Yao XH, Chan CK, Fang M, Cadle S, Chan T, Mulawa P, He KB, Ye BM,2002. The water-soluble ionic composition of PM2.5in Shanghai and Beijing, China. Atmospheric Environment, 36: 4223–4234.
Yuan CS, Lee CG, Liu SH, Chang JC, Yuan C, Yang HY, 2006. Correlation of atmospheric visibility with chemical composition of Kaohsiung aerosols. Atmospheric Research, 82: 663–679.
Zhang L, Chen C, Murlis J, 2001. Study on winter air pollution control in Lanzhou, China. Water, Air, and Soil Pollution, 127: 351–372.
10.3724/SP.J.1226.2011.00252
*Correspondence to: ShiGong Wang, Prof. of College of Atmospheric Sciences, Lanzhou University, Lanzhou 730000, China.Tel.: +86-931-8915728; Fax: +86-931-8914278; Email: wangsg@lzu.edu.cn
2 January 2011 Accepted: 16 April 2011
 Sciences in Cold and Arid Regions2011年3期
- Sciences in Cold and Arid Regions的其它文章
- Will Glacier No.1 Tianshan exist in the 22nd century?
- Sensitivity of mountain runoff to climate change for Urumqi and Kaidu rivers originating from the Tianshan Mountains
- The research of sea-land breeze (SLB) on the west coast of Bohai Bay based on field observation
- Effects of grazing and climate change on sandy grassland ecosystems in Inner Mongolia
- Hydrological and climatological glaciers observation 20 years on Tanggula Pass of Tibetan Plateau: its significance and contribution
- Concentration of trace elements and their sources in a snow pit from Yuzhu Peak, north-east Qinghai-Tibetan Plateau
