Will Glacier No.1 Tianshan exist in the 22nd century?
WenYing Wang , YongPing Shen
1. Chang’an University, Xi’an, Shaanxi 710054, China
2. Cold and Arid Regions Environmental and Engineering Research Institute, Chinese Academy of Sciences, Lanzhou, Gansu 730000, China
Will Glacier No.1 Tianshan exist in the 22ndcentury?
WenYing Wang1, YongPing Shen2*
1. Chang’an University, Xi’an, Shaanxi 710054, China
2.Cold and Arid Regions Environmental and Engineering Research Institute, Chinese Academy of Sciences, Lanzhou, Gansu 730000, China
Mountains have been described as the water towers of the world. Almost all major rivers have their sources in mountains; glaciers are important water resources that contribute meltwater to river discharge. Glaciers participate in the global water cycle and, with their solid water storage, are an important component of the water balance. As solid reservoirs, glaciers continue to receive the mass nourishment of solid precipitation from the atmosphere, and their meltwater feed and regulate river discharge.Physical changes in glaciers are an indicator of climate change. Over the past half century, the global temperature has increased by 1–2 °C, which emphasizes the urgent task of monitoring glaciers and predicting their trend. As an example, we have investigated, researched, and surveyed Glacier No.1 in the Urumqi River source, Tianshan (abbr. Glacier No.1 Tianshan or Glacier No.1) for half a century. We have found an increase by degrees of the glacial regression during the last 400 years and discovered a terminal moraine which is forming today. The global temperature is rising continually, while the local glacial temperature is 0.4 times that of the global temperature change. Thus, we forecast that Glacier No.1 Tianshan will disappear during the late 21stCentury (2074–2100 A.D.).
glacier; retreat; change; forecast
1. Introduction
Climate change is a key issue the world facing today.The congress of climate change, organized by the United Nations and held in Indonesia, 2007, consisted of representatives and scientists from over 190 countries. The main topic was how the human would confront the threat of global warming. The congress presented information showing how the world’s climate has risen 1–2 °C during the last half of the 20thcentury. The sentiment of the general public was aroused by this information as evidenced by the slogan"Don’t Cook the Climate" (Figure 1).
2. Material and methods
In 1962, our research team from Lanzhou Institute of Glaciology and Geocryology, Chinese Academy of sciences established a surveying control network which included Glaciers No.1–7 in the headwaters of the Urumqi River (Figure 2). We also built an observation system for Glaciers No.1 and No.2 which measured the glaciers’change and ice movements. The systematic measuring error was less than ±0.1 m.
Based on the control network, we drew a glacial topographic map for the source of the Urumqi River. According to the observation system, we measured the movements of Glacier No.1 at 17 control points using an 8-m long rod. We set up the reference system by high-accuracy data and the control points kept intact so far. Since 1962, the first author (WenYing Wang) has visited Glacier No.1 Tianshan on numerous occasions, observing changes in the glacier, and produced topographic maps of the region.
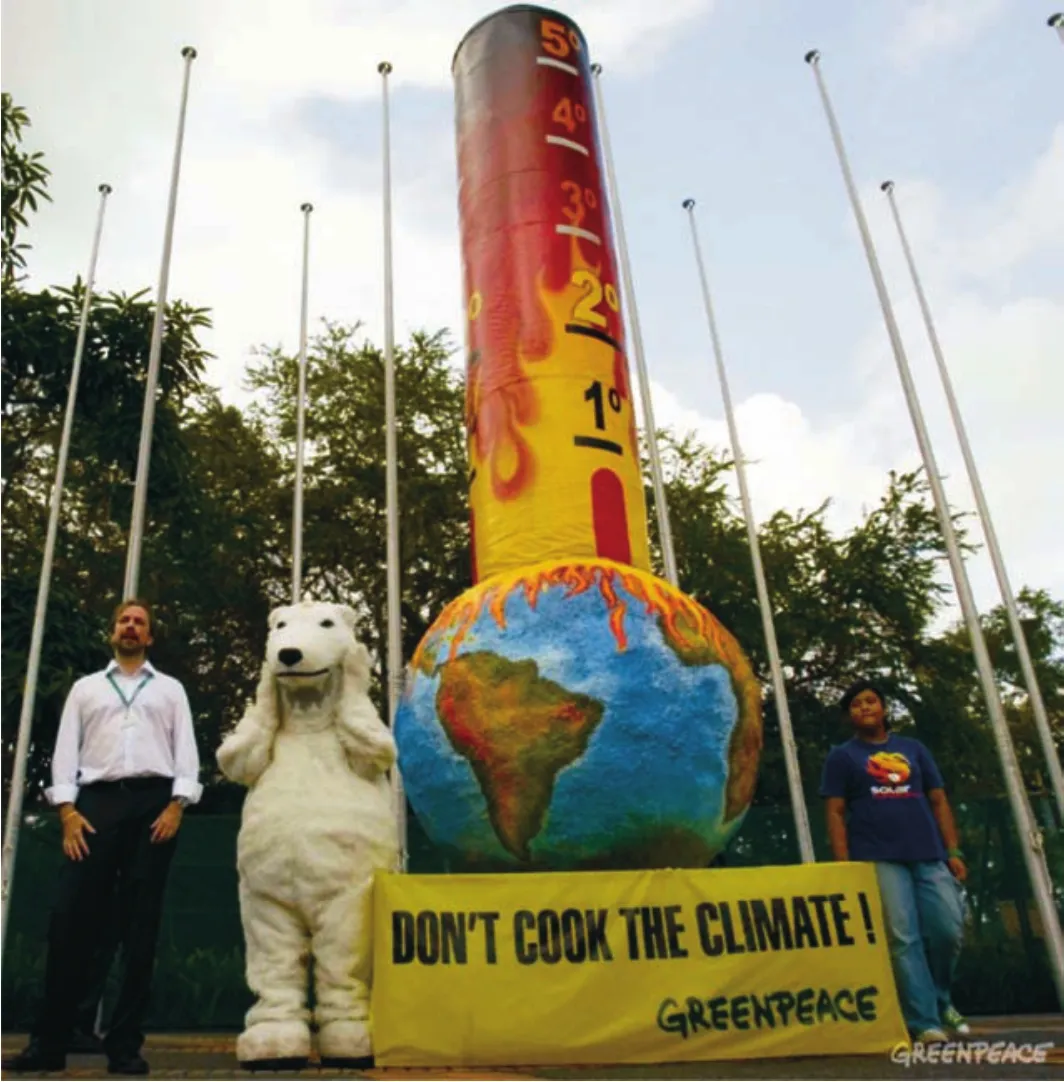
Figure 1 The 6.7-m high thermometer’s message: "Don’t cook the climate!" Greenpeace Tells Crucial UN Climate Talks.A crowd gathers around polar bear on Kut Beach, Bali of Indonesia, December 2, 2007.
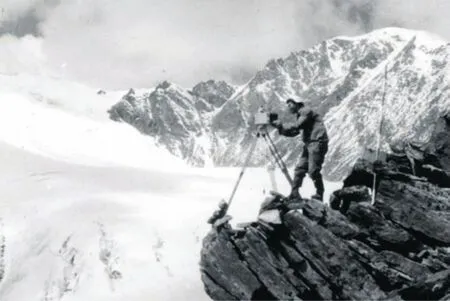
Figure 2 Surveying and mapping of Glacier No.1 at the headwaters of the Urumqi River, in 1962, the surveyor is Prof. WenYing Wang.
3. Historical evolution of Glacier No.1 since Quaternary Glaciation
3.1. The limit of historical evolution
Glacier No.1 is an existing glacier located in the headwaters of the Urumqi river (43°80′50″N, 86°84′90″E), on the north slope of Mt. Tianger II (altitude 4,477 m) in the middle of Tianshan Mountain. The glacier is fed by snow and rain as well as the discharge of melt water. The glacier is flowing, so it is taken as a dynamic object to measure and study. Existing glaciers usually occupy the geographic space where ancient glaciers of the Last Glaciation Maximum(LGM) existed. Thus, in order to investigate the historical evolution of ancient glaciers, it is necessary to study existing glaciers (Shi, 1965, 2001, 2002).
In 2005, WenYing Wang, with the help of ZhiJiu Cui and colleagues from Peking University, performed an identification survey of glaciers in the source area of the Urumqi River. Red May Bridge, located along the highway from Urumqi City to Baluntai Town, was selected as the starting point to mark off glacial historical epochs, then toward the Urumqi river source via the Wangfeng Squad,the Glacial Station, and the Little Ice Age moraines in front of Glacier No.1. The sector from Red May Bridge to the moraines is about 20 km, and is an ancient glacial area that at present lacks ice. Through measuring the moraine samples, we delimited the ice ages successively by referring to relating information. The glacial epoch in the Red May Bridge remains unclear, some glaciologists suggest that the age is earlier Quaternary; that of the Wangfeng Squad about 18,000–20,000 yrs B.P. (note: 18,000–20,000 yrs B.P.means that the adopted starting point for14C dating is 1950); and that of the Glacial Station (parallel to the Daxigou Meteorological Observatory) about 4,000 yrs B.P.,named Neoglaciation. The Little Ice Age, from the middle of the 17thcentury to 1961 (about 360 years) is delimited by three moraine lines in front of Glacier No.1. In 1962,we established a high-accuracy observatory reference frame on Glacier No.1 and since then observed relevant elements.
3.2. Glacial delimitation
Glacier ice flow is advancement or retreat in valleys which can be fast or slow. The extent of later moraines can exceed earlier moraines, creating a problem in glacial delimitation. In this paper, we discuss the glacial epochs for the source area of the Urumqi River, but not the inter-epoch waving process. The main emphasis is on research of Glacier No.1 which will help people understanding the glacial landscape of this area, and also help protecting the glacier and its environment.
3.2.1 The Red May Bridge Stage
The Red May Bridge is located in the upper reaches of Urumqi River and about 98 km away from Urumqi city and 20 km to the terminal of Glacier No.1, about 2,538 meters above sea level. The second terrace east of the bridge is situated on the northern bed rock where the graben of the highway goes through. A moraine of 5-m high lies there. This is a reliable marker of where the ancient glacier passed by(Figure 3).
The valley section of the Red May Bridge is precipitous. It is a mountain pass with a relative height about 1,000 m. During the Ice Age, the glacial ice flow from the head of Urumqi River mixed with moraines and converged at the Red May Bridge, and the valley was covered by glaciers (Figure 4).
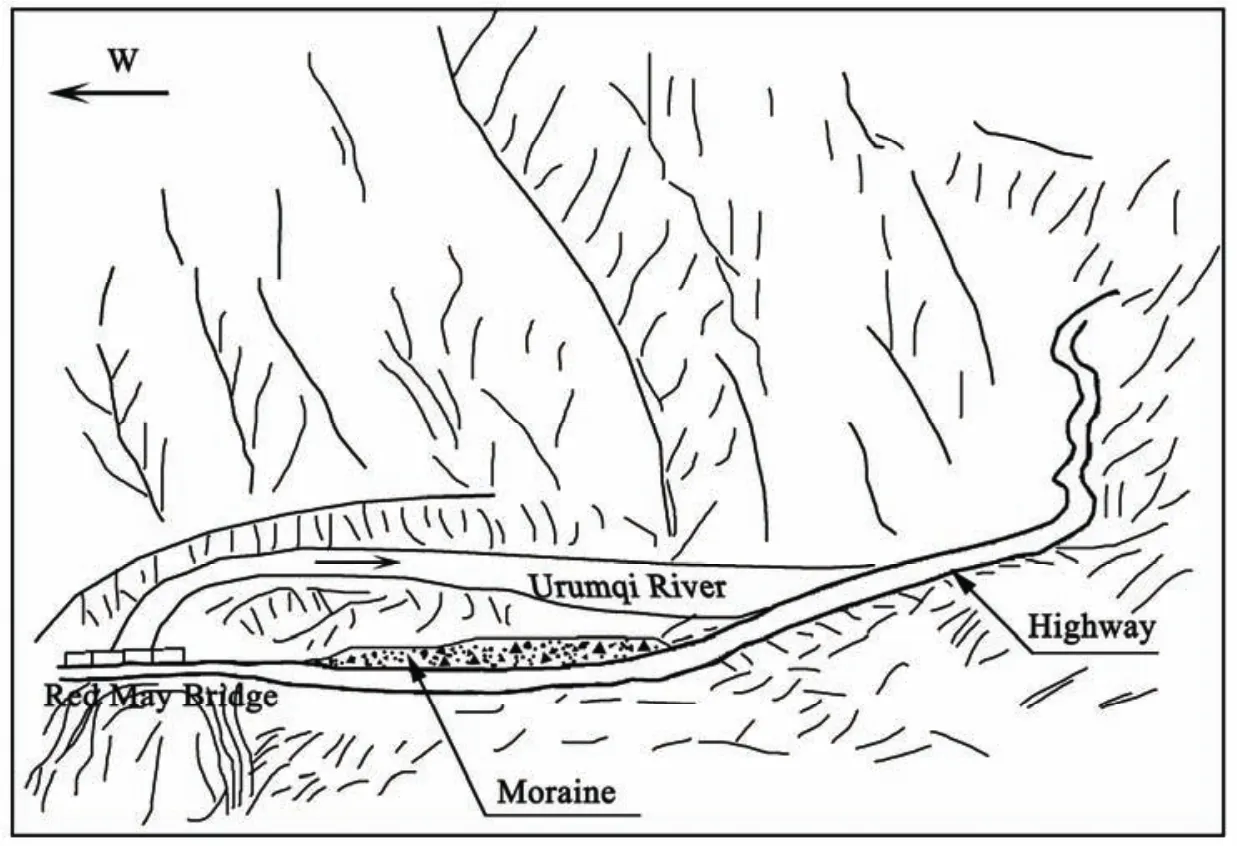
Figure 3 A sketch of Urumqi River Valley near the Red May Bridge
3.2.2 The Upper Wangfeng Stage
There are numerous moraines near the Wangfeng Squad which is from the Red May Bridge along the Urumqi–Baluntai highway up to about 107 km, with an altitude of about 3,000 m a.s.l. Here, there are excellent cross-sections of the moraine layers due to the Urumqi River eroded embankments and excavation of the Urumqi–Baluntai highway construction, revealing a credible history of glaciation. Glaciers undergo numerous undulations over a long period of time, leaving different shapes moraine in different areas.Based on the characteristics of moraine, glaciologists place the Upper Wangfeng Stage in the Last Glaciation Maximum(LGM). The moraines are relatively new and are distributed over a vast region, with large boulders lying on chains of undulating hills, from which people can easily identify the ancient glacial landform. The ice cover of this stage is shown in Figure 5. The14C dating results of the Upper Wangfeng Stage is 18,000-20,000 yrs B.P., and we use the average of 19,000 yrs B.P. as the reference system for the Upper Wangfeng Stage.
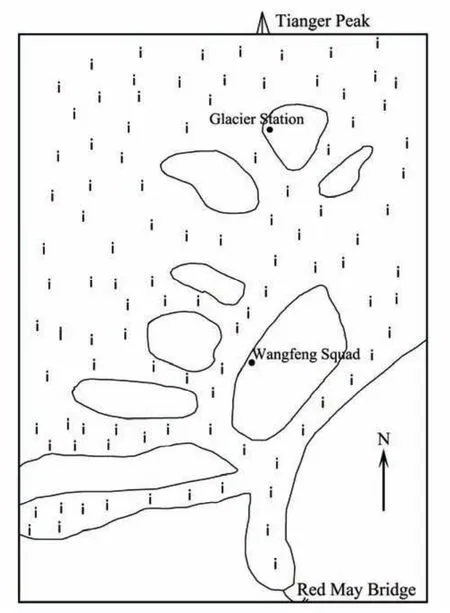
Figure 4 Inferred ice cover of the river source during the Red May Bridge Stage (2,538 m a.s.l.)
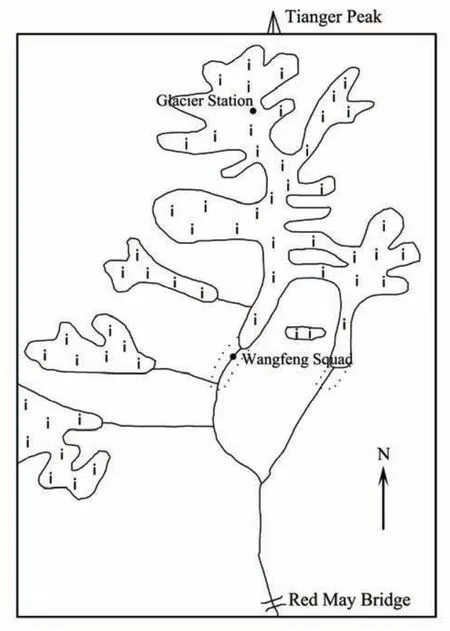
Figure 5 Inferred ice cover of the river source during the Upper Wangfeng Stage
3.2.3 Neoglaciation in the Glacial Station—Daxigou Meteorological Observatory
The glacial station is situated at 116 km south of Urumqi City, at 3,550 m a.s.l., adjacent the Daxigou Meteorological Station. The Shanbei Squad lies to the south about 150 meters along the highway. Forty seven years ago, the glacial station region was very desolate, where every winter (September to next April) glacial melt water froze, with only were 3–5 workers at the station (Figure 6). However, animals such as wolves, bears, fox, and marmots could easily be seen, what is more, we raises a wild wolf indoor in the station. Up to the early 21stcentury, the section from the station to the squad looks like a flourishing city street, with numerous tourists, water companies, animal husbandry(cow-sheep), and people gathering medicinal plants such as snow lotus (Saussurea involucrata), red-spotted stonecrop(Sedum erythrostictum) and so on. The glacial landscape was destroyed to some extent (Figure 7), but numerous ancient glacial marks can be clearly seen in a 2 km wide section from Wangfeng Squad to the glacial station. The glacial station and the squad’s houses are established on the moraine of Neoglaciation (Figure 8), and Figure 9 is the inferred ice cover of Neoglaciation. This glaciation corresponds approximately to the Zhou-Qin Dynasty Cold Epoch depicted by Kezhen Zhu (Figure 10).
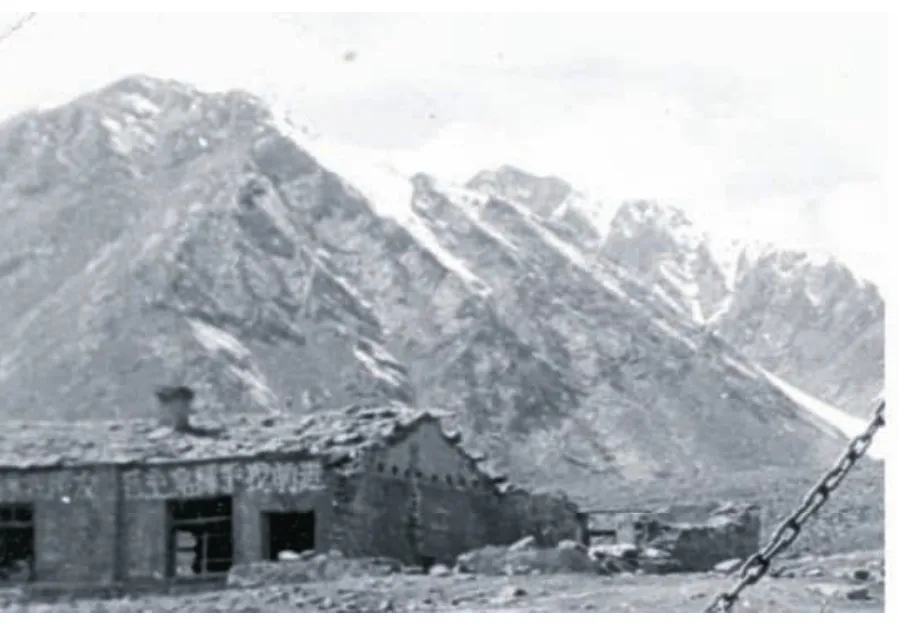
Figure 6 Glacial Station, Tianshan (by WenYing Wang, 1962)
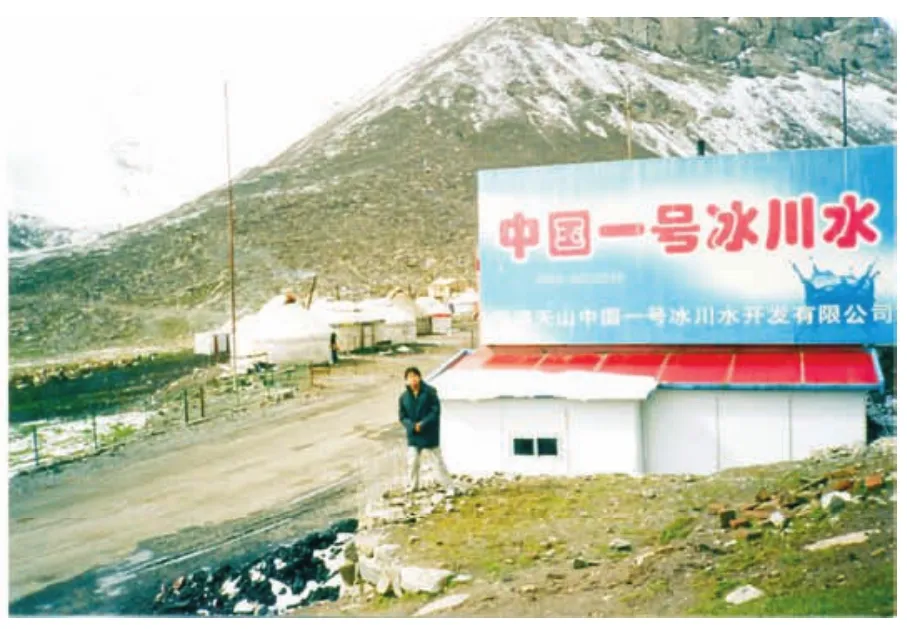
Figure 7 Glacial Station, Tianshan (by WenYing Wang, 2005)
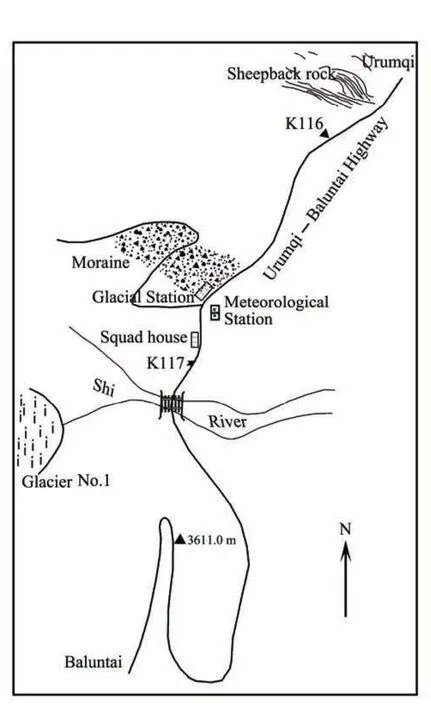
Figure 8 Present remains of Neoglaciation at the Glacial Station
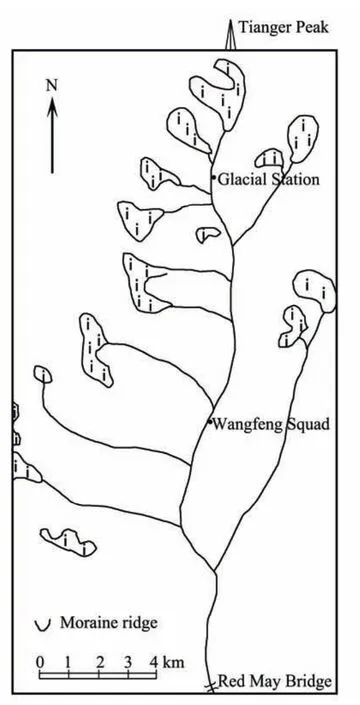
Figure 9 Inferred ice cover of river source for Neoglaciation Stage
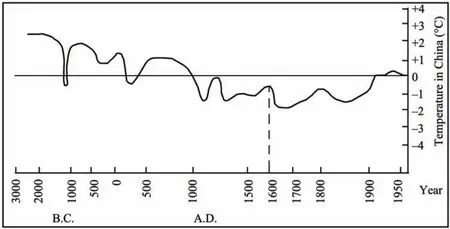
Figure 10 Historical temperature trend for China during the last 5,000 years (by KeZhen Zhu, 1972)
3.2.4 The Little Ice Age
From Glacier Station west to Glacier No.1, about 1,650 meters distance, one encounters three moraines (Figure 11: I, II, III). Figure 11 is the sketch of Glacier No.1 terminus change since the Little Ice Age, with three moraines formed in consecutive order Their heights are 80 m, 50 m and 30 m respectively. The moraines are made up of angled boulders, stone blocks, and gravels and clay that are slightly weathered. The formation period should be from the 17thcentury to the middle of the 20thcentury. During the about 360 years, the glacier had retreated 480 m, with a retreating rate (R) of 1.33 m/yr. According to Figure 9 we can estimate the rise of temperature in China is about 1 °C during A.D.1600–1960.
In the measurement of Glacier No.1, a new moraine was found, forming between moraine III and the glacial terminus.The shape of the new moraine resembles a tadpole, which is oval at the northern end then narrowly reduces towards the opposite end, stands about 10 m high, and is what remains after Glacier No.1 retreated since the middle of the 20thcentury. In the glacial map for the source region of Urumqi River, the tadpole-shaped moraine followed closely the end of Glacier No.1, and now is 200 m from the glacial terminus(Figure 11).
Figure 12 shows that moraines caused by the retreating of Glacier No.1 after the Little Ice Age, have something to do with the existing glacial tongue.
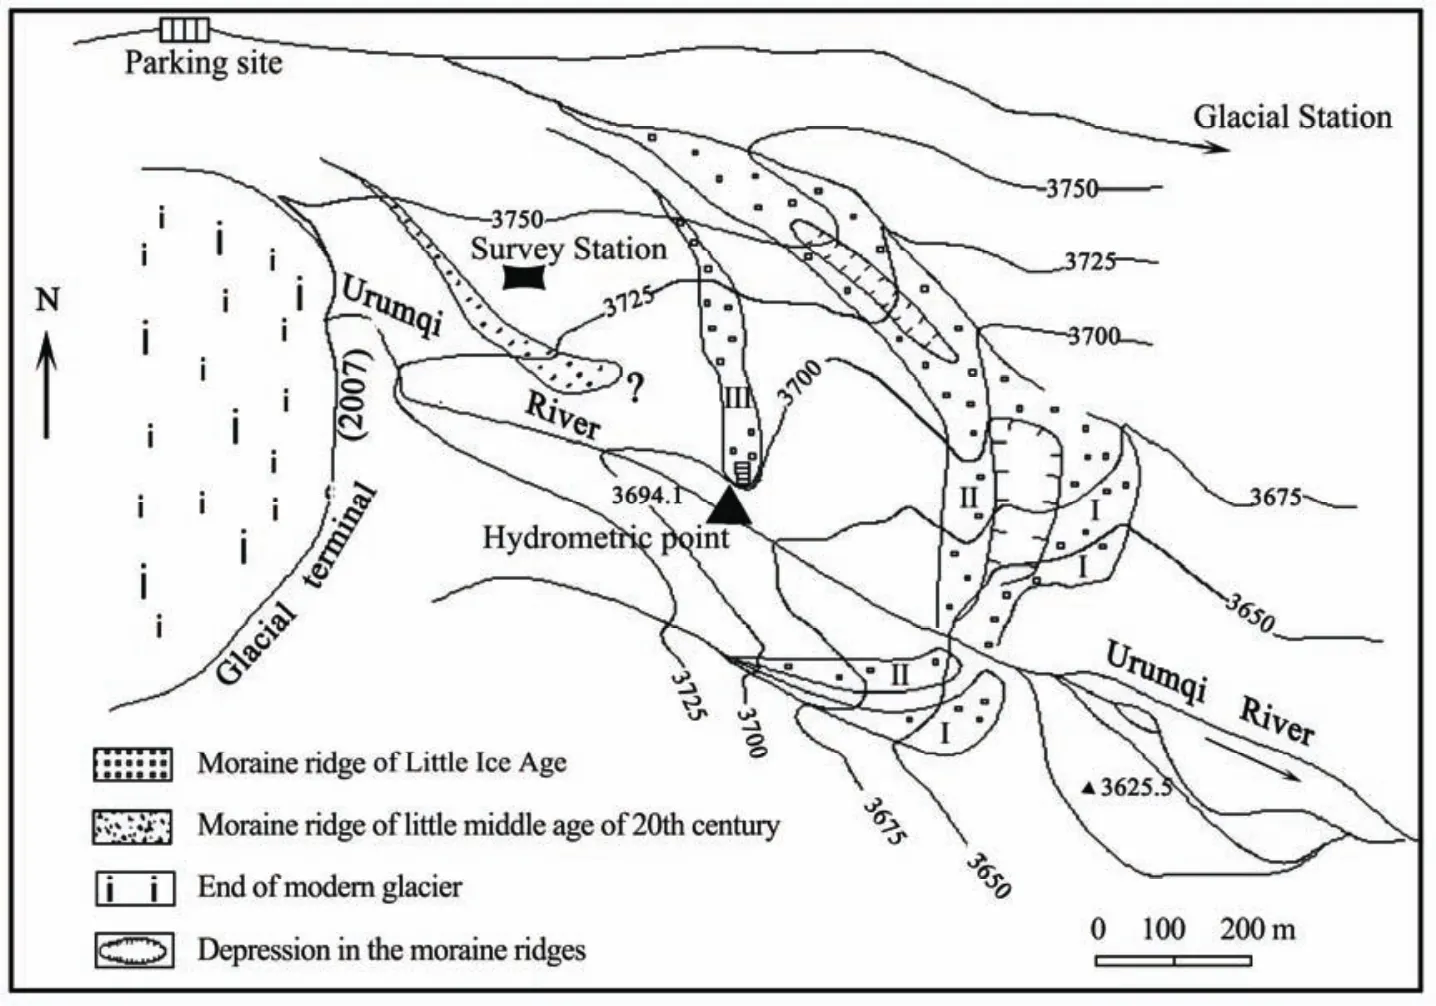
Figure 11 The retreat of Glacier No.1 terminus since the Little Ice Age
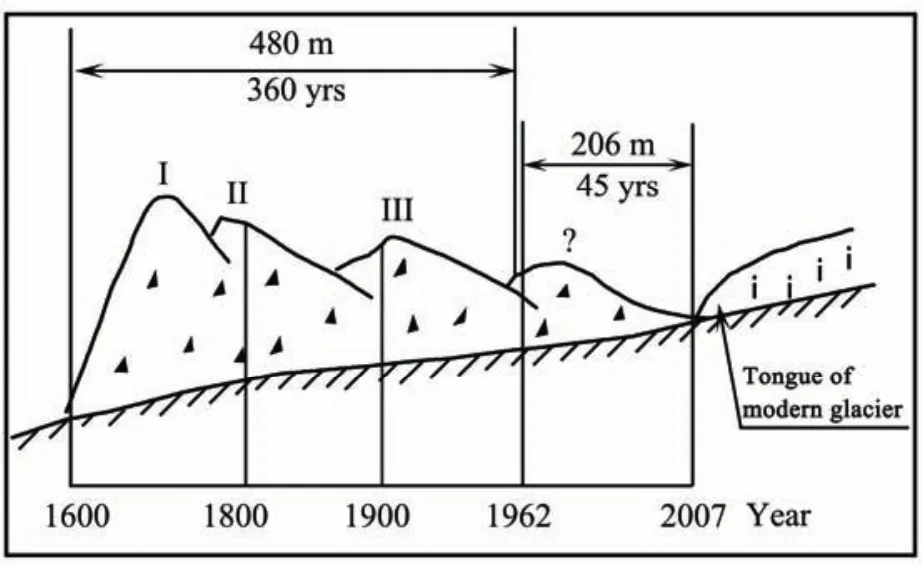
Figure 12 Longitudinal view showing the moraines in relation to the tongue of Glacier No.1, 2007
3.2.5 The change of existing glacier after post Little Ice Age
The tadpole-shaped moraine shown in Figure 11 and Figure 12 was formed during advancement or retreating of Glacier No.1 during the middle of the 20thcentury. The moraines are very clear, and look like they have just been washed. An embryonic moraine ridge is forming, with a height of 15 m. Since 1962, research of Glacier No.1 entered a new era with a digital reference system and advanced testing techniques. We have monitored elements of the glacier by using fixed points, and have recorded numerous changes. Some of the elements are surface features,such as glacial advancement and retreating; accumulation and ablation of ice-snow; and rising or lowering of the snow line. Others are subsurface and solar elements, such as glacial thickness and radiation, which were monitored by Optical Theodolite. Using data that have been collected over the past half a century, we can conduct an analysis and give some interpretations.
Statistical changes in morphology of Glacier No.1 are listed in Table 1 and shown in Figure 13. We can see that the terminus of Glacier No.1 has retreated at a speed of about 6 m/yr in 1962–1973, and about 3.28 m/yr during 1973–1983. After 1983 the retreating rate accelerated again,resulting in Glacier No.1 was divided into two parts in 1993. The length of the east and the west branches were 1,820 m and 1,250 m respectively in 1993. Since 1993,Glacier No.1 is still quickly retreating. From 1962 to 2007,the retreating distance was 206 m, with a retreating rate (R)of 4.58 m/yr.
The glacial moving velocity is not the same in different parts, such the velocity on the main-flow-line is faster than on other parts of glacier, the velocity on the surface is faster than at the bottom, and the velocity in summer is faster than in winter. Based on measurements at points on the main-flow-line, we calculated the average flow speed which is listed in Table 2. Table 2 shows that the flow speed of Glacier No.1 within a 10 year interval has been progressively decreasing over a span of 38 years.
The change in area of Glacier No.1 provided by many professional surveyors (Wanget al., 1962; Wang, 1973;Wanget al., 1976; You, 1986; Sun, 1991; Jing, 2001) is shown in Table 3. The glacier area has been decreasing from 1962 to present, at about -12% over a span of 38 yrs.

Table 1 Terminus retreating record for Glacier No.1
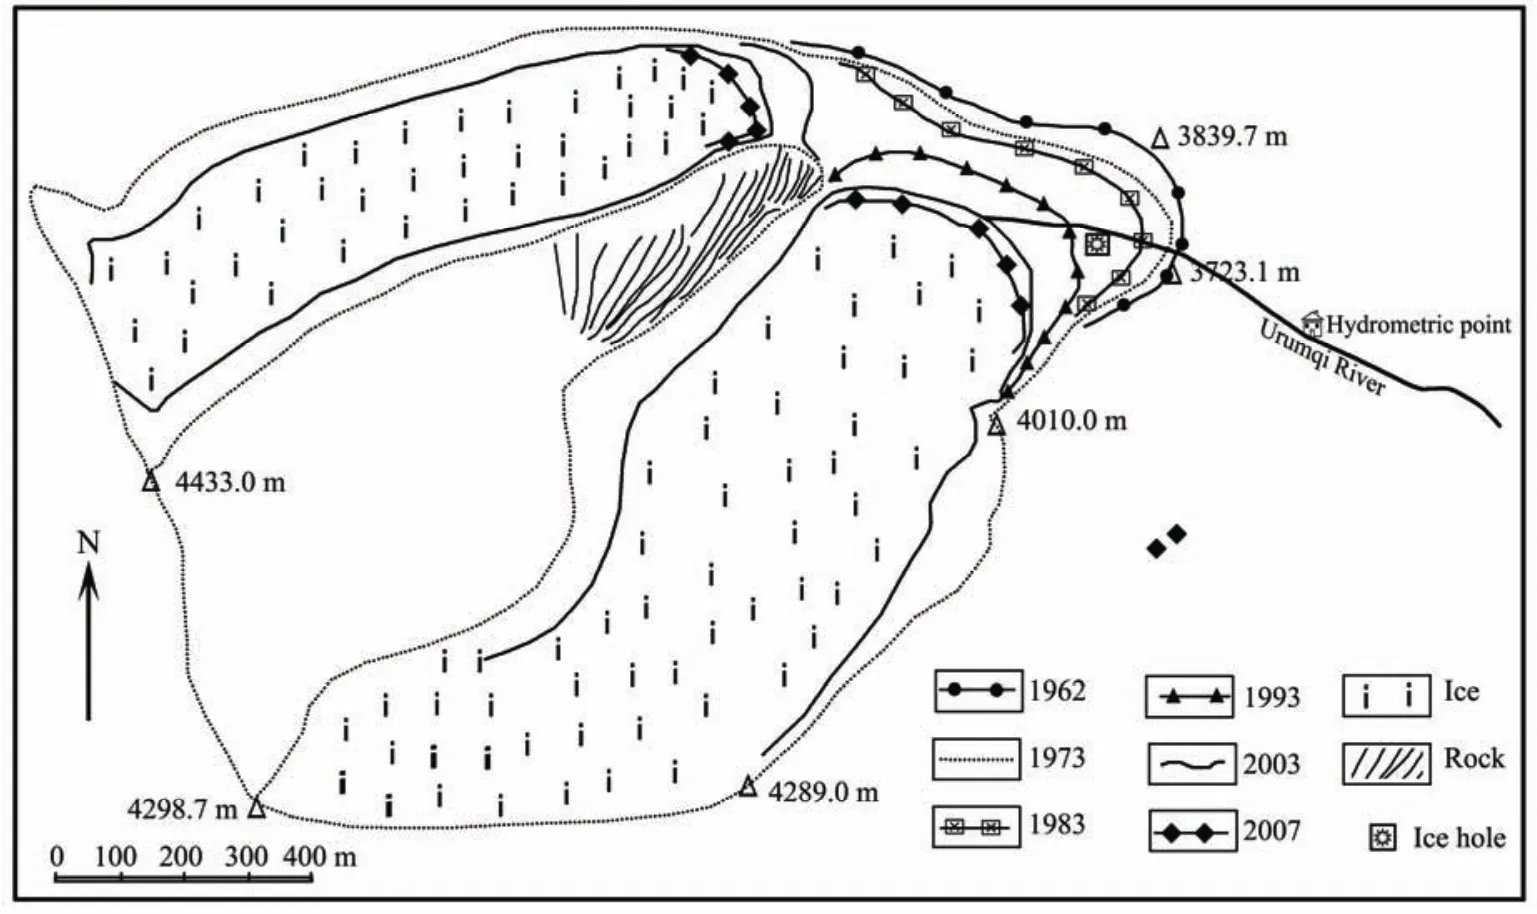
Figure 13 Sketch of changing Glacier No.1 during 1962–2007

Table 2 Average flow speed of Glacier No.1

Table 3 Variation in area of Glacier No.1, Tianshan
4. The forecast of change for Glacier No.1 in the 21st century
In 1963, a symposium of glaciology was held in Lanzhou, China, in which a glacial hydrologist, based on limited information of glacial hydrology, forecast the disappearance of Glacier No.1 within the 20thcentury. With the passing of the 20thcentury, Glacier No.1 has lost about 12%. At present,glaciologists have long-term on-the-spot data of multi-elements for Glacier No.1, and a successful forecast relies on the accuracy of data and the adaptability of the prediction method.
In fact, in 1974, there was a successful example of glacial change forecast. Prior to the construction of the international Karakorum Highway (KKH) between China and Pakistan, the Chinese government sent a scientific expedition, led by Prof Shi Yafeng (Presently Academician of Chinese Academy of Sciences), to investigate and project the change trend of the Batura Glacier. The accurate forecast given by the expedition team, provided a scientific basis for route selection of the highway and bridges. Over 20 years when in 1994, Scientific Expedition of China to Batura Glaciers went to Pakistan and reviewed the forecast of Batura Glacier, the results showed that the original prediction is correct and credible (Wang, 1995). The bridges was named "Chinese Bridge" by the local people and free from obstruction.
4.1. Decreasing velocity method
For mountain glaciers like Glacier No.1, glacial flow is very important, without it, the glacier would disappear.
Namely:

whereVis the ice of transported;Ais the ice of ablation in the end;Cis the change in glacial terminus. IfVis decreasing andAis increasing, then the final outcome isC≤ 0,and the glacier will disappear.
(1) Graphical method. The years of disappearance of Glacier No.1 are showed in Table 4,ris the ratio of the velocity decrease,i.e.,r= 11.95-4.70/11.95 = 0.6067, thus the forecasting glacial flow speed in 2038 A.D.,V2038will be 4.70(m/yr) × (1-0.6067) = 1.85 m/yr, in the same way,V2076will be 0.73 m/yr (about 2 mm/d), being within the measurement error, thus Glacier No.1 will disappear in 2076 A.D.

Table 4 Disappearance time for Glacier No.1
(2) Digital solving. According to the regular change pattern and data observed for Glacier No.1, we regard the yearly velocity series as a geometric sequence with progressive decrease year by year, and its first term is the measured value in 1962 (Table 5). That is,V1= 11.95 m/yr; the decrease ratio,r= (11.95-4.70)/11.95 = 0.6067, or the existing ratio,q= 1-r= 0.3933. Supposingtis a figure indicating the glacier stopped (from 1962), its digital stair is 38 years(1962–2000), then

Theoretically, whenV≤ 0.8 m/yr the glacier will stop,sot= 38(n-1) = 10.1041 years, thus Glacier No.1 will disappear in the year : 1962 + 110 = 2072 A.D.
The average of the above two methods is 2074 A.D.

Table 5 The observed velocity of Glacier No.1 for multiple years
4.2. The method of relationship between glacial retreat and temperature
The advancement and retreat even the development and extinction of glaciers are impacted by climatic change.Physical changes in glaciers are an indicator of climate change, such as glacier changes can be projected by air temperature. The temperature changing series what we use for predicting glacier changes is the local temperature changing series in the region of Glacier No.1. There is a conversion coefficient of 0.4 between local and large-scale temperature change range. If the large-scale temperature rises 1 °C, the local change will be 0.4 °C. For example,the temperature in the world has risen about 1.5 °C over the last half a century, however, the weather records of Daxigou Meteorological Observatory rose about 0.6 °C(Jiaoet al., 2004). Glacier change for Glacier No.1 which is presented in Table 6.

Table 6 Change in Glacier No.1, Tianshan with rising temperatures since the Red May Bridge Stage
We pick out some data from Table 6 to meet the conditions of the method mentioned above, and are listed in Table 7.
On the basis of observed data, we suggest ΔTis a variable of rising temperature andRis a corresponding function,R=R(ΔT). ΔT0= 0.4/360, ΔT2= 0.6/45 as section points, thenR(0.4/360) = 1.33,R(0.6/45) = 4.58, we wantR(0.8/43).
Based on Lagrangian method (Kawet al., 2003), a multinomial was built, which is:

Then

If the local temperature will rise +0.8 °C in the next 43 years (2007–2050), that is ΔT= 0.8/43. So,R(ΔT) ≈L2(ΔT)=L2(0.8/43). Combined with Equation(4), we obtainL2(0.8/43) = 16.55 m/yr. Thus, the forecast retreating rate isR=16.55 m/yr (= ? in Table 7).
According to this retreating rate, the time (t) of disappearance for Glacier No.1, Tianshan is as follows:tav=(tE+tW)/2 = (1820/16.55+1250/16.56)/2 = 92.75 years. By this method, Glacier No.1 will disappear before 2100 A.D.

Table 7 Relation between rising temperature and glacial retreat rate
5. Conclusion
"Will the Glacier No.1, Tianshan exist in the 22ndCentury?"
Both the method of glacial velocity in progressive decreases and the method of relationship between glacial retreat and temperature predict that Glacier No.1 will disappear before 2100 A.D.
The authors would like to express their gratitude to the leaders of Glacial Station, Tianshan, Professors ZhongQin Li and KeQin Jiao who helped in collecting new data over the past 20 years; to Dr. ZheFan Jing who helped in mapping Glacier No.1 over the last decade; to Prof. ZhiQiang Yang and his post-graduate students DaBing Huang, XinZhi Wang,and Wei Chen for editing comments, downloading material,drawing sketches and computing data. This study was supported by The State Key Science Research Programme for Global Change Research of China (Grant No.2010CB951402), State Key Laboratory of Cryospheric Sciences Fund (SKLCS 2010-04), the State Key Basic Research Development Program of China (973 Program)(Grant No.2007 CB411507) and the National Natural Science Foundation of China (Grant No. 40771047).
Jiao KQ, Jing ZF, Han TD, Yang HA, Ye BS, Li ZQ, 2004. Variation of the Glacier No.1 at the headwaters of the Urumqi River in the Tianshan Mountains during the past 42 years and its trend prediction. Journal of Glaciology and Geocryology, 26(3): 253–260.
Jing ZF, 2001. Map of Glacier No.1 and No.2. Printed by the Lanzhou Institute of Glaciology and Geocryology, Chinese Academy of Sciences.
Kaw AK, Collier N, Keteltas M, Paul J, Besterfield GH, 2003. Holistic but customized resources for a course in numerical methods. Computer Applications for Engineering Education, 11(4): 203–210.
Shi YF, 1965. Morphologic characters and historical evolutions of the glaciers in the source of Urumqi River. Science Press, Beijing.
Shi YF, 2001. Prediction on glacial recession caused weather warm that it has influence on water resources. Journal of Glaciology and Geocryology,23(1): 333–341.
Shi YF, 2002. A suggestion to improve the chronology of Quaternary Glaciations in China. Journal of Glaciology and Geocryology, 24(6): 687–692.
Sun ZZ, 1991. Geomorphologic Map of the Cirque in the Source of Urumqi River. Chengdu Geography Press, China.
Wang WY, 1973. The Map of Glaciers in the Source of Urumqi River, Tianshan. Printed by the Lanzhou Institute of Glaciology and Cryopedology,Chinese Academy of Sciences.
Wang WY, 1995. Rechecking the forecast of changes of Batura Glacier.Journal Glaciology and Geocryology, 17(1): 93–96.
Wang WY, Liu JH, Luo XR, 1976. The retreats in the Glacier No.1 at the headwaters of Urumqi River, Tianshan, at the 1962–1973 year and contrast survey of the movement. Memoirs of Lanzhou Institute of Glaciology, Geocryology and Desert, No.1. Science Press, Beijing.
Wang WY, Mi DS, Chen JM, Sun ZZ, 1962. The Map of Glaciers in the Source of Urumqi River. Printed by the Lanzhou Institute of Glaciology and Cryopedology, Chinese Academy of Sciences.
You GX, 1986. Map of Glacier No.1 and No.2. Printed by the Lanzhou Institute of Glaciology and Geocryology, Chinese Academy of Sciences.
Zhu KZ, 1972. Climate in China during the last 5,000 years. Acta Archaeologica Sinica, (1): 168–189.
10.3724/SP.J.1226.2011.00206
*Correspondence to: YongPing Shen, Cold and Arid Regions Environmental and Engineering Research Institute, Chinese Academy of Sciences, No.320 West Donggang Road, Lanzhou 730000, China. Tel: +86-931-4967246; Email: shenyp@lzb.ac.cn
20 May 2009 Accepted: 15 December 2010
 Sciences in Cold and Arid Regions2011年3期
- Sciences in Cold and Arid Regions的其它文章
- Sensitivity of mountain runoff to climate change for Urumqi and Kaidu rivers originating from the Tianshan Mountains
- The research of sea-land breeze (SLB) on the west coast of Bohai Bay based on field observation
- Effects of grazing and climate change on sandy grassland ecosystems in Inner Mongolia
- Temporal variations in aerosol composition at Lanzhou City, Northwestern China
- Hydrological and climatological glaciers observation 20 years on Tanggula Pass of Tibetan Plateau: its significance and contribution
- Concentration of trace elements and their sources in a snow pit from Yuzhu Peak, north-east Qinghai-Tibetan Plateau
