
Targeting mitochondrial transcription factor A sensitizes pancreatic cancer cell to gemcitabine
2023-10-30 10:36:20WeiWngChunFnJingHiSenYinShnGoBoPingYu
Wei Wng ,Chun-Fn Jing ,Hi-Sen Yin ,Shn Go ,Bo-Ping Yu ,?
a Department of Gastroenterology, Renmin Hospital of Wuhan University, Wuhan 430060, China
b Department of Gastroenterology, Xiangyang Central Hospital, Affiliated Hospital of Hubei University of Arts and Science, Xiangyang 441021, China
c Department of Pathology, Xiangyang Central Hospital, Affiliated Hospital of Hubei University of Arts and Science, Xiangyang 441021, China
Keywords: TFAM Mitochondrial respiration and biogenesis Pancreatic cancer Gemcitabine
ABSTRACT Background: The survival of pancreatic cancer cells,particularly cancer stem cells which are responsible for tumor relapse,depends on mitochondrial function. Mitochondrial transcription factor A (TFAM) is critical for the regulation of mitochondrial DNA and thus mitochondrial function. However,the possible involvement of TFAM in pancreatic cancer is unknown.Methods: Human samples were obtained from pancreatic cancers and their adjacent tissues; human pancreatic cell lines were cultured in RPMI1640 medium. TFAM expressions in pancreatic tissues and cultured cells were determined using immunohistochemistry,ELISA,and reverse transcription polymerase chain reaction (RT-PCR). The effect of TFAM on cell growth,migration,colony formation and apoptosis were evaluated. Mitochondrial biogenesis in pancreatic cancer and normal cells were examined.Results: The majority of pancreatic cancer tissues exhibited higher TFAM expression compared to the adjacent counterparts. Consistently,TFAM mRNA and protein levels were higher in pancreatic cancer cell lines than in immortalized normal pancreatic epithelial cells. There was no difference on TFAM level between gemcitabine-sensitive and resistant pancreatic cancer cells. Functional analysis demonstrated that TFAM overexpression activated pancreatic normal and tumor cells whereas TFAM inhibition effectively inhibited the growth of pancreatic cancer cells. TFAM inhibition enhanced gemcitabine’s cytotoxicity and suppressed growth,anchorage-independent colony formation and survival of gemcitabine-resistant pancreatic cancer cells. Mechanistic studies showed that TFAM inhibition resulted in remarkable mitochondrial dysfunction and energy crisis followed by oxidative stress. The basal mitochondrial biogenesis level correlated well with TFAM level in pancreatic cancer cells.Conclusions: TFAM played essential roles in pancreatic cancer via regulating mitochondrial functions which highlighted the therapeutic value of inhibiting TFAM to overcome gemcitabine resistance.
Introduction
Pancreatic cancer is one of the most lethal malignancies worldwide and the incidence is gradually increasing in the past decade [1] . The current treatment options for pancreatic cancer are limited,only surgical resection and chemotherapy [2] .Gemcitabine-based neoadjuvant treatment is the most commonly used for pancreatic cancer patients [3] . However,the prognosis of pancreatic cancer is poor with an overall 5-year survival rate<5%,and this is because of delayed diagnosis that 80% of patients presenting with inoperable disease at the time of diagnosis,and resistance to all tested cytotoxic drugs [4] . The identification of novel potential therapeutic targets is necessary to improve the clinical management of pancreatic cancer.
Mitochondrion has emerged as a therapeutic target for cancer due to the preferential dependence of cancer cells on mitochondrial respiration,in particular cancer stem cells and treatmentresistant cancer cells [5–8] . The mammalian mitochondrial DNA(mtDNA) encodes 13 polypeptides that constitute the central core of mitochondrial electron transport chain (ETC) complexes,including complex I,III,IV and the F1F0 ATP synthase [9] . Mitochondrial transcription factor A (TFAM) is essential for the replication,transcription,and maintenance of mtDNA and thus is indispensable for proper mitochondrial biogenesis and function [ 10,11 ]. The role of TFAM in cancer transformation,progression and chemoresistance,has been recently revealed. However,the findings are inconclusive as both anti-cancer and pro-cancer regulatory effects of TFAM have been observed. TFAM inhibition suppresses gastric cancer cell growth and overcomes hepatocellular carcinoma resistance to sorafenib and doxorubicin whereas promotes intestinal tumorigenesis and breast cancer growth [12–15] . The role of TFAM and mitochondrial function in pancreatic cancer is unknown. Using clinical samples and pre-clinical pancreatic cancer models,we systematically analyzed the expression pattern and function of TFAM,and their correlation with mitochondrial function in pancreatic cancer cells,including gemcitabine-resistant cells.
Methods
Human tissue specimens and immunohistochemistry
The specimens were obtained from 18 patients with pancreatic cancer at Xiangyang Central Hospital. All patients signed an informed consent approved by the Institutional Review Board of Xiangyang Central Hospital. Fresh specimens from resected pancreases were used for paraffin embedding. Patients were all adults,and age and sex were not considered as relevant factors in this study. Formalin-fixed paraffin embedding tissue blocks were sectioned to a thickness of 4 μm per slide,followed by immunohistochemistry using a rabbit monoclonal antibody against TFAM (Abcam #ab171951,Waltham,MA,USA) as per the standard protocol [16] .
Cell culture and generation of gemcitabine-resistant cell lines
The human pancreatic cell lines Capan-2,PANC-1,MIApaCa-2,HPAC and BxPC-3 were obtained from the Cell Bank of Type Culture Collection of Chinese Academy of Sciences; the immortalized normal pancreatic duct epithelial cell line H6c7 was purchased from Kerafast (Boston,MA,USA). The cell lines included in the present study were analyzed by short tandem repeat profiling. All cells were maintained at 37 °C in 5% CO2in RPMI1640 (Invitrogen,Carlsbad,CA,USA,#21870084) containing 10% FCS (ThermoFisher Scientific,#26140,Waltham,MA,USA),1% L-glutamine (ThermoFisher Scientific,#A2916801) and 1% sodium pyruvate (ThermoFisher Scientific,#11360039). Gemcitabine-resistant cell lines were generated by exposure of their corresponding parental (sensitive) cell lines to gemcitabine (Selleckchem,#S1714,Houston,TX,USA) treatment at gradually increasing concentrations. The initial concentration of gemcitabine was 1 nmol/L. The next dose that was 50%-75% of increase of the previous dose was given until the cells were stable in proliferation without significant death. The whole process took 9 months and the established resistant cell lines were maintained continuously in medium containing gemcitabine at 3μmol/L.
Proliferation and apoptosis assays
Cell proliferation was assessed by quantifying incorporated BrdU level using BrdU Proliferation Assay (Abcam,#ab126556);apoptosis was assessed via quantifying Annexin V (Stemcell Technologies,#100-0338,Seattle,WA,USA) using flow cytometry after 72 h of gemcitabine treatment or post-transfection. All cellular experiments were performed according to manufacturer’s instructions.
Colony formation
Anchorage-independent colony formation assay was performed using soft agar as previously described [17] . Bacto agar (0.7%) in medium was plated onto a 12-well plate to form bottom layer after solidification. Bacto agar (0.3%) in medium and cells (5000/well)with or without gemcitabine were plated onto the bottom layer.Plates were incubated in 37 °C humidified atmosphere,and 100 μL medium was added twice weekly. After 10-14 days,colonies were formed and captured under microscope.
Transwell migration assay
Cell migration was assessed by using CytoSelect 24-well cell migration assay (Cell Biolabs,#CBA-101,San Diego,CA,USA).Briefly,cells with or without gemcitabine in the medium containing 2% fetal calf serum (FCS) were plated onto the upper chamber.Medium containing 10% FCS as chemoattractant was plated onto the lower chamber. Migrated cells were quantified as per manufacture’s protocol after 8 h incubation.
Transfection
For TFAM knockdown,cells were transfected with small interfering RNA (siRNA TFAM,Sigma,NM_003201,Saint Louis,MO,USA),and a nontargeted control siRNA (siRNA control,Sigma,SIC001) was used as a negative control. For TFAM overexpression,cells were transfected with TFAM-overexpressing plasmid (p-TFAM). TFAM was cloned into pCMV3-C-his vector (Sino Biological,#CV015,Chesterbrook,PA,USA). The transfection was performed using lipofectamine 2000 (Invitrogen,#11668030) method as per manufacturer’s protocol.
Measurement of mitochondrial respiration, mitochondrial potential,reactive oxygen species (ROS) and ATP level
Assessment of mitochondrial function was performed by Seahorse XF Analyser using Cell Mito Stress Test Kit (Seahorse Bioscience,#103010-100,North Billerica,MA,USA) as per manufacture’s protocol. Oxygen consumption rate (OCR) was measured in the absence and presence of 1.5μmol/L oligomycin,1μmol/L carbonyl cyanide-4-phenylhydrazone (FCCP),0.5μmol/L antimycin A,and 0.5μmol/L rotenone. OCR was normalized to total cellular protein content determined directly in the plate.Mitochondrial membrane potential (Δψm) was measured by using 5,51,6,61-tetrachloro-1,11,3,31tetraethylbenzimidazolyl carbocyanine iodide (JC-1; Cayman,#10009172,Arbor,MI,USA) followed by flow cytometry analysis (MACSQuant Miltenyi Biotec Inc.,San Jose,CA,USA). To measure intracellular ROS,cells were incubated with 10 μmol/L CM-H2DCFDA (ThermoFisher Scientific,#C6827)and the absorbance at ex/em of 495/525 nm was measured using Spectramax M5 microplate reader (Molecular Devices,San Jose,CA,USA). Intracellular ATP level was measured by ATPlite Luminiescent Assay kit (Perkin Elmer,#6016943,Waltham,MA,USA).
Real-time polymerase chain reaction (PCR)
For TFAM mRNA analysis,total RNA was extracted using the TripleXtractor reagent (GRiSP,#GB23.0050,Porto,Portugal) from cells,followed by cDNA synthesis using AMV Reverse Transcriptase kit (Promega,#M9004,Madison,WI,USA). For mtDNA copy number analysis,genomic DNA was extracted from primary cells using the DNeasy Blood and Tissue kit (Qiagen,#69504,Germantown,MD,USA). TFAM and mtDNA (ND1) copy number were determined by an SYBR GREEN real-time PCR. The primer sequences of TFAM and ND1 were the same as previously reported [ 13,18 ].The mean cycle threshold value (Ct) from triplicate samples was used to calculate the gene expression. PCR products of TFAM and mtDNA (ND1) were normalized to GAPDH and nuclear DNA (HGB-1),respectively.
ELISA assay
TFAM level was determined using TFAM ELISA Kit (Abcam,#ab123455) as per manufacture’s protocol. Briefly,cells were homogenized using a standard protocol,and samples were adjusted to the concentration of 10 mg/mL using phosphate buffer solution (PBS). Equal volume of extraction buffer was added to the homogenate and incubated for 20 min. The sample protein concentration in the extract was diluted in incubation buffer to 0.2 mg/mL. Then 50μL of samples or serially diluted human TFAM standards were added to microplates coated with antibody against TFAM. Incubation buffer was used as a zero standard. The concentration was determined colorimetrically using Tecan Infinite Microplate Reader (Morrisville,NC,USA).
Statistical analysis
Statistical analyses of the differences between groups were performed using the one-way analysis of variance (ANOVA) and subsequently by unpaired Student’sttest. APvalue<0.01 was considered statistically significant.
Results
TFAM upregulation is a feature of pancreatic cancer
The patients’ clinical characteristics including age,tumor size and location,disease stage and differentiation status were shown in Table S1 . Our immunohistochemistry analysis demonstrated that TFAM expression was significantly increased by 2-fold in pancreatic cancer tissue compared with that in adjacent normal tissues( Fig. 1 ). In addition,we did not observe any significant association between patients’ clinical characteristics and TFAM level. The increased TFAM expressions were observed in highly,moderately,and poorly differentiated tumors ( Fig. S1 ). As shown in Fig. 1 D,we further analyzed the RNA-Seq datasets of 179 pancreatic cancer samples and 171 normal samples from the TCGA and the GTEx projects [19],which showed a significant increase of TFAM mRNA in pancreatic cancer compared to that in the normal tissue. This was consistent with our finding on the expression pattern of TFAM in pancreatic cancer and adjacent counterparts,demonstrating that TFAM upregulation is a common feature of pancreatic cancer. We further analyzed the relationship of TFAM expression with overall survival and disease-free survival using GEPIA web server in pancreatic cancer patients [19] . The results demonstrated that patients with high TFAM had significantly lower overall survival and disease-free survival than those with low TFAM ( Fig. S2 ).
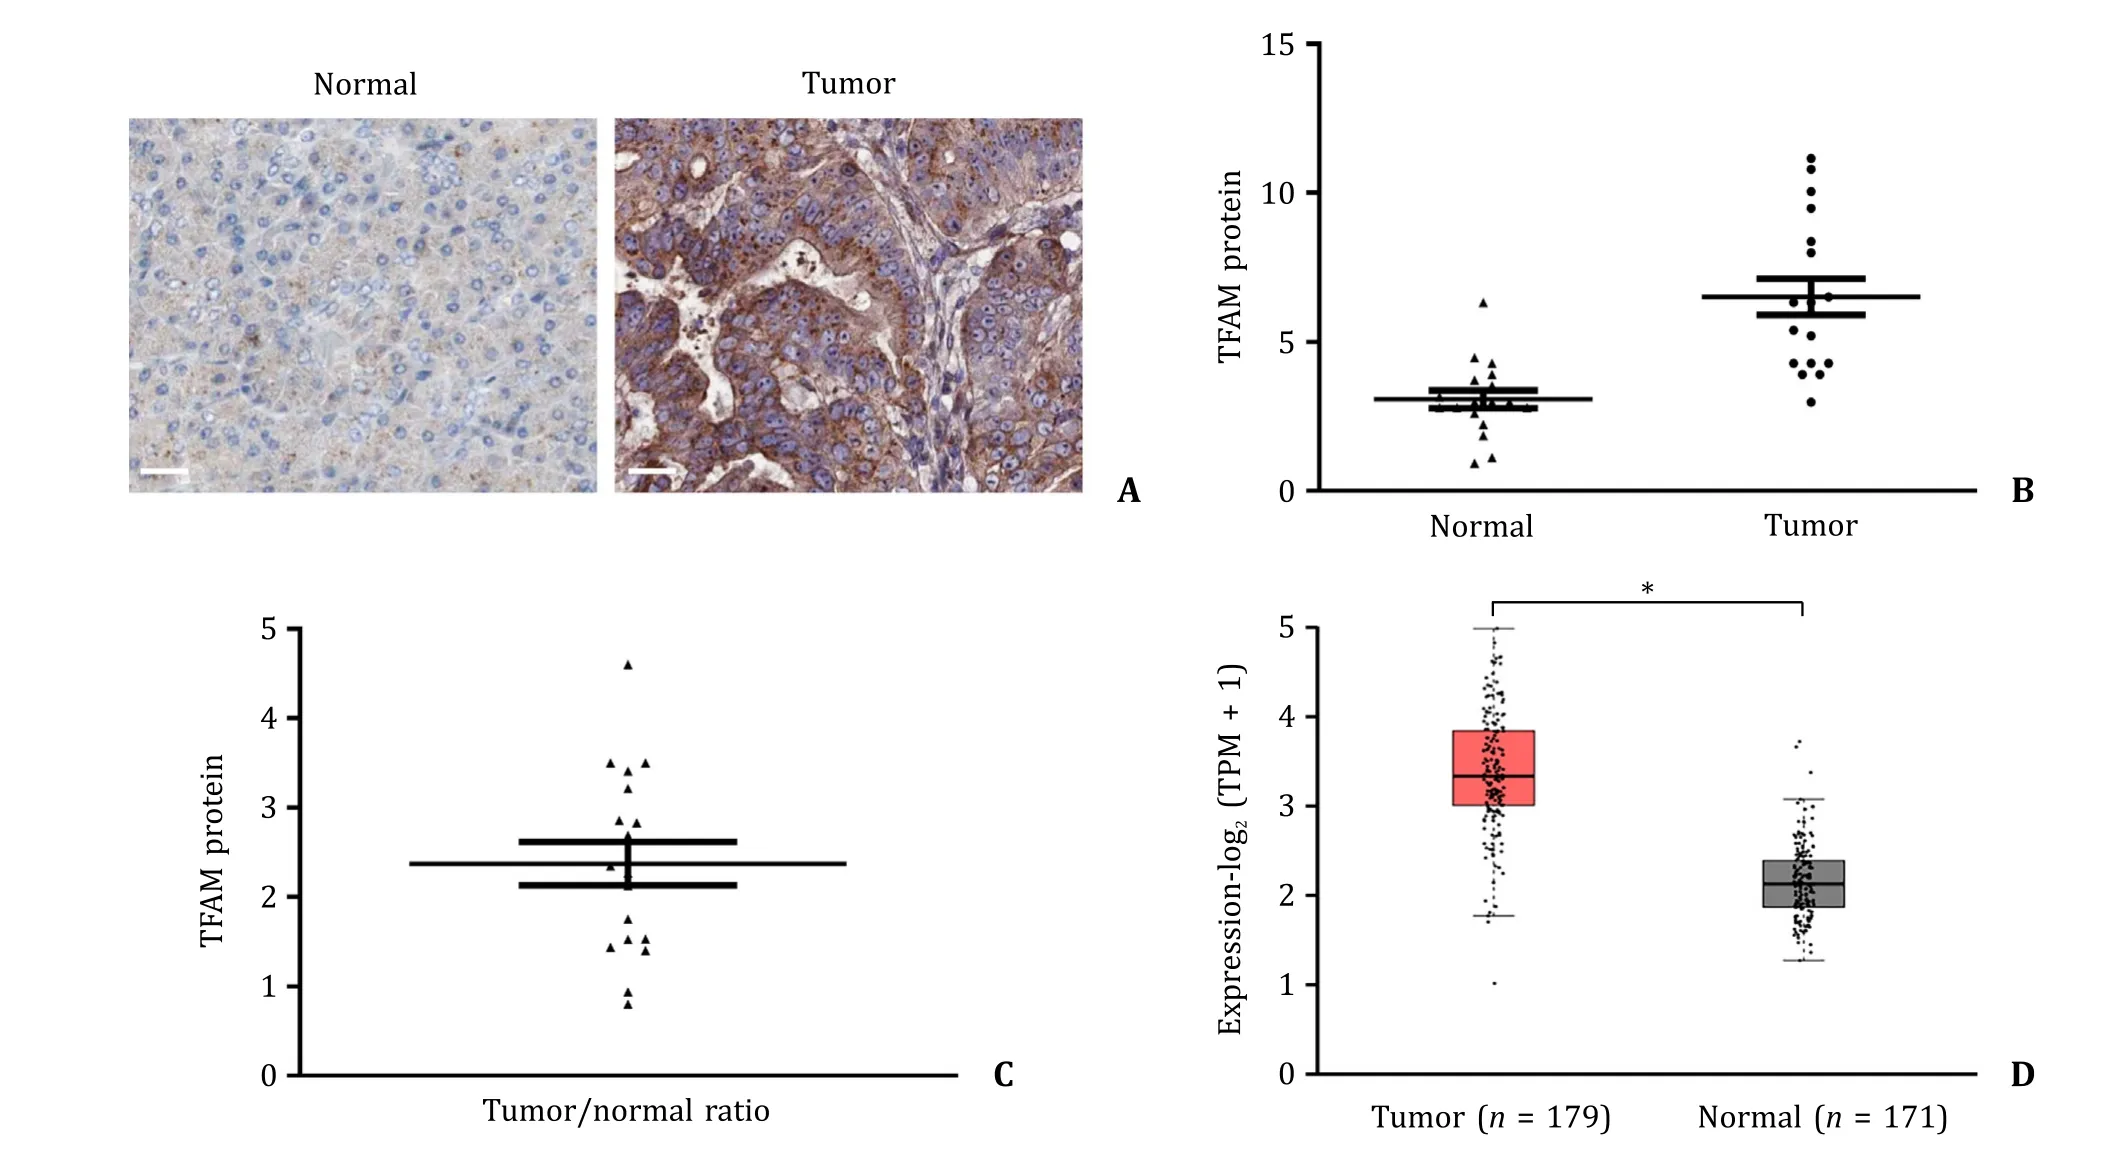
Fig. 1. TFAM expression in pancreatic cancer and normal pancreatic tissue. A: Representative images of immunohistochemical staining of TFAM in pancreatic cancer and adjacent pancreatic tissue obtained from three patients with pancreatic cancer. Scale bar represents 10 μm. B: Scatter plot of TFAM protein level in paired pancreatic cancer( n = 18) and their adjacent normal pancreatic tissue ( n = 18). The line shown in scatter plot indicates the average expression of TFAM in pancreatic cancer and normal tissue.TFAM was quantified by Image J software. C: Average of TFAM ratio of tumor and normal tissue in patients with pancreatic cancer ( n = 18). D: TFAM mRNA expression in normal pancreatic and pancreatic cancer tissues. The data were obtained from the TCGA and the GTEx projects. ?P < 0.01. TFAM: mitochondrial transcription factor A. TPM:transcripts per million.
Pancreatic cancer cells (Capan-2,PANC-1,MIApaCa-2,HPAC and BxPC-3) and immortalized normal pancreatic epithelial cells (H6c7)demonstrated a similar expression pattern on TFAM level as tissues. Capan-2 displayed a comparable level as H6c7 on TFAM mRNA and protein ( Fig. 2 A). PANC-1,MIApaCa-2,HPAC and BxPC-3 displayed higher level of TFAM mRNA and protein than H6c7. Gemcitabine remarkably decreased the viability of parental pancreatic cancer cell lines (Capan-2-Gem-s and PANC-1-Gem-s) whereas the same concentration was ineffective in Capan-2-Gem-r and PANC-1-Gem-r cells ( Fig. 2 B). In addition,there were no significant differences on TFAM mRNA and protein level between gemcitabinesensitive and resistant cell lines ( Fig. 2 C).
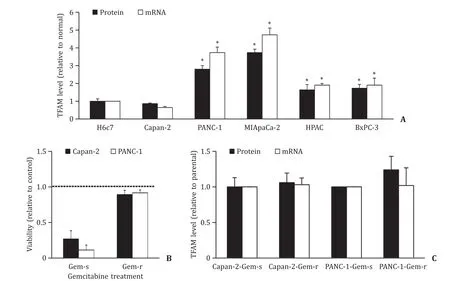
Fig. 2. TFAM expression in pancreatic cancer and normal pancreatic cells. A: TFAM protein and mRNA levels are significantly higher in PANC-1,MIApaCa-2,HPAC and BxPC-3 cells than in H6c7 cells. B: Gemcitabine resistant Capan-2 and PANC-1 cells are insensitive to gemcitabine in decreasing viability. Gemcitabine at 3 μmol/L was used for treatment. Control was set as 1. C: No significant difference on TFAM protein and mRNA levels between gemcitabine-sensitive and resistant pancreatic cancer cell lines. TFAM level was normalized with total protein amount. The results were obtained from three independent experiments ( n = 3) with each group duplicate or triplicate. ?P < 0.01,compared to H6c7. TFAM: mitochondrial transcription factor A.
TFAM overexpression activates normal pancreatic epithelial cell and pancreatic cancer cell biological activities
We next attempted to determine the role of TFAM in cell behaviors using gain-of-function approach. We overexpressed TFAM in normal pancreatic cell line H6c7 and pancreatic cancer cell line Capan-2. We observed a ~4-fold increase of TFAM level in TFAMoverexpressing H6c7 and Capan-2 cells ( Fig. 3 A). Our BrdU incorporation assay showed that TFAM overexpression significantly increased the proliferation of H6c7 and Capan-2 cells by 2-fold and 3-fold,respectively ( Fig. 3 B). TFAM did not affect H6c7 or Capan-2 cell migration ( Fig. 3 C). TFAM overexpression significantly increased cell anchorage-independent colony formation of Capan-2 but not H6c7 cells ( Fig. 3 D and E). Notably,H6c7 did not form any colonies,and this is consistent with the fact that H6c7 growth is anchorage-dependent [20] .
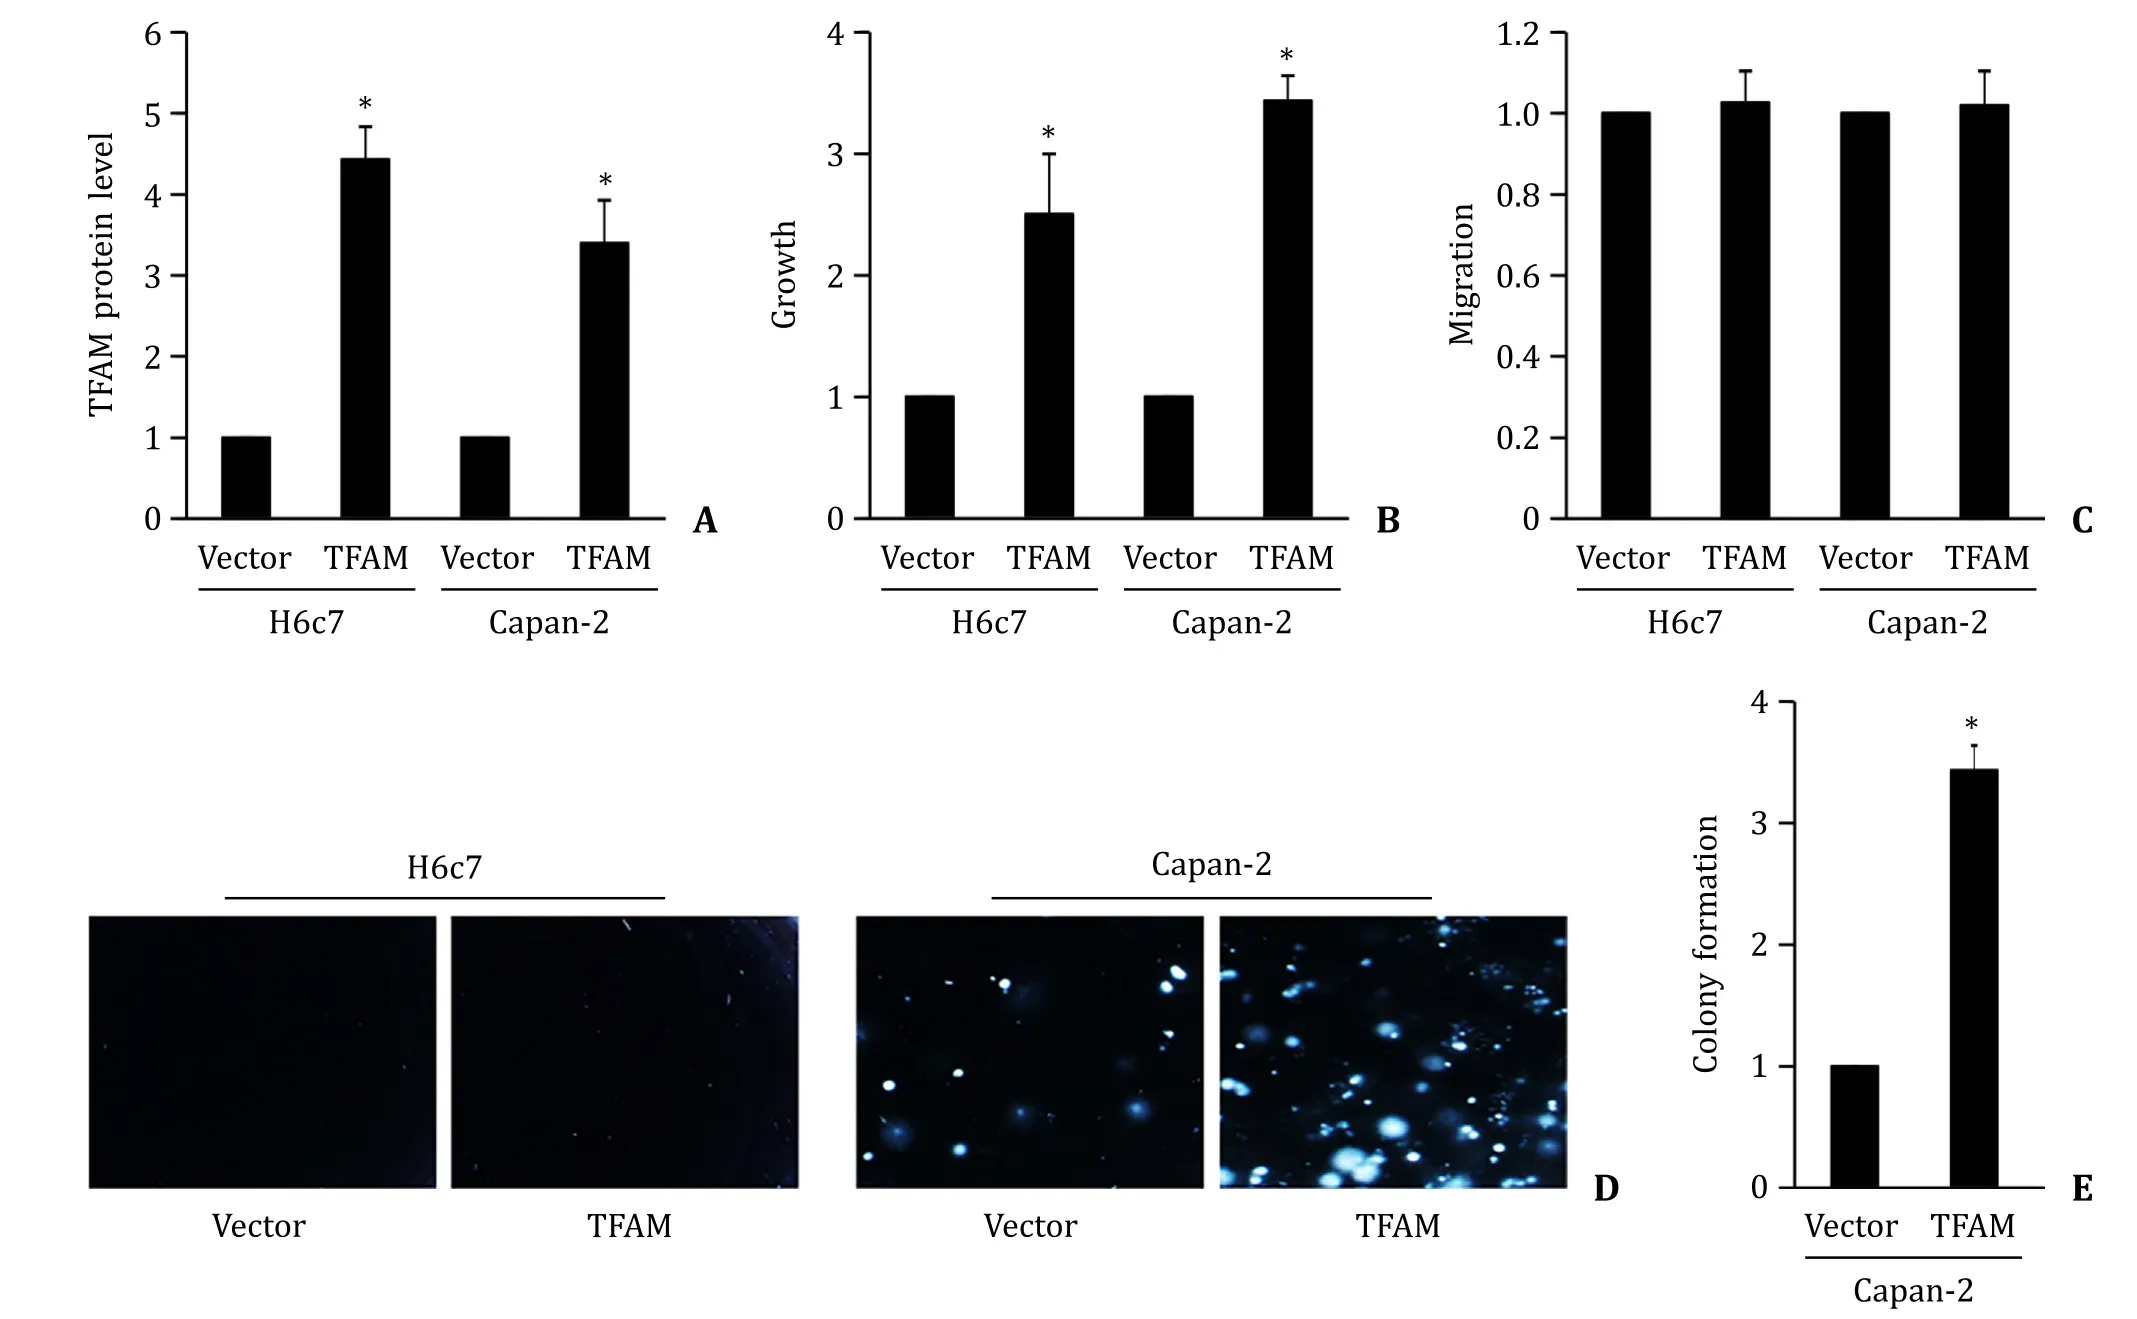
Fig. 3. TFAM overexpression promotes normal pancreatic cell activities. A: TFAM overexpression significantly increases TFAM protein level in H6c7 and Capan-2 cells. TFAM overexpression significantly increases proliferation ( B ) without affecting migration ( C ) in H6c7 and Capan-2 cells. Image ( D ) and quantification ( E ) of colony formation display increased number of colonies in TFAM-overexpressing Capan-2 cells. The results were obtained from four independent experiments with each group duplicate. ?P < 0.01,compared to Vector.
TFAM inhibition overcomes pancreatic cancer cell resistance to gemcitabine
To investigate the therapeutic potential of TFAM in pancreatic cancer,we inhibited TFAM via siRNA knockdown ( Fig. S3 ). In line with TFAM overexpression,we found that TFAM knockdown significantly decreased proliferation and anchorage-independent colony formation,and induced apoptosis in Capan-2 and PANC-1 cells( Fig. 4 A). PANC-1 seemed to be more sensitive to TFAM knockdown than Capan-2 cells. TFAM knockdown did not affect pancreatic cancer cell migration ( Fig. 4 B). Importantly,we observed the further decreased proliferation and colony formation,and further increased apoptosis by gemcitabine in TFAM-depleted cells compared to those in siRNA control cells ( Fig. 4 A). This demonstrated that TFAM inhibition sensitized pancreatic cancer cells to gemcitabine treatment. TFAM knockdown was also effective in gemcitabineresistant pancreatic cancer cell lines as shown by the decreased growth and colony formation,and increased apoptosis ( Fig. 4 C-E).TFAM knockdown did not affect gemcitabine-resistant pancreatic cancer cell migration ( Fig. 4 F). However,the combination of TFAM siRNA and gemcitabine was not significantly more effective than TFAM siRNA alone in gemcitabine-resistant pancreatic cancer cells( Fig. S4 ),suggesting that TFAM siRNA was less likely to enhance toxicity of gemcitabine on gemcitabine-resistant pancreatic cancer cells. We speculate that both arms (TFAM siRNA and gemcitabine)were effective to achieve synergism in combination.
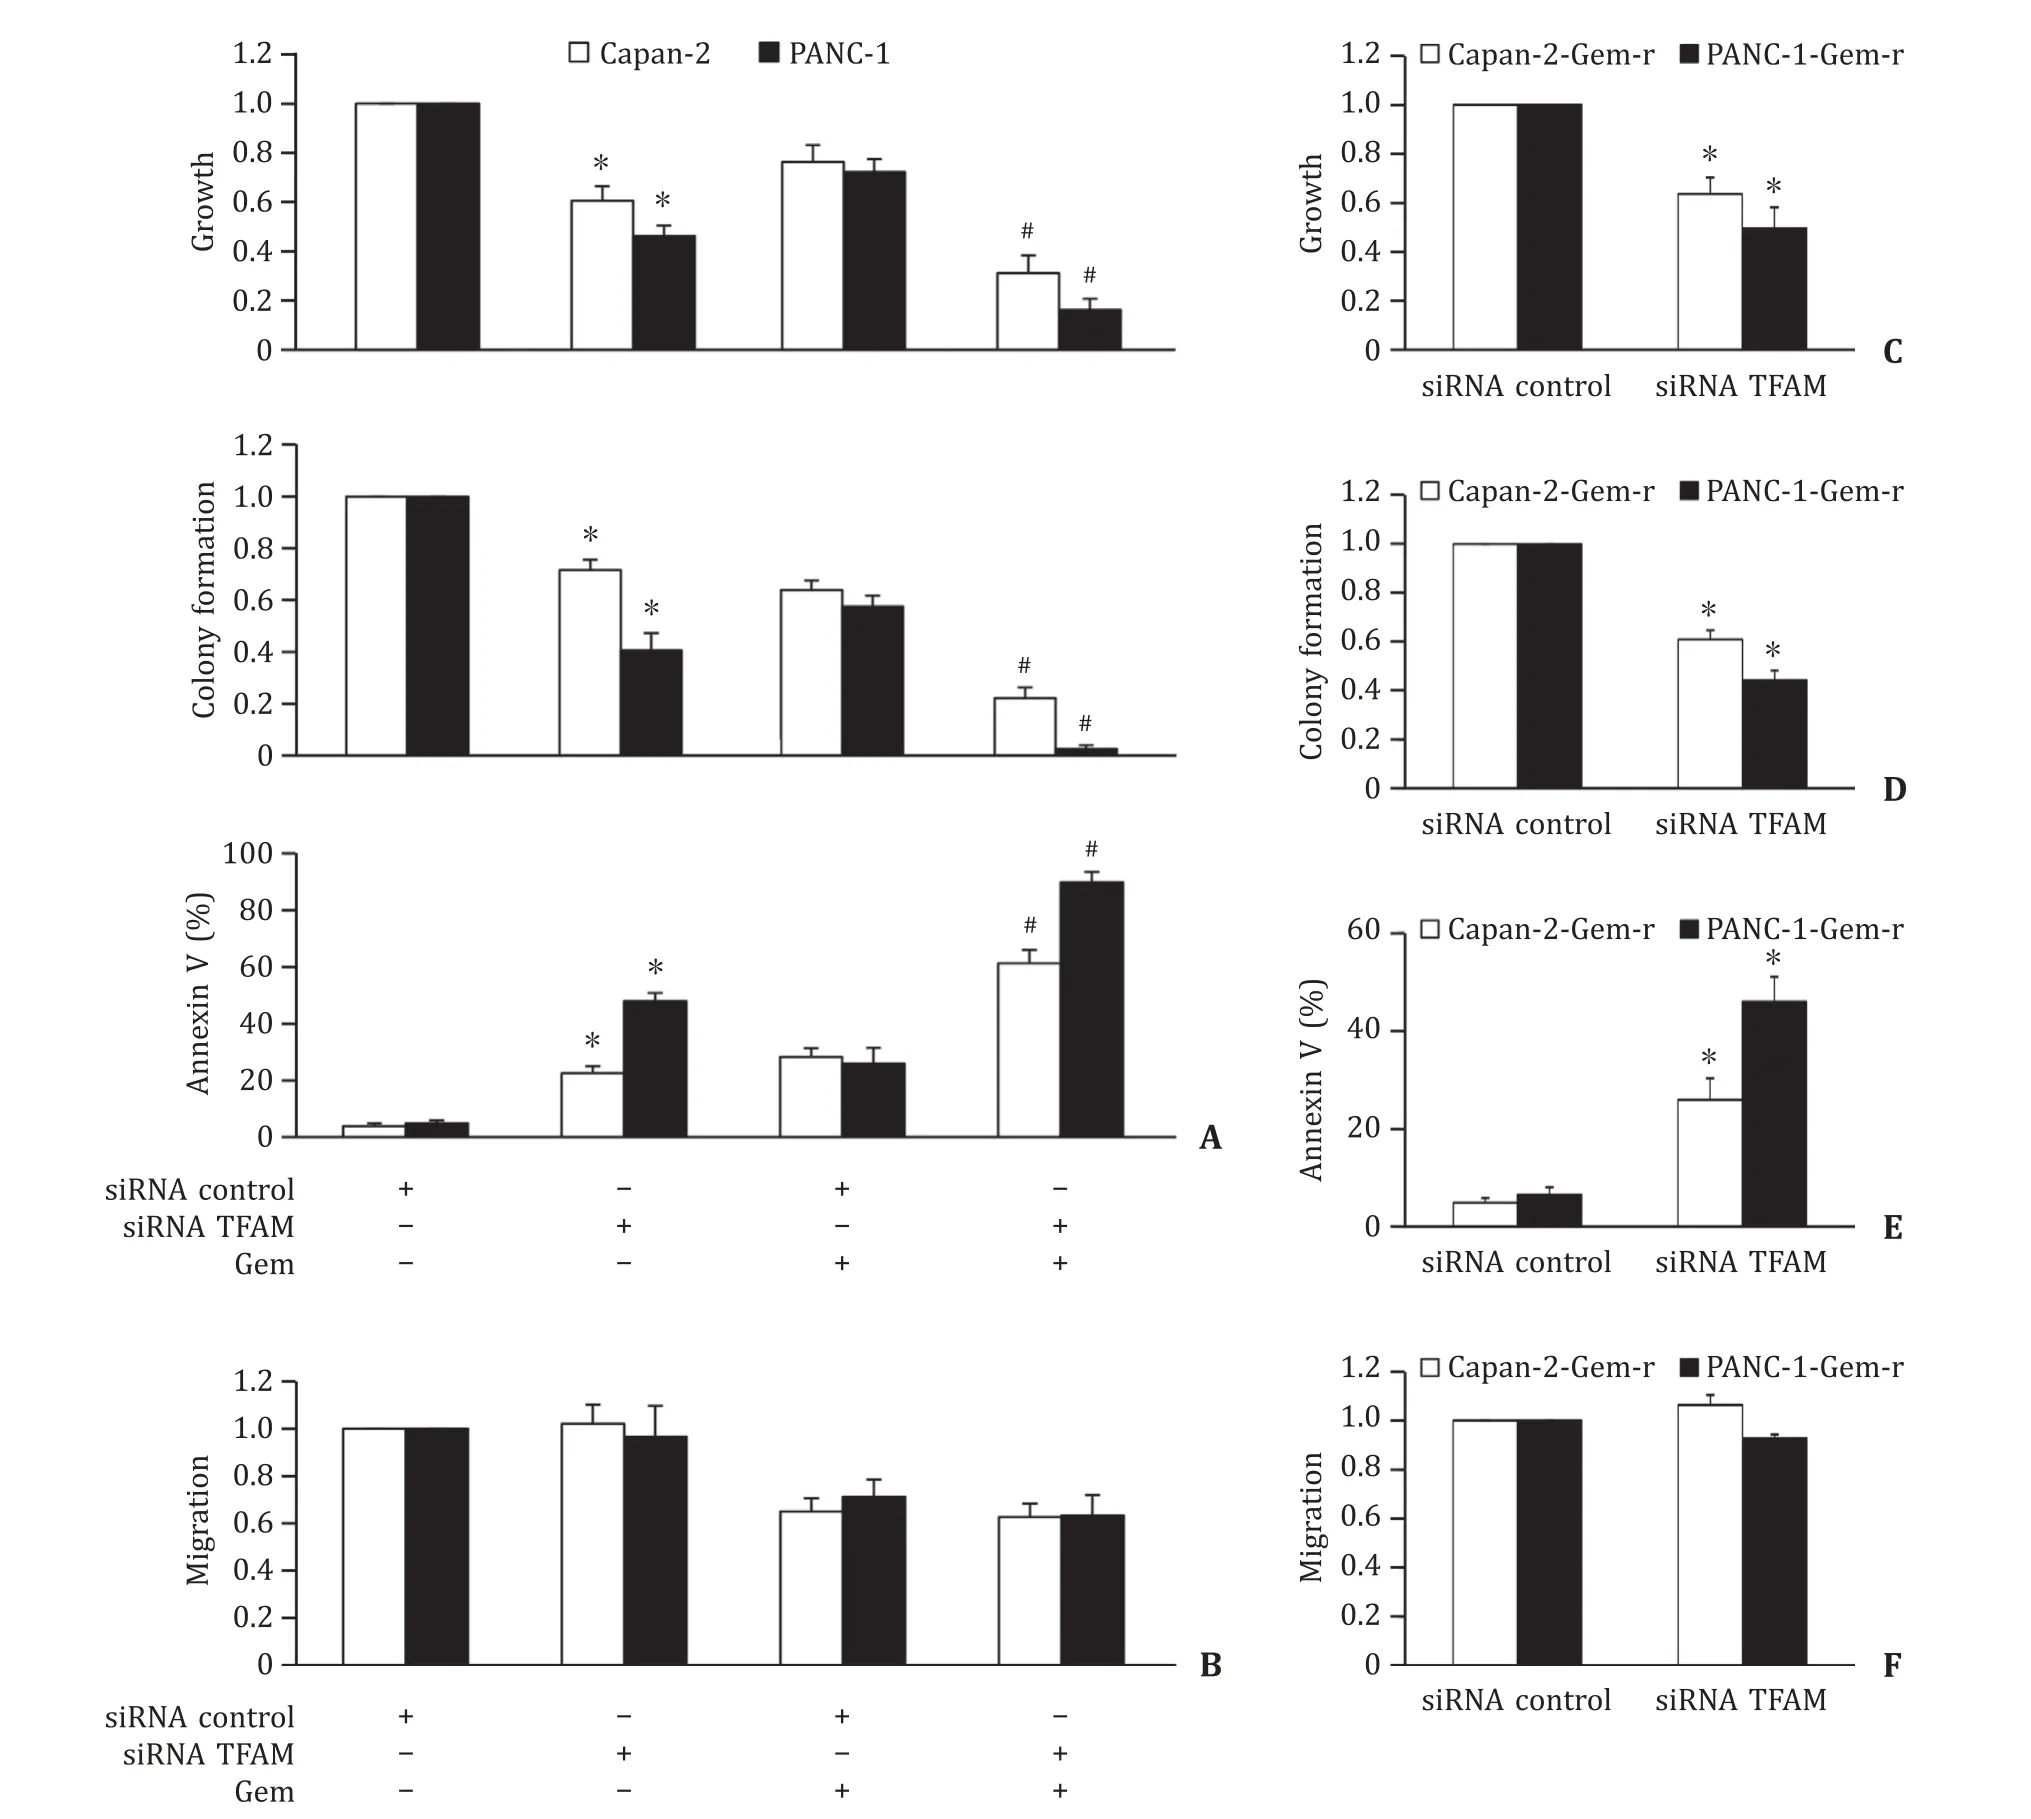
Fig. 4. TFAM inhibition suppresses pancreatic cancer and enhances toxicity of gemcitabine. A: TFAM depletion by siRNA significantly inhibits growth and colony formation,induces apoptosis,and augments the inhibitory effects of gemcitabine in Capan-2 and PANC-1 cells. B: TFAM depletion does not affect Capan-2 and PANC-1 cell migration and does not affect the inhibitory effect of gemcitabine on cell migration. Gemcitabine at 50 nmol/L and 200 nmol/L was added to Capan-2 and PANC-1 cells,respectively,at 48 h post-transfection. Proliferation and apoptosis were assessed after 72 h drug treatment. Migration was assessed within 8 h drug treatment. We used gemcitabine at concentration that leads to ~30% inhibition in order to observe the combinatory effect of TFAM depletion and gemcitabine. TFAM inhibition significantly decreases growth( C ),colony formation ( D ) and induces apoptosis ( E ) of Capan-2-gem-r and PANC-1-gem-r cells. F: TFAM does not affect migration of Capan-2-gem-r and PANC-1-gem-r cells.The results were obtained from four independent experiments with each group triplicate. ?P < 0.01,compared to siRNA control; # P < 0.01,compared to the group treated with gemcitabine alone. TFAM: mitochondrial transcription factor A.
TFAM regulates mitochondrial function in pancreatic cancer cells
Consistent with the important role of TFAM in mitochondrial biogenesis and function [11],we found that TFAM knockdown significantly decreased the level of mitochondrial respiration in pancreatic cancer cells regardless of gemcitabine sensitivity ( Fig. 5 A and B). Gemcitabine-sensitive and gemcitabineresistant cells were non-responsive to FCCP stimulation after TFAM knockdown,demonstrating that both basal and maximal mitochondrial respiration were impaired in TFAM-depleted pancreatic cancer cells. We further observed the decreased mitochondrial membrane potential and reduced ATP level by TFAM knockdown ( Fig. 5 C and D). Consistent with the mitochondrial dysfunction and energy crisis,we found that intracellular level of ROS was significantly increased ( Fig. 5 E).
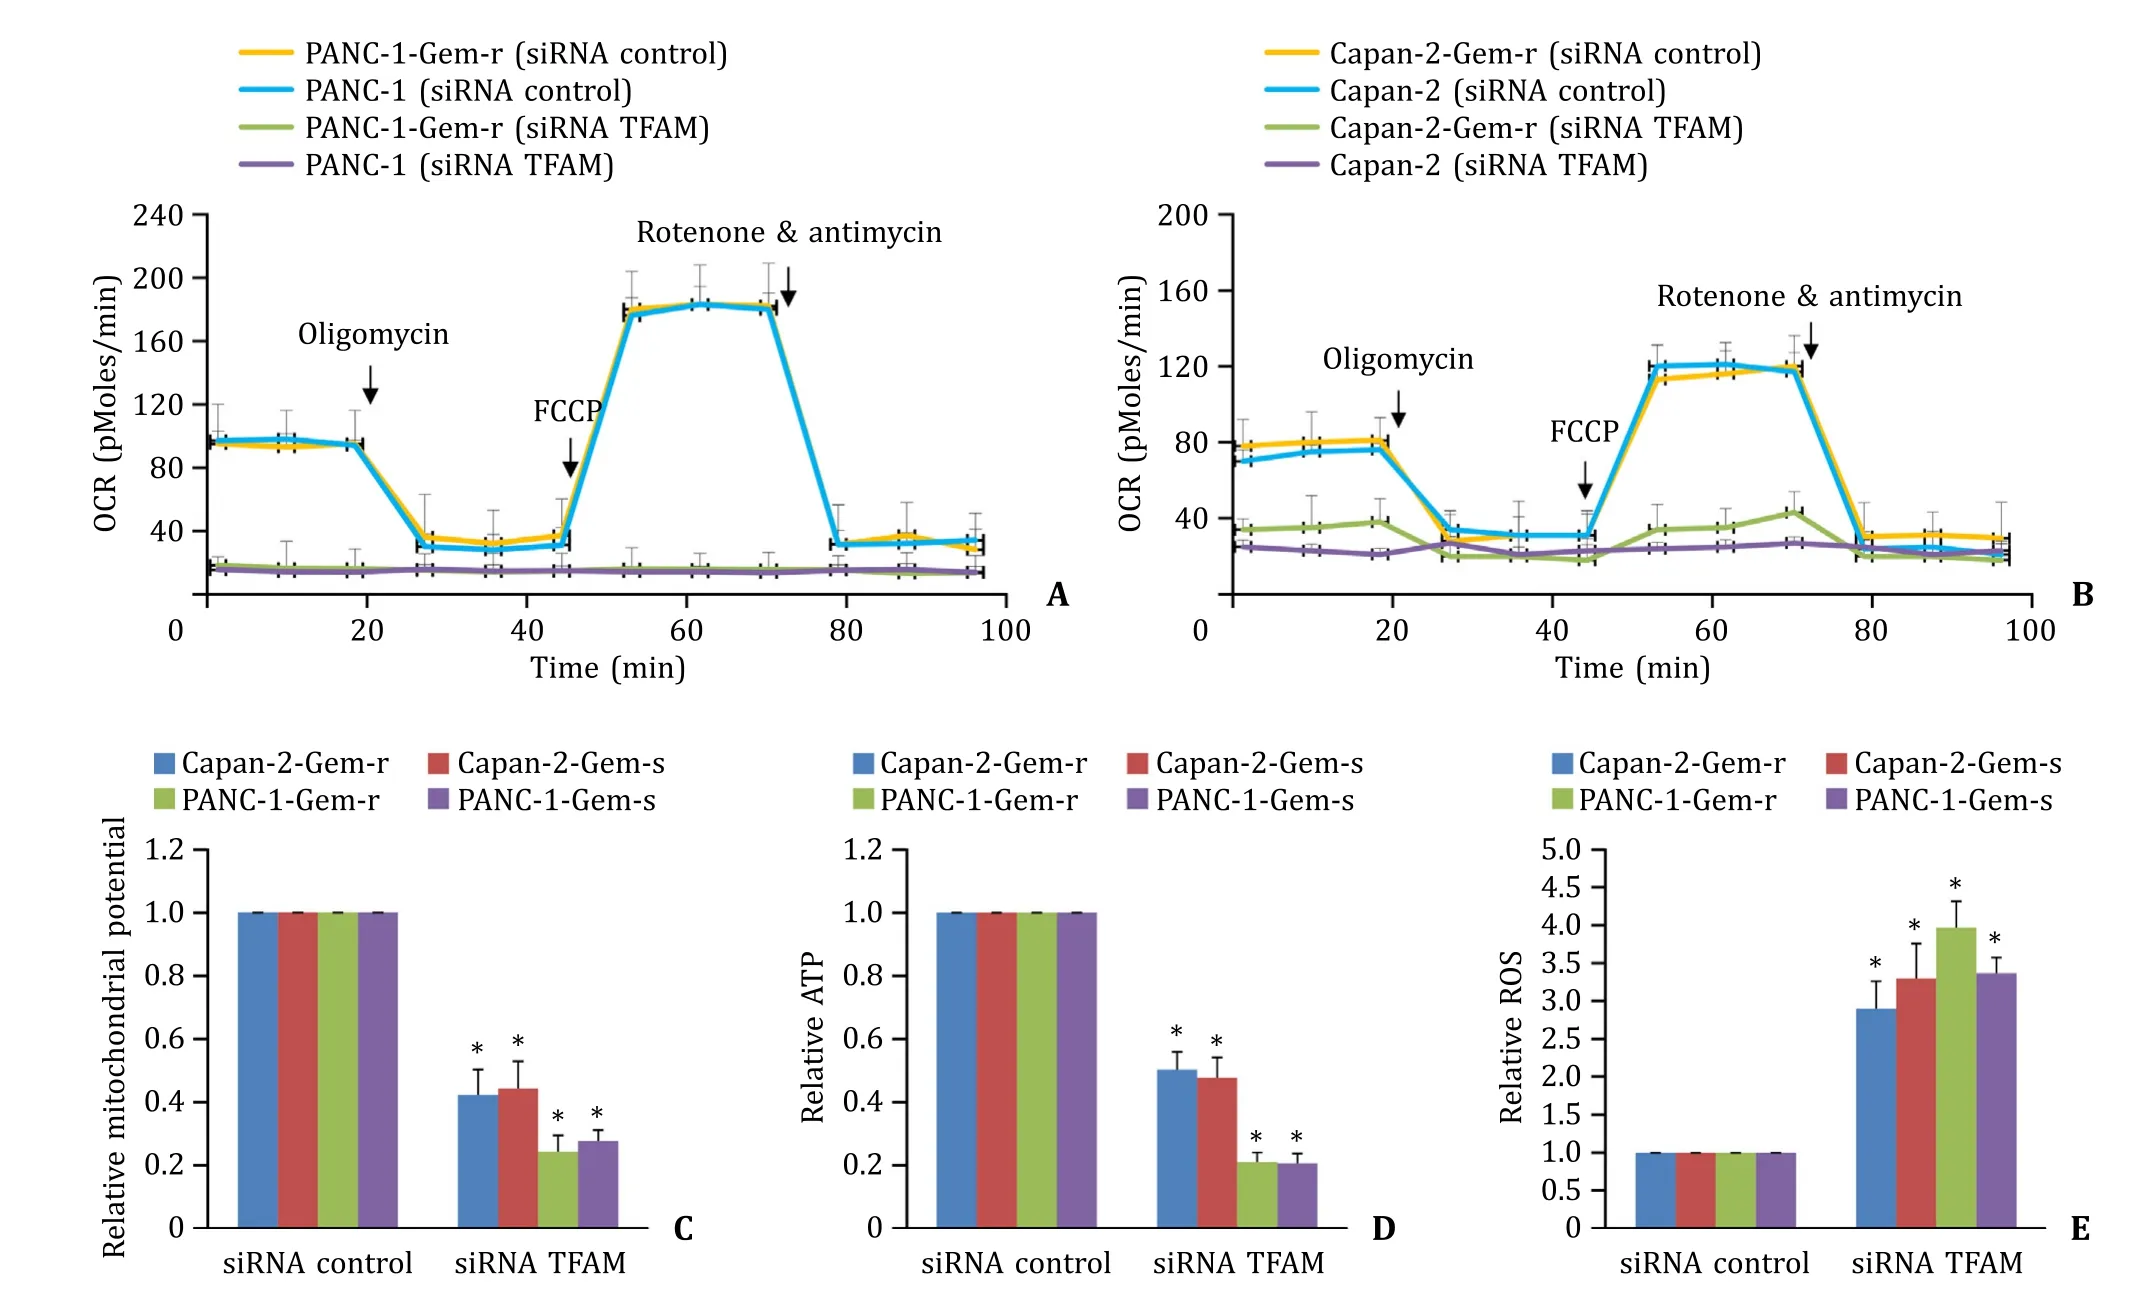
Fig. 5. TFAM depletion induces mitochondrial dysfunction in gemcitabine-sensitive and resistant pancreatic cancer cells. Oxygen consumption rate (OCR) in the absence and presence of oligomycin,FCCP and combination of rotenone and antimycin in control and TFAM-depleted gemcitabine-sensitive and resistant PANC-1 ( A ) and Capan-2 ( B )cells. TFAM depletion significantly decreases mitochondrial membrane potential ( C ) and ATP level ( D ),and increases intracellular ROS level ( E ) in gemcitabine-sensitive and resistant pancreatic cancer cells. The results were obtained from four independent experiments with each group duplicate. ?P < 0.01,compared to siRNA control. TFAM:mitochondrial transcription factor A; ROS: reactive oxygen species.
We further found that PANC-1 and MIApaCa-2 exhibited higher basal and maximal OCR than Capan-2 and H6c7 cells ( Fig. 6 AC). The basal and maximal OCR of H6c7 and Capan-2 were comparable. In addition,PANC-1 and MIApaCa-2 exhibited increased copy number of mtDNA and ATP level compared to Capan-2 and H6c7 cells ( Fig. 6 D and E). Gemcitabine-resistant pancreatic cancer cells (PANC-1-Gem-r and Capan-2-Gem-r) exhibited similar mtDNA copy number and ATP level as their parental cells (PANC-1 and Capan-2). These results demonstrated that the levels of OCR,mtDNA and ATP in these cells correlated well with their TFAM expression level.
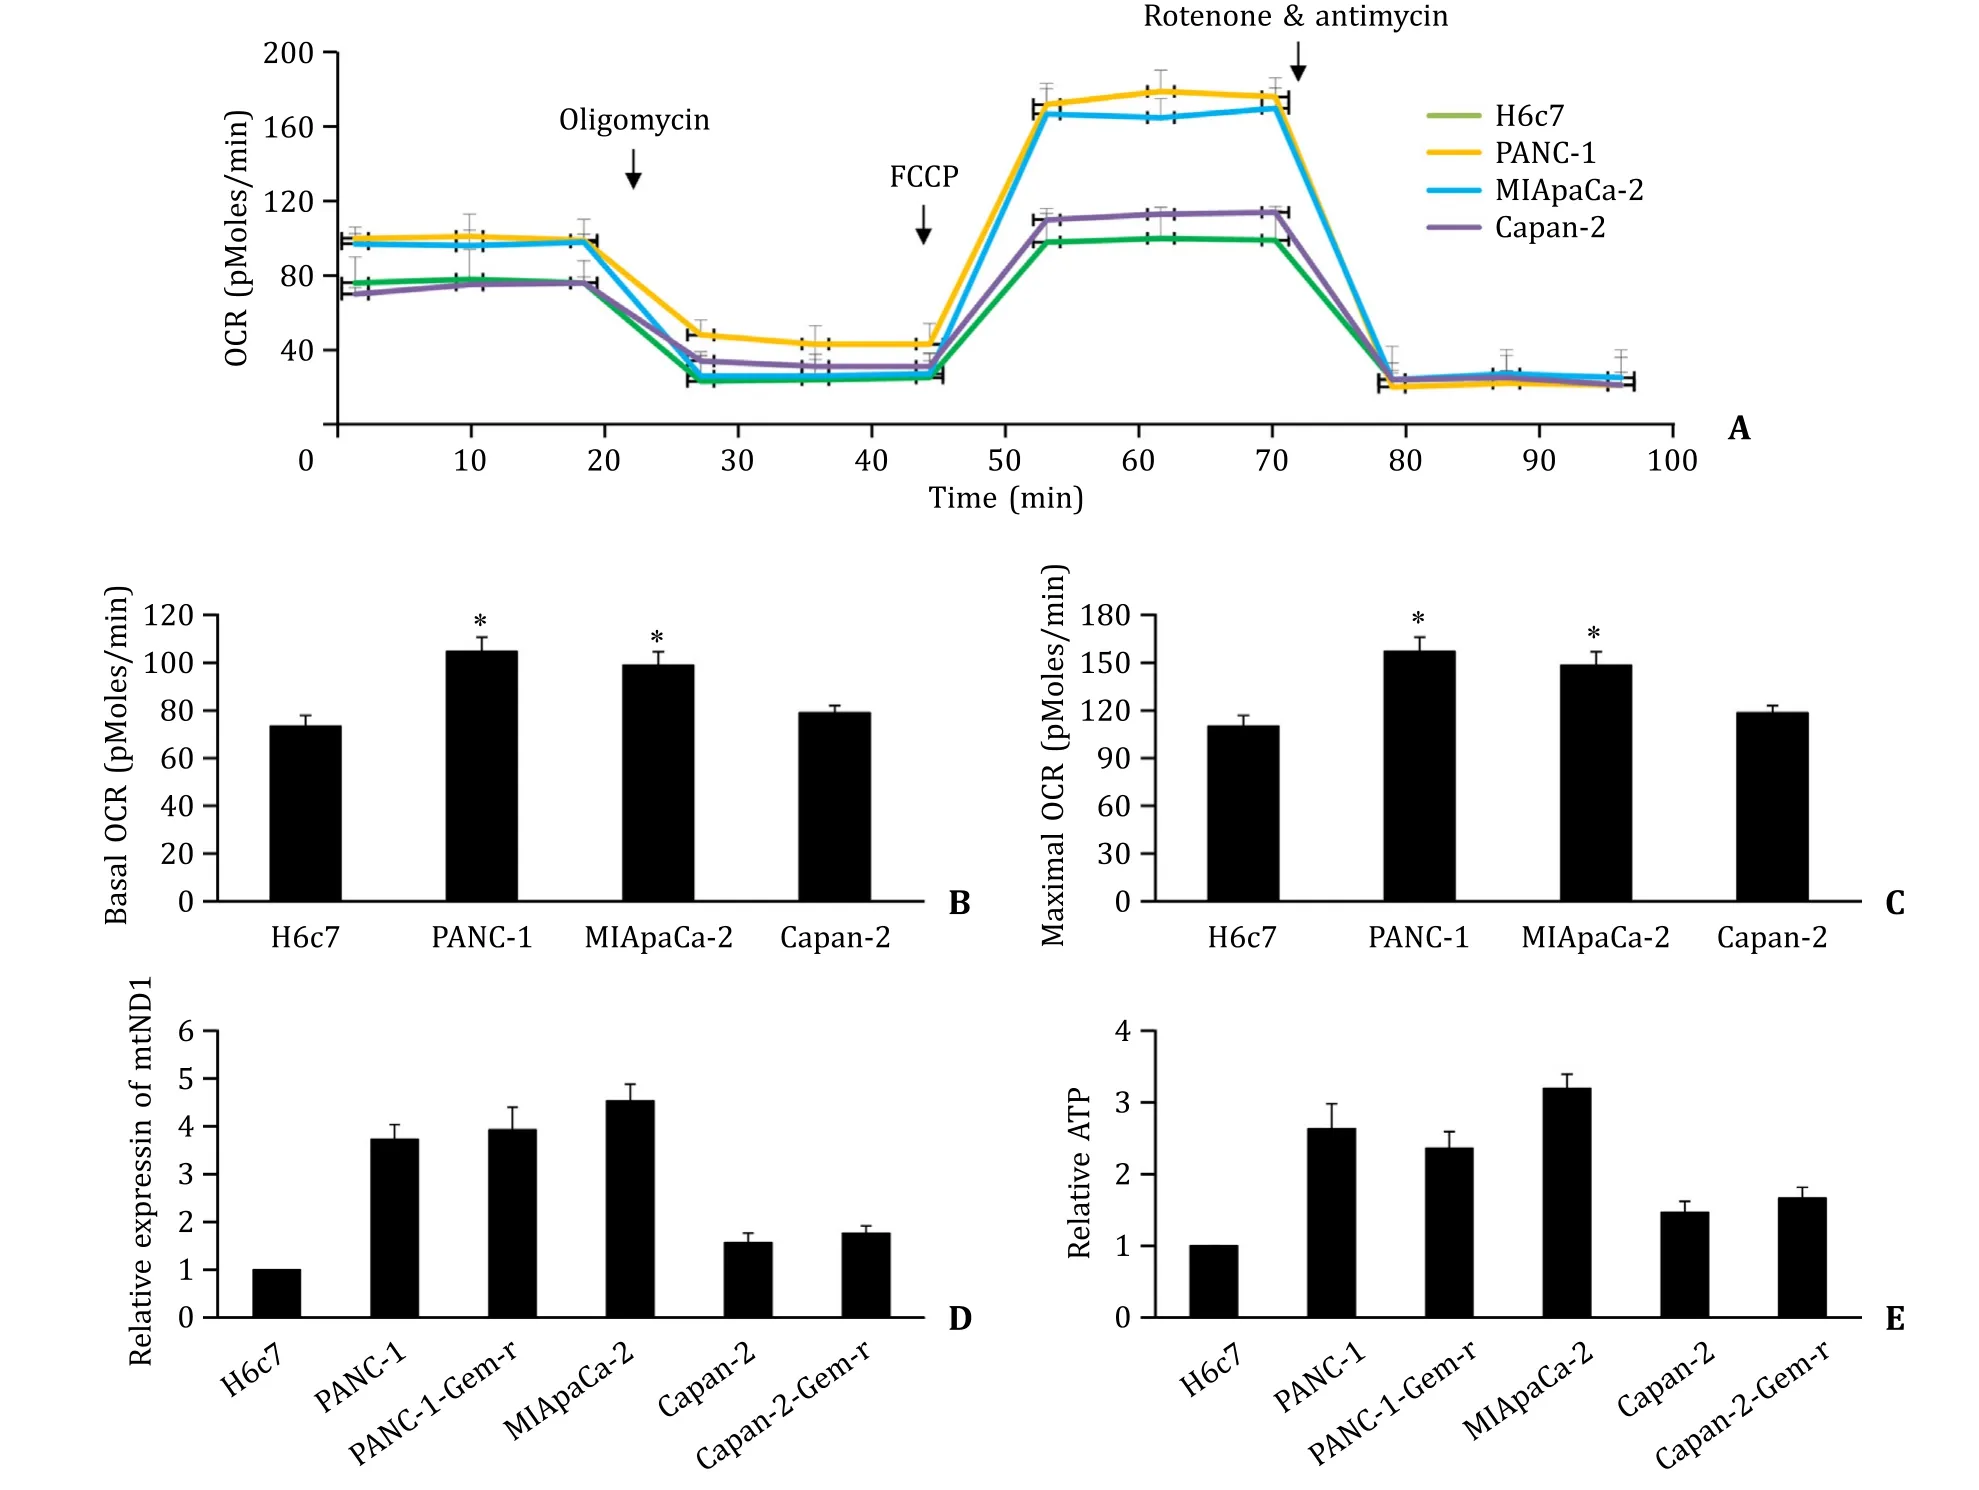
Fig. 6. Mitochondrial characteristics of normal pancreatic epithelial cells,gemcitabine-sensitive and resistant pancreatic cancer cells. OCR ( A-C ),mitochondrial DNA (ND1)expression level ( D ) and ATP level ( E ) in H6c7,PANC-1,PANC-1-Gem-r,MIApaCa-2,Capan-2 and Capan-2-Gem-r cells. The results were obtained from four independent experiments with each group duplicate. ?P < 0.01,compared to H6c7.
Discussion
Chemotherapy and therapies targeting cancer-associated molecular pathways have not given satisfactory results in pancreatic cancer because of the extensive heterogeneity of genetic mutations and rapid upregulation of compensatory alternative pathways [ 21,22 ]. Targeting common and essential drivers,such as mitochondrial metabolism,represents alternative essential therapeutic strategy. In this study,we showed that inhibiting mitochondrial function via targeting TFAM is effective to sensitize pancreatic cancer cell to gemcitabine.
Our finding that TFAM overexpression was a common feature in pancreatic cancer is supported by Yamauchi et al. who found that TFAM worsens the clinical course of patients with pancreatic cancer and is an independent marker for the poor prognosis of patients with pancreatic cancer after pancreatectomy [23] . Although the majority of pancreatic cancer patients demonstrated higher TFAM level,2 out of 18 tested samples displayed lower TFAM level in pancreatic cancer. This demonstrates the heterogeneity of TFAM expression in pancreatic cancer,which is consistent with the fact that there is a marked genetic heterogeneity of individual pancreatic cancers [24] . TFAM is enriched in glioma and hepatocellular carcinoma but not in their normal counterparts [ 25,26 ]. The previous studies together with our findings suggest that TFAM might serve as both prognostic and diagnostic marker in cancers with high expression. Interestingly,Zhu et al. reported that TFAM is also upregulated in hepatocellular cancer cells in response to doxorubicin and sorafenib treatment [13] . We did not observe significant changes in TFAM expression between gemcitabine-resistant and sensitive pancreatic cancer cell lines,suggesting that TFAM level in pancreatic cancer is not regulated by prolonged treatment of gemcitabine.
A panel of pancreatic cancer cell lines with varying phenotypes and genotypes [27] demonstrate a similar expression pattern on TFAM observed in pancreatic cancer patient’s samples,suggesting that the cell lines selected in our study are representative ofinvitropancreatic cancer models. Gain-of-function and loss-offunction analysis showed the predominant role of TFAM in pancreatic cancer is in cancer cell growth,survival and chemoresistance.TFAM inhibition suppresses the viability of gemcitabine-resistant pancreatic cancer cells via suppressing growth and anchorageindependent colony formation,and induces apoptosis via impairing mitochondrial functions. Hollinshead et al. recently reported that the activity of the mitochondrial ETC is required for the proliferation of pancreatic cancer cells even in low-oxygen environments,and disrupting electron transfer efficiency specifically affects hypoxic pancreatic cancer proliferation,metabolism,andinvivotumor growth [28] . The complete disruption of mitochondrial respiration observed in TFAM-depleted cells well explains the efficacy of TFAM inhibition in resistant pancreatic cancer cells. Consistently,TFAM inhibition also significantly augments gemcitabine’s efficacy in sensitive pancreatic cancer cells. It is known that the most important mechanism of action of gemcitabine is the inhibition of DNA synthesis [29] . We speculate that the synergism between gemcitabine and TFAM inhibition is due to the suppression of independent nuclear DNA synthesis and mitochondrial function. This is supported by the findings that mitochondria can rapidly undergo dynamic changes and integrate cellular signaling pathways for cancer cells to develop drug resistance [ 30,31 ]. There is increasing evidence that targeting mitochondrial biogenesis and metabolism are alternative therapeutic strategies to overcome cancer resistance [ 32,33 ].
TFAM affects melanoma cell metabolism and may contribute to melanoma tumorigenesis by triggering a more invasive gene expression signature [34] . TFAM is less likely to contribute to pancreatic tumorigenesis as we did not observe increased anchorageindependent colony formation in normal pancreatic epithelial cells after TFAM overexpression. TFAM inhibition or overexpression did not affect pancreatic cancer cell migration either. We and others have demonstrated that TFAM is indispensable for proper mitochondrial biogenesis and function. Yang et al. reported that the enhancement of glycolysis regulates the invasion-metastasis cascade by promoting epithelial-mesenchymal transition [35] . We speculate that growth and survival largely depend on oxidative phosphorylation whereas invasion and metastasis reply on glycolysis in pancreatic cancer. Some cancer cells without mitochondrial DNA can surviveinvitroculture. Harada et al. attempted to establishρ0 cells that lack mitochondrial DNA by prolonged exposure of parental cells to ethidium bromide (EtBr) from U266B1,PCM6 and HEL 92.1.7 myeloid/erythroleukemia cells,but only HEL 92.1.7-ρ0 cells were successfully established [36] . Compared to parental tumor cells,ρ0 cells display remarkably slow growth rate and low ATP level [37] . This is consistent with our findings that TFAM inhibition results in growth inhibition and ATP reduction in pancreatic cancer cells.
TFAM truncating mutations that lead to reduced TFAM protein are found in primary sporadic colorectal cancer with microsatellite instability but not in microsatellite stable tumors,and may play an important role in cisplatin-induced apoptotic resistance via regulating mitochondrial biogenesis in microsatellite but not unstable colorectal cancer [38] . There is a well correlation of TFAM expression with mitochondrial respiration level,mtDNA copy number and ATP level in pancreatic cancer cells. Of note,PANC-1 which exhibits higher basal and maximal OCR,mtDNA and ATP than Capan-2 is more sensitive to TFAM inhibition. This suggests that pancreatic cells with increased mitochondrial biogenesis are more dependent on mitochondrial functions. Similar observations have been reported in regard to the hypersensitivity of leukemic cells but not normal hematopoietic cells to mitochondria translation inhibition because leukemic cells are more metabolically active and dependent on mitochondrial function than normal hematopoietic cells [18] . Compared to other solid tumors,the role of mitochondrial respiration in pancreatic cancer is not well understood although mitochondrially targeted agents have shown to be effective in pre-clinical pancreatic cancer models [ 39,40 ]. Our findings support the essential role of mitochondrial respiration in pancreatic cancer growth,survival and chemoresistance but not tumorigenesis and metastasis.
Collectively,our study demonstrated that TFAM was upregulated in pancreatic cancer patients and confered enhanced biological activities,via regulating mitochondrial function and biogenesis. Inhibition of TFAM effectively targeted pancreatic cancer cells and sensitized them to chemotherapy. These results suggested that inhibitors of TFAM or mitochondrial respiration may have utility in treating pancreatic cancer patients,in particular for those with high TFAM expression level.
Acknowledgments
None.
CRediT authorship contribution statement
WeiWang:Data curation,Formal analysis,Writing – original draft.Chun-FanJiang:Data curation,Formal analysis,Writing –original draft.Hai-SenYin:Methodology,Writing – original draft.ShanGao:Methodology,Writing – original draft.Bao-PingYu:Conceptualization,Funding acquisition,Supervision,Writing – review & editing.
Funding
This work was supported by the grant from Science and Technology Project of Hubei Provincial Department of Education(B2020139).
Ethical approval
All the experimental protocols were approved by the Review Board of Xiangyang Central Hospital and Renmin Hospital of Wuhan University. Informed consent was obtained from all patients for sample collection. This study does not involve human participants. The procedures were carried out in accordance with the guidelines approved by the Ethics Committees of Xiangyang Central Hospital and Renmin Hospital of Wuhan University.
Competing interest
No benefits in any form have been received or will be received from a commercial party related directly or indirectly to the subject of this article.
Supplementary materials
Supplementary material associated with this article can be found,in the online version,at doi:10.1016/j.hbpd.2023.03.006 .
 Hepatobiliary & Pancreatic Diseases International2023年5期
- Hepatobiliary & Pancreatic Diseases International的其它文章
- Right hepatectomy with a cholangiojejunostomy and hepaticojejunostomy for unilobar Caroli’s syndrome
- Total three-dimensional laparoscopic radical resection for Bismuth type IV hilar cholangiocarcinoma
- A surgical technique using the gastroepiploic vein for portal inflow restoration in living donor liver transplantation in a patient with diffuse portomesenteric thrombosis
- Full laparoscopic anatomical liver segment VII resection with preferred Glissonean pedicle and dorsal hepatic approach
- Combined hepatic segment color rendering technique improves the outcome of anatomical hepatectomy in patients with hepatocellular carcinoma
- Pathogen detection in patients with perihilar cholangiocarcinoma:Implications for targeted perioperative antibiotic therapy