Unfamiliar waveforms spanning from the ST to TP segments only observed in certain limb leads of the standard 12-lead electrocardiogram due to Aslanger’s sign
Koji Takahashi?, Nobuhisa Yamamura, Mako Yoshino, Daijiro Enomoto, Hiroe Morioka,Shigeki Uemura, Takafumi Okura, Tomoki Sakaue Shuntaro Ikeda1,
1.Department of Community Emergency Medicine, Ehime University Graduate School of Medicine, Ehime, Japan;2.Department of Cardiology, Yawatahama City General Hospital, Ehime, Japan; 3.Department of Clinical Pathology,Yawatahama City General Hospital, Ehime, Japan
Aslanger’s sign, also known as the arterial pulse tapping artifact or electromechanical association artifact, is an electrocardiographic artifact caused by arterial pulsation at the site where the limb leads of the standard 12-lead electrocardiogram near the radial or posterior tibial arteries are positioned, particularly in hyperdynamic states.[1–8]It occurs in every cardiac cycle with a constant coupling interval between the QRS complex and artifact.This synchronization with the underlying heart rhythm makes it less likely to be recognized as an artifact compared to unsynchronized artifacts, such as those caused by limb movement and inadequate contact between the electrode and skin.[1,2,7,8]Almost all reported cases of Aslanger’s sign exhibit an unusual waveform morphology in all 12 leads except one of the standard 12-lead electrocardiogram.This sign is often confused with an electrocardiographic finding commonly observed during acute coronary events, leading to unnecessary diagnostic tests, including coronary angiograms, particularly in patients with chest pain.[4]
In this report, we present an 83-year-old Japanese female who complained of anxiety-induced chest pain, which is atypical for angina pectoris, following hospitalization for an acetabular fracture.The patient’s 12-lead electrocardiogram revealed unfamiliar waveforms from the ST to TP segments, attributable to Aslanger’s sign, which were only observed in certain limb leads.The distortion of the waveform was influenced by premature atrial contraction.
An 83-year-old Japanese female was hospitalized after sustaining an acetabular fracture from a falling down.The patient had no history of smoking or alcohol consumption.Her significant medical history included long-standing hypertension, aortic valve replacement with a bioprosthetic valve for aortic regurgitation due to bicuspid aortic valve 10 years prior to admission and bilateral total hip arthroplasty for osteoarthritis.The patient was prescribed a medication regimen comprising carvedilol (2.5 mg twice daily), cilnidipine (10 mg once daily), furosemide (10 mg once daily), and vonoprazan fumarate(10 mg once daily).
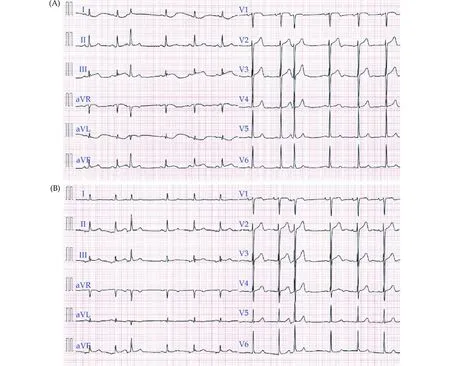
After admission, she frequently complained of anxiety-induced chest pain, which is atypical for angina pectoris.During one of these episodes, an electrocardiogram was obtained by a ward nurse (Figure 1A), and transthoracic echocardiography revealed normal left ventricular wall motion with an ejection fraction of 66%.The electrocardiographic finding was interpreted by an orthopedist as an ischemic waveform, leading to a request for cardiology consultation.
The physical examination revealed no abnormal findings, including the absence of significant heart murmurs.We considered the electrocardiographic finding to be an Aslanger’s sign.When the electrocardiogram was re-recorded with attention to the position of the limb electrodes, the distorted waveforms disappeared (Figure 1B).Blood tests ruled out hyperdynamic conditions associated with a large-volume pulse, such as hyperthyroidism, severe anemia or liver cirrhosis.This information was communicated to the patient, alleviating her anxiety and providing relief for her pain.

Figure 1 Case electrocardiograms.(A): A 12-lead electrocardiogram captured during a chest pain episode shows sinus rhythm with a heart rate of 72 beats/min and a premature atrial contraction.Unfamiliar waveforms comprising ST-segment elevation followed by a“valley” in TP segment in leads III concomitant with reciprocal ST-segment depression followed by a “hill” in TP segment in leads I and aVL are shown.ST-segment is slightly elevated in leads aVR and aVF, but leads II and V1–V6 are not involved.In addition, the distortion of the waveform following premature atrial contraction with a compensatory pause is nearly spared, but the subsequent sinus beat exhibits more pronounced distortion.(B): The 12-lead electrocardiogram taken after repositioning the limb leads shows ectopic atrial rhythm with a heart rate of 75 beats/min and a premature atrial contraction.The distorted waveforms disappeared.
We encountered a case of Aslanger’s sign displaying unusual waveforms from the ST to the TP segments only observed in certain limb leads of the standard 12-lead electrocardiogram.The source of the artifact was the left arm electrode.In the patient, the waveform distortion is most pronounced in leads I,III, and aVL.Slight effects were observed in leads aVR and aVF, whereas leads II and V1–V6 were not affected.Interestingly, the distortion of the waveform following a premature atrial contraction with a compensatory pause was relatively minimal, but that of the next sinus beat was more pronounced.This phenomenon is likely a result of beat-by-beat changes in stroke volume due to premature atrial contraction with compensatory pauses and is very likely an arterial pulse tapping artifact.Our patient did not exhibit hyperdynamic states with a largevolume pulse.We therefore hypothesized that the artifact might have been produced by an increased pulse amplitude resulting from sympathetic stimulation triggered by anxiety.[6]
Every lead in a standard 12-lead electrocardiogram represents the electrical potentials differences between two points, with one electrode serving as the exploration and the other as the reference.Bipolar limb leads (I, II, and III) also known as Willem Einthoven’s original leads compare the electrical potential differences between two of the three limb electrodes (right arm, left arm, and left leg electrodes).The augmented limb leads (aVR, aVF, and aVL),also known as Goldberger’s leads, compare the exploring electrode (one-limb electrode) to the average of the other two limb electrodes as a reference.The precordial leads V1–V6 are synthesized by calculating the electrical potential difference between each of the six chest electrodes and the virtual reference point, known as Wilson’s central terminal,which is determined by the average electrical potential measured from the three-limb electrodes.Thus, artifacts occurring in one limb lead affect two of three Willem Einthoven’s original leads, all three augmented limb leads, and all six precordial leads.Almost all publications of Aslanger’s sign have reported an unusual waveform morphology involving in 11 leads,[1–8]with only one lead displaying a normal waveform.This observation is considered a crucial sign for diagnosing Aslanger’s sign.[3,8,9]
Moreover, Aslanger’s sign is characterized by the observation that the waveform distortion is most pronounced in the limb leads where the electrical potentials of the affected electrodes, without being averaged, are used for exploration and reference.This is followed by the other limb leads and the chest leads, in descending order of the degree of distortion.[2,10]The source of the artifact in our patient was the left arm electrode because lead II remained unaffected.Thus, unfamiliar waveforms from the ST to TP segments in leads I, III, and aVL were shown,whereas there were only slight effects in leads aVR and aVF, and leads II and V1–V6 remained unaffected.Aslanger’s sign can manifest across a broad spectrum, ranging from cases that produce significant waveform changes in 11 leads to those that exhibit no or subtle involvement in all precordial leads and even some limb leads.The finding that Aslanger’s sign shows significant waveform changes in 11 leads is not absolute, especially in cases of mild disease conditions, as shown in our patient.It may be more useful to assess varying degrees of distortion between groups of leads.The large difference between the distortion of the waveform in the affected leads and the undistorted waveform in the unaffected leads may raise suspicions around this artifact.
In conclusion, we encountered a case of Aslanger’s sign with distorted waveforms in only certain limbs leads.This electrocardiographic artifact can be identified based on specific indicators, including: (1) an unfamiliar and non-physiological waveform from ST segment to TP segment, (2) varying degrees of distortion between groups of leads, and (3) premature atrial contraction, if any, affecting the distortion of the waveform.Avoiding misinterpretation requires a high level of skepticism and meticulous observation.
DISCLOSURE
Author Contributions
All authors participated in the conception, design, writing and revision of the article, and the analysis and interpretation of data.All authors approved the final version of the manuscript to be published and agreed to act as guarantors of the work.
Fundings
None.
Acknowledgements
We express our sincere gratitude to Ms.Yumie Hiraoka for her assistance in this study.We would like to thank Editage (www.editage.com) for English language editing.
Conflicts of Interests
None.
Ethics
Informed consent was obtained from the patient or his family members for publication of this case reports and associated images.This case report was writing respecting patient confidentiality and privacy.Family members of the patient had the opportunity to read the present case report and had no objections to the final abstract.
 Journal of Geriatric Cardiology2023年9期
- Journal of Geriatric Cardiology的其它文章
- Chinese guideline for lipid management (2023): a new guideline rich in domestic elements for controlling dyslipidemia
- Osimertinib induced adverse cardiac events: a case report
- Atrial fibrillation and dementia: not just a coincidence
- Predictive value of bleeding risk scores in elderly patients with atrial fibrillation and oral anticoagulation
- Association of cumulative resting heart rate exposure with rapid renal function decline: a prospective cohort study with 27,564 older adults
- App-based assessment of memory functions in patients after transfemoral aortic valve replacement
