Molecular dynamics simulations of ovalbumin adsorption at squalene/water interface
Qingxia Xiong ,Ying Ren *,Yufei Xia ,Guanghui Ma ,Reiji Noda ,Wei Ge,4,5
1 State Key Laboratory of Multiphase Complex Systems,Institute of Process Engineering,Chinese Academy of Sciences,Beijing 100190,China
2 Division of Environmental Engineering Science,Graduate School of Science and Technology,Gunma University,1-5-1 Tenjin-cho,Kiryu,Gunma 376-8515,Japan
3 State Key Laboratory of Biochemical Engineering,Institute of Process Engineering,Chinese Academy of Sciences,Beijing 100190,China
4 School of Chemical Engineering,University of Chinese Academy of Sciences,Beijing 100049,China
5 Innovation Academy for Green Manufacture,Chinese Academy of Sciences,Beijing 100190,China
Keywords:Molecular dynamics simulation Metadynamics Protein adsorption Structural stability Ovalbumin
ABSTRACT The adsorption of protein molecules to oil/water(O/W)interface is of critical importance for the product design in a wide range of technologies and industries such as biotechnology,food industry and pharmaceutical industry.In this work,with ovalbumin(OVA)as the model protein,the adsorption conformations at the O/W interface and the adsorption stability have been systematically studied via multiple simulation methods,including all-atom molecular dynamic (AAMD) simulations,coarse-grained molecular dynamic (CGMD) simulations and enhanced sampling methods.The computational results of AAMD and CGMD show that the hydrophobic tail of OVA tends to be folded under long time relaxation in aqueous phase,and multiple adsorption conformations can exist at the interface due to heterogeneous interactions raising from oil and water respectively.To further study the adsorption sites of the protein,the adsorption kinetics of OVA at the O/W interface is simulated using metadynamics method combined with CGMD simulations,and the result suggests the existence of multiple adsorption conformations of OVA at interface with the head-on conformation as the most stable one.In all,this work focuses on the adsorption behaviors of OVA at squalene/water interface,and provides a theoretical basis for further functionalization of the proteins in emulsion-based products and engineering.
1.Introduction
The adsorption of proteins to the oil/water(O/W)interface is of great significance in many industrial processes in a broad range of research fields such as interfacial engineering,biotechnology,food industry and pharmaceutical industry.Especially,in the development of functional emulsion-based food and pharmaceutical products,protein adsorption is a desirable feature that enhances the end products.In food industry,emulsion products obtain good stability against coalescence and disproportionation through proteins being adsorbed to O/W interface[1-3].In pharmaceutical industry,many key processes,including purification,transportation,storage and in vivo delivery of the drugs,involve protein adsorption or desorption at the O/W interface [4-6].With all these applications,exploring the underlying mechanisms of the conformational changes of proteins as they are adsorbed to O/W interface is crucial for controlling the adsorption stability of proteins,which is obviously essential for the functionalities of the emulsion-based products.
Computer simulations,especially molecular dynamics (MD)simulations,have played increasingly important roles in the studies of interfacial adsorption because of their capability to provide the details and dominant mechanisms at atomic level which are difficult to obtain through current experimental facilities.Depending on the resolutions of the molecular models,MD simulations can be further classified into all-atom molecular dynamics(AAMD)simulations and coarse-grained molecular dynamics (CGMD) simulations.AAMD serves as an important computational microscope to explore the dynamic structures of protein molecules,the interfacial structure and adsorption stability with atomic resolution[7-11].Among them,the investigations of β-lactoglobulin adsorbed at O/W interface suggested that the hydrophilicity of the oil molecules and the interfacial tension of the O/W interface were the key factors for structural changes of the protein molecule,and proteins experienced more conformational changes upon adsorption to hydrophobic surfaces since they exposed more hydrophobic interior residues to the surface [12].Besides,AAMD simulations were also performed on two proteins with similar structures,namely,lysozyme and α-lactalbumin,adsorbed at water-octane interface,and the work identified several non-specific adsorption conformations for lysozyme while a specific orientation for αlactalbumin[13].With AAMD simulations,the adsorption behavior of a model protein at the O/W interface was also carried out in detail and the analysis showed that noncovalent interactions between the subunits of the protein conducted the tangential force which maintained the integrity of the structure [14].Despite the advance of AAMD method in investigating the structural change of protein molecules with atomic details,the high computational cost and thus limited spatio-temporal power (normally within 10 nm and 100 ns) remain a bottleneck for investigating complex biological phenomena,and CGMD is thus developed to overcome this dilemma.Through a CG mapping of the molecular topology,the number of beads in the simulated system can be significantly reduced with much larger time step.A common used CG model for biosystems is the MARTINI model [15-17],which has been widely used in investigations of the allosteric effect of protein molecules and the interfacial dynamics in multiphase systems[18].For example,the adsorption behavior and structural changes of fungal hydrophobin proteins at different oil/seawater interfaces were investigated in detail using MARTINI force field,and the results implied that compared to then-decane/seawater systems,the proteins at the benzene/seawater interface exhibited deeper free energy minima and also with smaller interface tensions [19].Another approach to further extend the sampling timescales is enhanced sampling algorithms,such as metadynamics [20-22]and umbrella sampling[23,24],which are normally combined with MD simulations to accelerate the exploration of different states in complicated and time-consuming adsorption processes.The interactions between protein Gb1 and five mineral surfaces were unveiled by metadynamics method,with the observation that the protein structure was greatly affected by birnessite surface which was caused by the specific vulnerable interaction site for oxidation or hydrolysis judged from free energy of binding [25].Combined CGMD with umbrella sampling,the free energy landscape of protein BslA adsorbed at the O/W interface was successfully reconstructed,with the conclusion of an end-on orientation of BslA as the most stable structure at the interface [26].In all,MD simulations,including AAMD and CGMD,combined with enhanced sampling methods,provide valuable insights into protein adsorption at O/W interface.
For consideration of the model protein,Ovalbumin(OVA)is the mainly abundant protein component in egg white with the functionality such as gelation,formability and emulsibility [27-34].Due to its high bioactivity,easy manipulation and low costs,OVA is also one of the representative model proteins used in food research and biochemistry studies[35-40].Generally,many experiments or functionalization of OVA,including emulsification,encapsulation,immunization,etc,involve the adsorption onto an O/W interface[41-44].However,currently,most researches in this field focus on experimental studies of the functionalization and applications of OVA,whereas the underlying mechanism at molecular scale is still ambiguous.Consequently,the computational study on the adsorption behavior of OVA at the O/W interface with the microscopic details is of critical importance.
In this work,multiple molecular simulation methods,including AAMD,CGMD and enhanced sampling methods,were utilized to study the adsorption stability of OVA at squalene/water interface.The paper is organized as follows:the structure of OVA in aqueous solution is first performed with both AAMD and CGMD to obtain the stable structure which is further utilized as the initial conformation for the adsorption study;then,using the stable structure of OVA in aqueous solution with three different orientations relative to the interface as initial structures,AAMD and CGMD simulations are carried out to investigate the adsorption kinetics respectively to validate the accuracy of the CG model;finally,to find the optimal adsorption conformations and obtain more insights of adsorption stability,CGMD simulations combined with metadynamics method are carried out,with comparisons of different adsorption structures compared with the results obtained from straightforward MD simulation.
2.Methods
2.1.General details of simulations
The initial coordinates of OVA were obtained from the trimer(PDB code:6KGA)with the missing atoms added.In total,the protein contained 387 residues with 21 negative charges and 21Na+were added as counterions to neutralize the system.As shown in Fig.1(a),the initial structure of OVA was presented with AA and MARTINI CG model respectively.In the AA model,the protein was mainly composed of α-helices,β-sheets,turns and coils,colored in purple,yellow,cyan and white respectively.To facilitate the description of structural changes during the simulation,residues 1-354 and 355-387 were referred as body and tail of OVA respectively.Besides,angle θ was defined as the angle formed by the center of mass (COM) of body,the α-carbon atom of residue 355 and the COM of tail,and the change of θ can be used to describe structural changes of OVA in the latter simulations.
In this work,both AAMD simulations and CGMD simulations were conducted and compared to investigate the conformations of OVA in aqueous solution and at the O/W interface,respectively.Squalene was chosen as the oil phase according to the experiments in Xia’s work[45].For the O/W system,three representative orientations of OVA relative to the interface,namely,tail-on,head-on and body-on,were chosen as the initial structures to study the adsorption kinetics and the corresponding adsorption conformations.Finally,to further investigate the possible adsorption conformations of OVA at O/W interface,CGMD simulation was implemented combined with metadynamics to enhance sampling efficiency and save computational cost.Details of the compositions in all the simulations were listed in Table 1.

Table 1 Numbers of atoms in AAMD and beads in CGMD for all the simulations in this work
All of the simulations and analysis of the trajectories were performed with GROMACS (version 5.0.7) software package [46].Structures were visualized using VMD software[47].All of the simulation systems were carried out at a constant temperature of 298 K using a v-rescale thermostat [48] and a constant pressure of 0.1 MPa using the ParrinelloRahman barostat [49].The Particle-mesh Ewald method [50] was used to calculate the electrostatic interactions.LINICS [51] algorithm was applied to constrain the bond lengths for molecules.A cutoff distance of 1.4 nm was set to calculate the non-bonded interaction.Before the production run in the NPT ensemble,each system was subjected to the steepest-descent energy minimization and then preequilibrated with position restraints of the proteins’ heavy atoms.All simulations were performed on the CPU/GPU hybrid supercomputer Mole-8.5E [52].
2.2.Molecular dynamics simulations
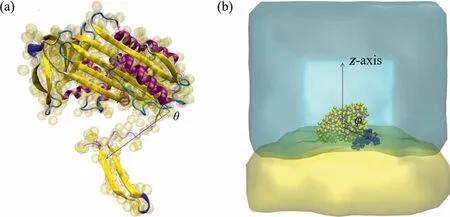
Fig.1.(a)Schematic show of the AA and CG models of OVA indicated in NewCartoon and VDW mode respectively.(b)Snapshot of the initial configuration of the system for enhanced sampling simulation.Water and oil molecules were displayed in cyan and yellow respectively and ions were not shown for clarify.OVA was represented in VDW mode colored by name with tail in blue according to MARTINI CG scheme.
For the simulations of aqueous system,OVA was initially placed at the center of a cubic box with the dimension of 14.0 nm and further dissolved in water with periodic boundaries.As for the O/W system,the equilibrium structure of OVA in aqueous solution was placed in the aqueous phase meanwhile near the interface with three different orientations (tail-on,head-on and body-on),resulting in three O/W simulated systems with the dimension of 14.0 nm inXandYdirections while about 15 nm inZdirection(10 nm for aqueous phase and 5 nm for oil phase respectively).All these systems were subjected to AAMD and CGMD simulations for comparison of the results and validation of the accuracy of the models with different spatio-temporal resolutions.
AAMD simulations were performed using GROMOS96 43a1 force field and SPC/E model was chosen to mimick water molecules.The force field parameters of squalene were obtained from the Automated Topology Builder (ATB molid: 21863).For each AAMD simulation,the time step was set to 2 fs.In the aqueous system,the box was periodic in three dimensions and the system was subjected to a production run of 200 ns without any restraints.In the O/W systems,two walls with the types of oxygen atom in water and carbon atom in oil were set at the top and bottom of z-axis respectively,and in the x and y directions periodic boundary conditions were employed and then each production run was performed for 100 ns.
In CGMD simulations,the CG structure of OVA was directly converted from the AA model of the crystalline structure.CGMD simulations were performed using MARTINI force field based on a four-to-one topology mapping strategy,and the force field parameters for squalene molecules was the same as Antunes’s work[53].In the aqueous system,the box was periodic in three dimensions while in O/W system,two walls were set along z-axis using C3 and P4 beads to refer as oil phase and aqueous phase on the bottom and top respectively and the other two directions were set periodic.For each CGMD simulation,the time step was set to 20 fs and each system was subjected to run for 500 ns.Depending on the forcefield parameters,C and N beads are set as hydrophobic beads and Q and P beads are regarded as hydrophilic beads respectively,which are further utilized in the calculation of hydrophobic/hydrophilic solvent accessible area of OVA.
2.3.Enhanced sampling
To further explore the configurations that protein adsorbed at the interface,metadynamics combined with CGMD simulations were performed to calculate the free-energy profile with plumed v2.1 plug-in [54,55].Using the stable tail-on configuration obtained from CGMD simulations as the initial structure,the model of the simulated system was constructed as presented in Fig.1(b).The angle φ formed between the unit vector along the z-axis and the vector connecting the COM of body and COM of tail was probed as the collective variable (CV) which ranges from 0° to 180°.The Gaussian width was set as 0.05 with a height of 0.5 kJ.Gaussian functions were added every 500 steps and the value of the CVs along with the current value of the metadynamics bias potential were printed every 5000 steps of simulation.The time step was set to 20 fs with a production run of 1000 ns.Other details of the CGMD simulations were the same as introduced in CGMD simulations of the O/W system in Sections 2.1 and 2.2.
3.Results and Discussion
3.1.Equilibrium structure of OVA in aqueous solution
To unravel the structural changes of OVA in aqueous solution starting from the crystal structure,the time evolution of the root-mean-square deviation(RMSD)of the backbone of the protein molecule obtained in both AAMD and CGMD simulations is calculated as depicted in Fig.2.In the AAMD profile,the RMSD steeply increases up to~1.05 nm in the initial 5 ns,then continues to rise up to~1.25 nm in the next 45 ns and finally stabilizes till the end of the simulation.For CGMD,a quick increase to~0.68 nm in the initial 10 ns is observed followed by a slow climb during 10-200 ns and finally the RMSD becomes stable at the value of~0.86 nm.The RMSD profiles suggests that OVA undergoes dramatic conformational changes when the crystal structure is dissolved in water,and the structure becomes stable during the latter half of the simulation time,indicating that the 200 ns for AAMD and 500 ns for CGMD is reasonable.During the simulations,a RMSD difference of about 0.4 nm is observed between the backbone structures of OVA in aqueous solution obtained from AAMD and CGMD simulations,suggesting the difference mainly arises from the CG topology and forcefield parameters.
The evolution of angle θ,formed by the COM of body,the αcarbon atom of residue 355 and COM of tail,is shown in Fig.3,with the representative structures of OVA provided in the insets.In AAMD displayed in Fig.3(a),θ rapidly increases from 96° to 146°in the initial 5 ns,corresponding to the structural extension from conformation a to b which agrees with the sharp increase of the corresponding RMSD profile in Fig.2.Then,θ decreases to 97°during 5-50 ns interval,corresponding to the retraction of tail from conformation b to c which is also in accord with the further rise mentioned in the RMSD profiles.For the later simulation,θ continues to experience large fluctuations to further adjust the structure(conformation d),and finally,θ becomes stable around 85° from 95 ns to the end of the simulation (conformation e).For CGMD,as shown in Fig.3(b),the tail retracts quickly within the starting 50 ns with θ decreases directly from 96° to 37°,corresponding to the transition from conformation a to b with the folding of tail.Then,it continues to change with large fluctuations which is consistent with the RMSD profile in the starting 200 ns.Finally,θ stabilizes around 60° during the remaining simulation.As displayed in Fig.1(a),the tail of OVA is composed of a double stranded antiparallel β-sheet and a long coil which is easy to swing.As described in the analysis of OVA structure,most of the residues in the tail part are hydrophobic [56].Once the crystal structure of OVA is dissolved in aqueous solution,it is reasonable that the tail will retract to the body so as to decrease the unfavorable hydrophobic interactions raised from the β-sheet.In all,both AAMD and CGMD simulations suggest that the retraction of the extended tail fragment to the body is critical for the formation of a more compact structure of OVA in aqueous solution compared to the initial crystal structure.The movies recording the retraction process obtained from AAMD and CGMD simulations respectively are also given in the Supporting Information.
Since the results above indicate the structures become stable during the latter half of the simulation time,the last 100 ns trajectory of AAMD simulations and the last 200 ns trajectory of CGMD simulations are collected and analyzed to obtain the stable properties of OVA in aqueous solution consequently.As illustrated in Fig.4,the distribution of the stable angle θ obtained from AAMD and CGMD simulations is presented.The profiles of θ obtained from AAMD mainly locate between 75° and 95°,with a peak around 84°;whereas the θ values obtained from CGMD mainly locate between 50° and 70°,with a peak around 59°.These results are consistent with the profiles of θ after OVA reaches the stable state as shown in Fig.3.In both simulations,the distributions of θ span about 20°,suggesting similar degrees of contraction of tail to body in OVA,though the exact value of θ obtained from CGMD simulation is 25°smaller compared with that obtained from AAMD simulation,probably due to the CG methodology of the atoms in OVA which may result in different spatial coordinates of the residues.In CG model built from MARTINI force field based on a four-to-one topology mapping strategy,the remarkable feature is that protein molecules have quite complex side chains,but the backbone considered as CG beads is very simple[15].Correspondingly,atomic details with the simplified description in MARTINI model cannot be accurately reproduced compared to atomistic models,but the movement of secondary structure elements with respect to each other is possible [16,17],leading to the acceptable difference of θ between two models.
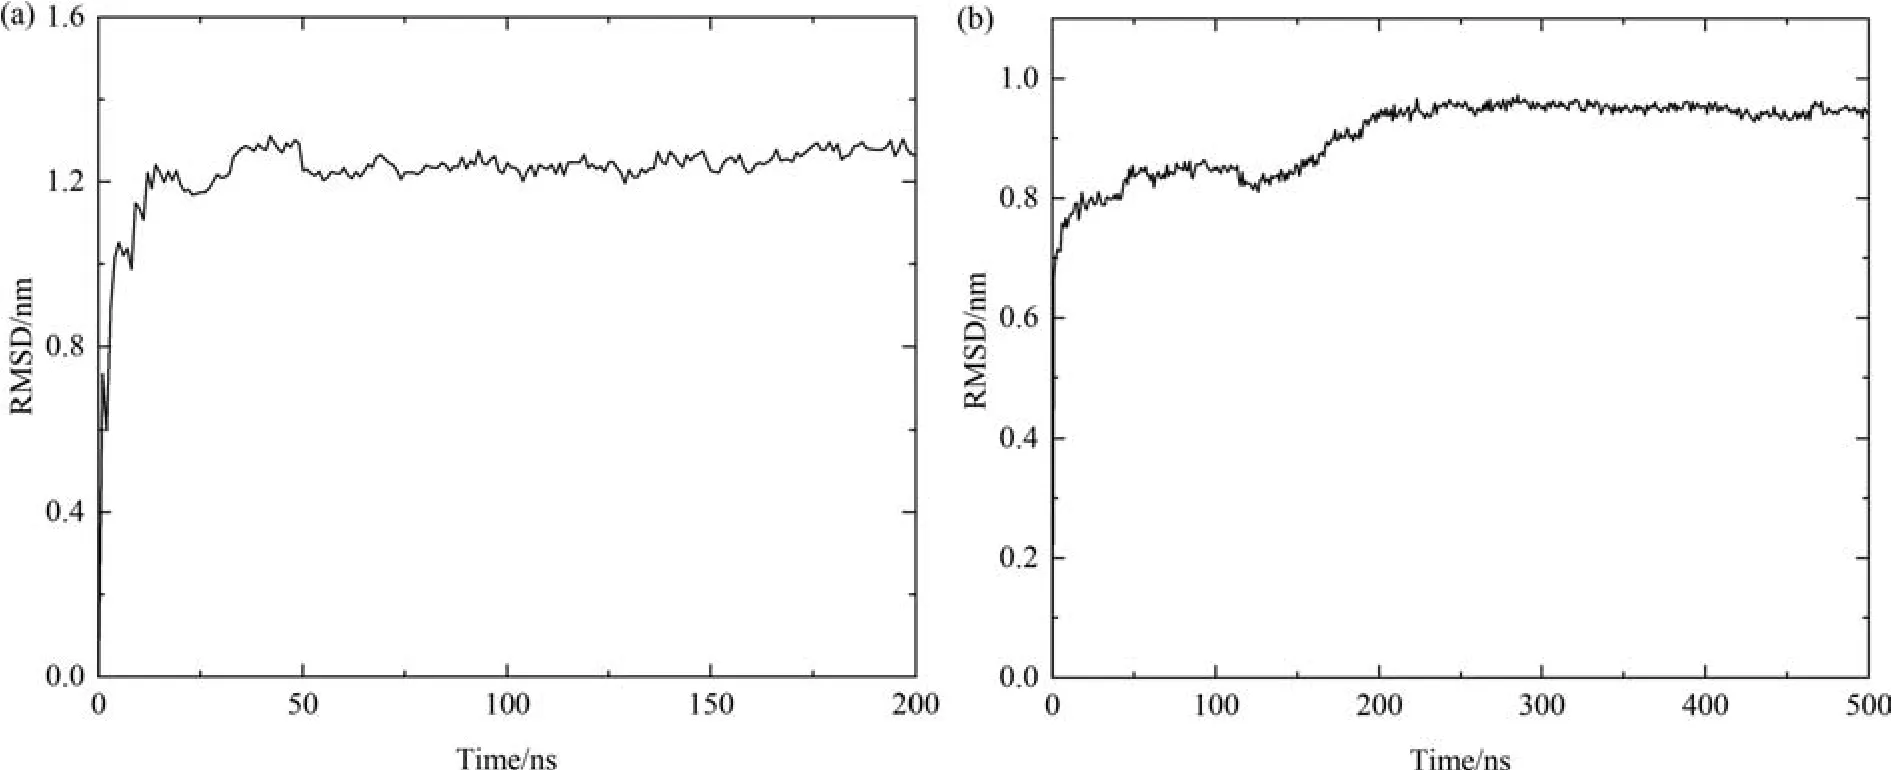
Fig.2.RMSD of OVA as a function of simulation time in AAMD (a) and CGMD (b).
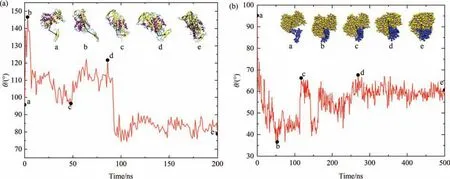
Fig.3.Change of angle θ as a function of time in(a)AAMD and(b)CGMD.The insets display the corresponding snapshots of OVA during the simulation.Color schemes of OVA structures in (a) and (b) are the same as in Fig.1(a) and Fig.1(b) respectively.
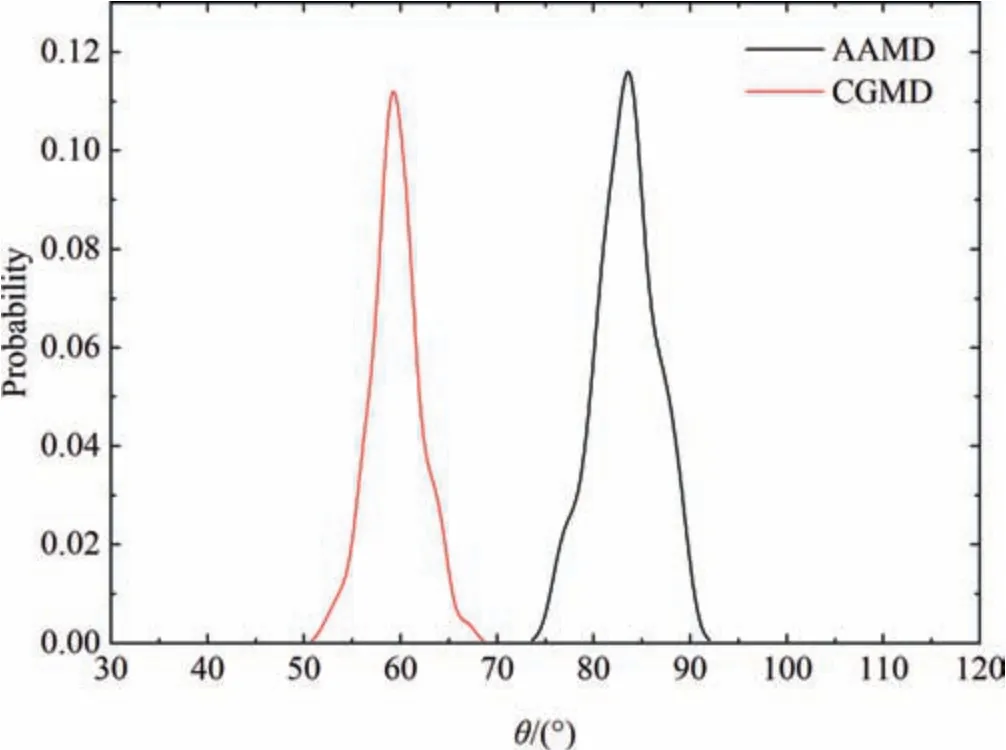
Fig.4.Probability distribution of the stable angle θ for the stable OVA structures obtained from AAMD (black) and CGMD (red) respectively.
The allosteric process of OVA in aqueous solution is basically caused by its interactions with the surrounding polar water molecules.Therefore,the changes of hydrophilic area (SHL) and hydrophobic area (SHB) of the protein in water during the simulation are also considered to manifest the conformational changes.As shown in Fig.5,in both AAMD and CGMD profiles,SHLis larger thanSHB,indicating that OVA is more hydrophilic which is consistent with the previous experiments[45].As illustrated in Fig.5(a),in AAMD,within the initial 5 ns,SHLdecreases steeply from the initial value of 114 nm2to about 98 nm2,and in the meanwhile,SHBreduces from the initial value of 98 nm2to about 79 nm2.Then,during 5-50 ns intervalSHLandSHBfurther descend to about 95 nm2and 65 nm2respectively which stabilize till the end of the simulation.The results suggest the dissolution process of protein in water results in a decrease of 20 nm2forSHLand 30 nm2forSHBcompared to the initial crystalline structure.For CGMD simulation as described in Fig.5(b),within the first 20 ns,SHLdecreases from 143 nm2to about 110 nm2and then undergoes a slow descend to about 103 nm2during 20-200 ns and finally fluctuates till the end of the simulation.ForSHB,the results are slightly different.It increases rapidly from 62 to 77 nm2within the first 5 ns which can be caused by the structural adjustment of OVA when the crystal structure just dissolves in aqueous phase as there are less constraint calculations in the MARTINI CG model compared with AA model.Then,it decreases rapidly to about 57 nm2during 5-20 ns and finally fluctuates around 40 nm2till the end of the simulation,resulting in a reduction of 40 nm2and 22 nm2forSHLandSHBrespectively.Generally speaking,both of the hydrophilic and hydrophobic area decrease due to the dissolution of OVA in aqueous solution which is consistent with the tendency of the profiles of RMSD and angle θ.
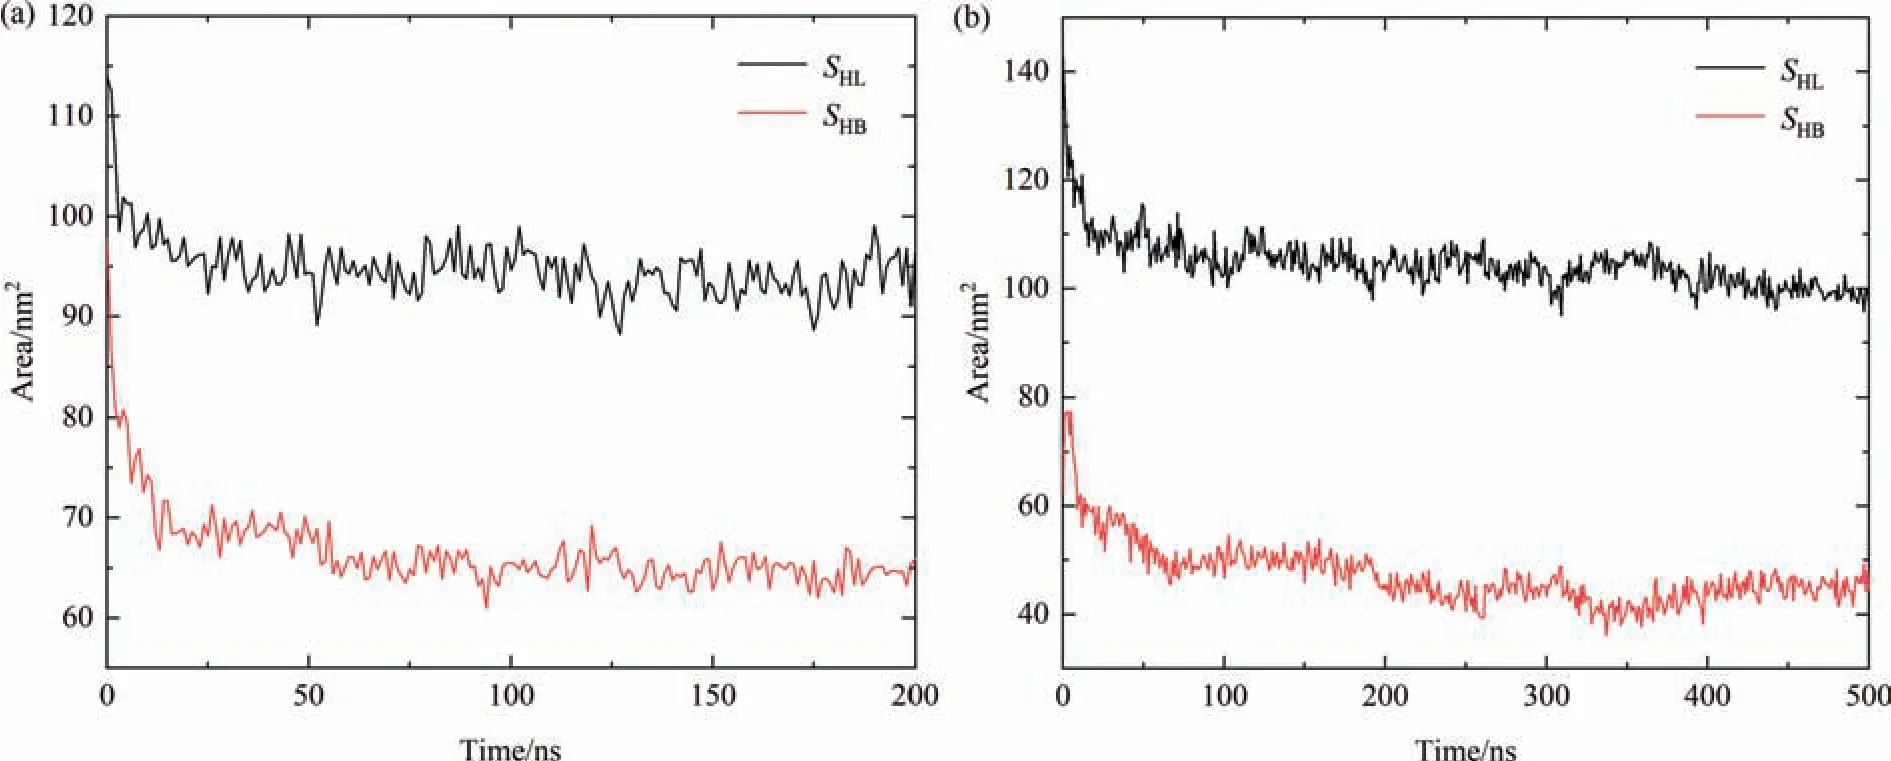
Fig.5.Evolution of hydrophilic and hydrophobic area of OVA over the simulation in both (a) AAMD and (b) CGMD simulations.
3.2.Adsorption structure of OVA at O/W interface
In contrast to the aqueous systems,the O/W system may provide more conformational flexibility to the protein molecule due to the heterogeneous interactions raised between OVA and the biphase solution.The analysis of OVA in aqueous solution suggests significant hydrophobic surface area (Fig.5).Therefore,three representative initial orientations are chosen to investigate the adsorption conformations of OVA at squalene-water interface via AAMD and CGMD simulations respectively,and their results are compared to further validate the accuracy of the force fields.
As shown in Table 2,the tail-on and body-on initial orientations result in similar stable adsorption conformations with the tail sticking to the interface meanwhile a bundle of β-sheets in the body lying at the interface,indicating that the hydrophobic interaction raised from the tail and β-sheets of the body of OVA provides the main driving force.With the head-on initial orientation of OVA,a stable adsorption conformation with the head and the body of OVA dissolved in water while the head with a bundle of β-sheets sticking to the interface can be obtained,which is consistent with the results of structural analysis that there are also hydrophbic regions in the body[56].This conformation is quite different from the one obtained from the tail-on and body-on simulations,suggesting the existence of multiple stable adsorption conformations of OVA at squalene/water interface.Notably,for all the three initial orientations,CGMD and AAMD simulations obtain consistent stable structures of OVA at O/W interface,which validated the accuracy of CG model.
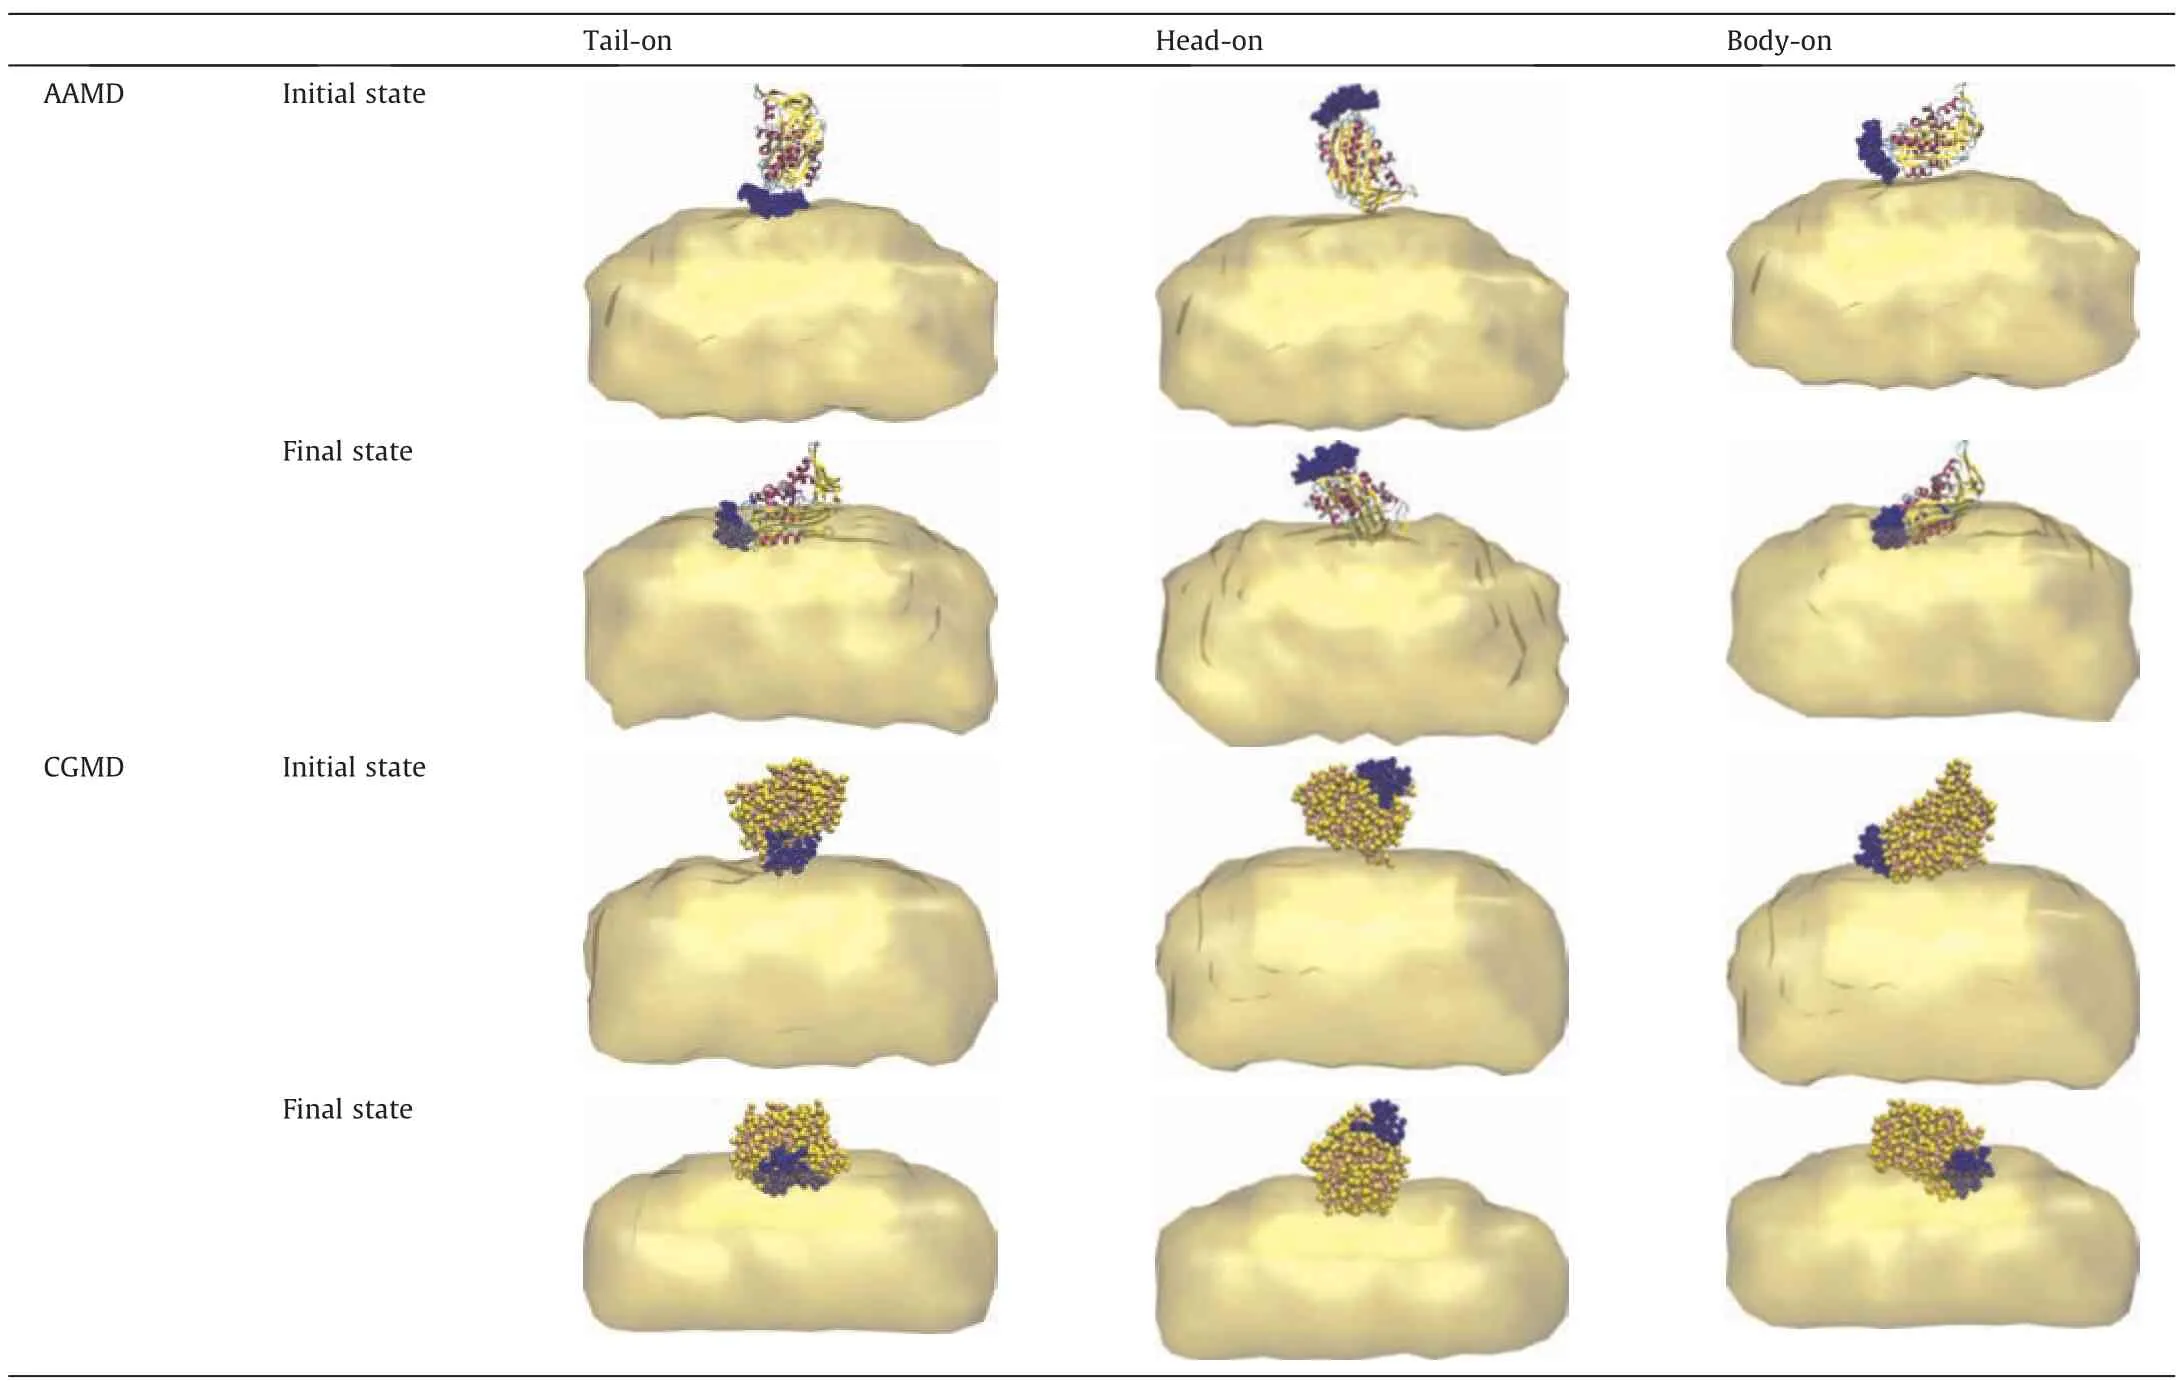
Table 2 Snapshots of OVA with different initial orientations.Coloring scheme is the same as Fig.1 with tail of OVA in blue.Water is not shown for clarify
Also,the stable adsorption conformations of OVA can be further characterized through the contact between the protein molecule and the solvent.Here,a contact is considered when any protein atom is located within 0.5 nm of the squalene molecules.As illustrated in Fig.6(a),in AAMD simulations,within the initial 20 ns,the contact number of protein atoms (Nc) increases from 0 to 646,382 and 163 in the body-on,tail-on and head-on simulated systems respectively,and then further rise up to about 750,630 and 250 during 20-50 ns and stabilizes until the end of the simulation with small fluctuations.The situations for CGMD are similar as shown in Fig.6(b).In tail-on system,Ncrapidly reaches 68 within the first 50 ns and fluctuates around 70 till the end of simulation.In body-on system,it quickly increases to 44 in the initial 50 ns,and then experiences a further rise to about 60 with significant fluctuations.In the head-on system,Ncincreases rapidly from 0 to 30 in the first 40 ns and then remains stable during the simulation with small fluctuations.Due to the coarse grained treatment of the molecules,the values ofNcobtained in CGMD are about an order of magnitude lower than those obtained in AAMD,however,similar properties can be identified from these plots.Consistent results ofNccan be obtained from the AAMD and CGMD simulations with tail-on and body-on initial conformations respectively,which are two to three times larger than the values obtained from the simulations with head-on initial conformations,implying the head-on adsorption conformation of OVA has less interaction with the oil phase compared with the tail-on adsorption conformation.
Fig.7 describes the time evolution of the interaction energies between protein and oil (EPO) during the 100 ns AAMD and500 ns CGMD simulations for the tail-on system,and theEPOcurves of head-on and body-on simulations are displayed in Fig.S1 and S2(Supplementary Material).In all of AAMD and CGMD simulations,effective adsorption results in a significant decrease inEPO,indicating that protein adsorption to the O/W interface with different adsorption conformations will result in different values of interaction energy.Notably,the curves ofEPOin different systems are in accordance with that ofNc.For example,in tail-on system of AAMD as illustrated in Fig.7,the energy curve undergoes a sharp decrease from -218 kJ·mol-1to~1730 kJ·mol-1within the starting 20 ns and then further declines to -2100 kJ·mol-1in 20-50 ns which remains stable afterwards.For CGMD,a rapid decrease ofEPOfrom-1160 kJ·mol-1to-3000 kJ·mol-1appears within the initial 20 ns and remains stable in the later simulation.The two stages ofEPOprofiles agree with the two stages ofNcprofiles (Fig.6),indicating the contacts between the hydrophobic residues of OVA and squalene are energetically favorable and thus provide the main driving force of OVA adsorption at the squalene/water interface.
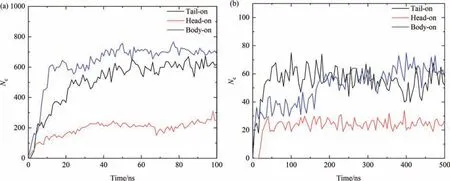
Fig.6.Time evolution of the number of contacts during (a) AAMD and (b) CGMD simulations.
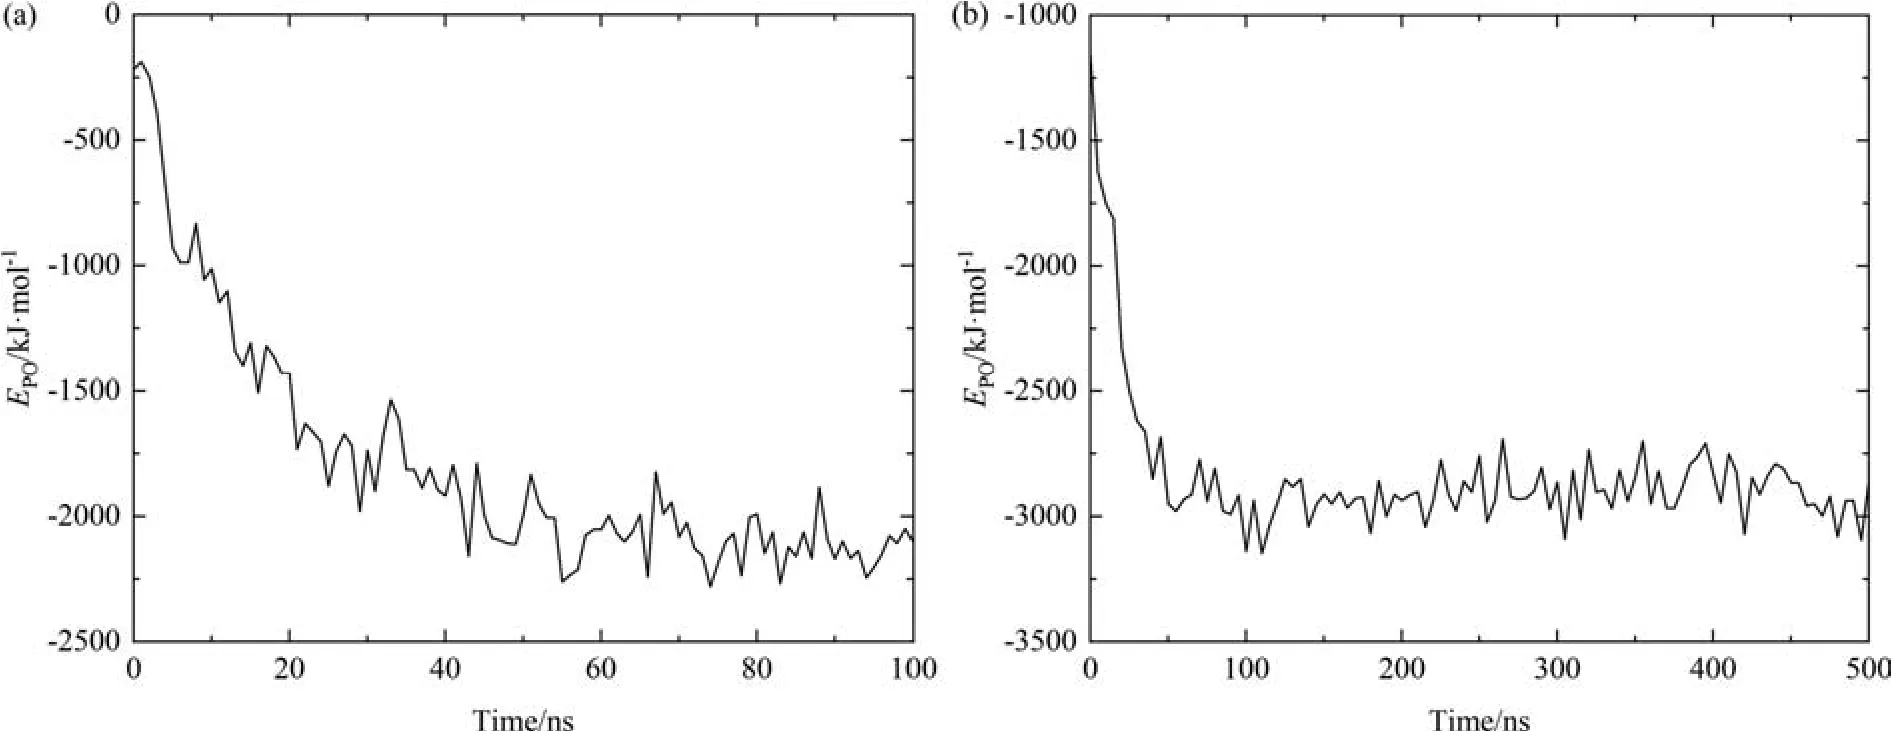
Fig.7.Interaction energies between protein and oil over time for tail-on system in (a) AAMD and (b) CGMD simulations.
The conformational evolution of OVA during the adsorption process is also plotted in Fig.8 by monitoring the change of angle θ.In the tail-on simulations,the value of θ obtained from AAMD fluctuates around 90° within a narrow range of 10° whereas in CGMD,it undergoes a rapid reduction from 80° to 40° in the first 50 ns and then remains stable thereafter,which is consistent with the results shown in Fig.6 and Fig.7.On the other hand,the evolution of θ obtained from CGMD shows more fluctuations than AAMD,possibly due to the CG model with less topological constraints within the protein molecule and thus more structural flexibility compared with the delicate AA model.Likewise,the results for head-on and body-on systems are also similar with the tail-on simulations as depicted Fig.S3 and S4.
3.3.Free energy profile of OVA at O/W interface
To examine all the possible adsorption conformations of OVA and further identify the most stable one,the metadynamics enhanced sampling method combined with CGMD is employed for free energy calculationsviamonitoring the angle φ during the 1000 ns sampling (see Fig.9).The curve oscillates multiple times between 0° and 180°,implying the sampling is sufficient.
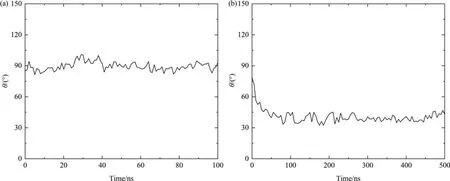
Fig.8.Change of angle θ as a function of time in (a) AAMD and (b) CGMD for tail-on simulations.
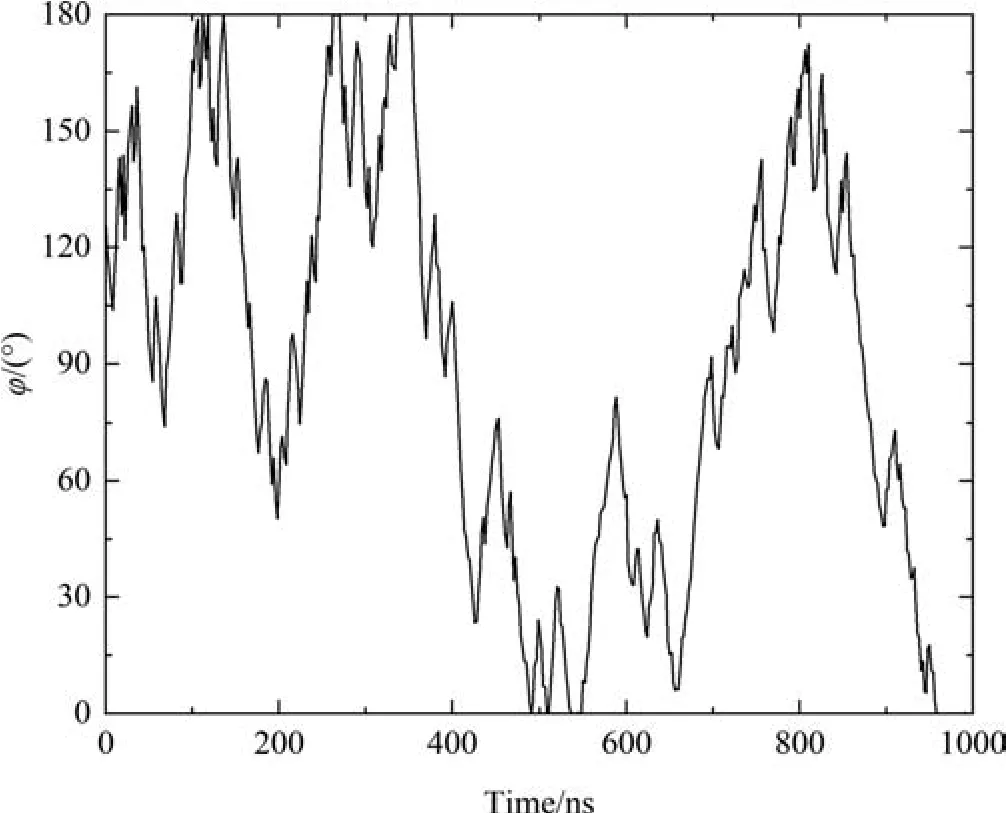
Fig.9.Time evolution of the angle φ formed between the unit vector along the z-axis and the vector connecting the COM of body and the COM of tail.
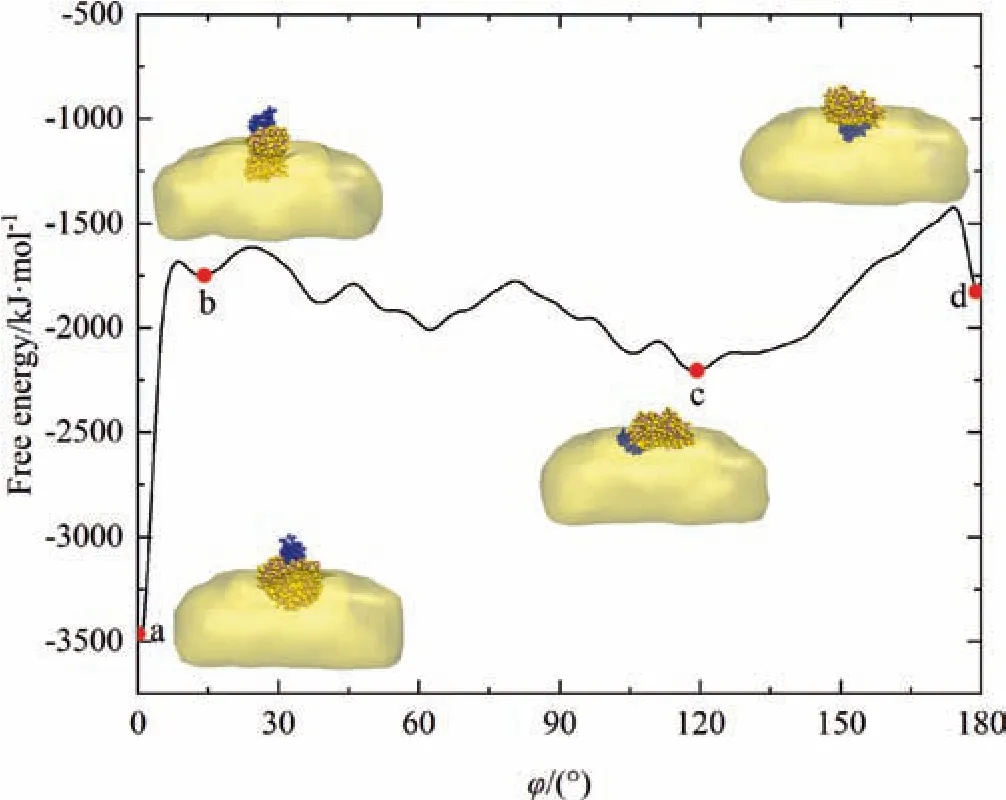
Fig.10.Free energy curve as a function of angle φ with the insets indicating the corresponding structures of OVA at interface.Color scheme is the same as Table 2.
Fig.10 depicts the free energy landscape over angle φ and it clearly points out that there are multiple local minima with different adsorption conformations of OVA at the O/W interface.The most stable adsorption conformation of OVA (state a in Fig.10),that is,the one resulting in the global minimum value in the free energy curve,is the head-on conformation with the lowest energy of -3463 kJ·mol-1when angle φ is 0°.In addition,several metastable structures,such as b,c,and d with energies of-1749 kJ·mol-1,-2204 kJ·mol-1and -1827 kJ·mol-1with φ values of 13°,119° and 179° respectively,are also identified through enhanced sampling calculations.Notably,both a and b states are head-on conformations corresponding to the lowest and highest local minimum respectively which suggests there are several adsorption conformations for head adsorption alone while c and d states correspond to body-on and tail-on adsorption conformations respectively.The free energy curve also suggests that the energetic barriers between the metastable states are comparatively shallow thus can be easily overcome by kinetic perturbations in the O/W system.Meanwhile,the most stable state (state a)locates in a deep basin with globally minimum free energy,and should be quite kinetically stable due to the difficulty to jump over the energetic barrier.However,in the AAMD and CGMD simulations starting from tail-on,head-on and body-on conformations of OVA respectively,only neighboring metastable states can be accessible to the simulated system due to the limited sampling power,and thus the results obtained from AAMD and CGMD simulations can only be viewed as the local optimum adsorption conformations of OVA at O/W interface.Considering the spatiotemporal scale during the preparation and storage of emulsionbased products including some engineering approaches such as stirring,ultrasound and refrigeration [57-60],it is reasonable to deduce that state a is more likely to be existed as the stable conformation of OVA at squalene/water interface.
4.Conclusions
In this paper,the intrinsic mechanism of adsorption behaviors of OVA at the interface between squalene and water is investigated in detailviamultiple simulation methods.Our observations can be summarized as follows:(1)The results from CGMD simulations are similar with AAMD which proves the reliability of MARTINI CG model with great improvement of the computing speed.(2)In traditional MD,it is very easy for the system to fall into a local minimum,so the final conformation is only the optimal structure within a limited spatio-temporal scale,while enhanced sampling calculations can overcome this dilemma,which is,it helps the system escape from the local minima and obtain the global optimal structure.(3) The observance of several local minima on the free energy curve is consistent with the stable adsorption conformations of OVA obtained by traditional MD starting from different initial orientations.(4) The heterogeneous environment of the biphase system at the squalene/water interface significantly affects the steady configuration of protein,which is also the main reason for the existence of multiple characteristic adsorption conformations of protein at the interface.The structural changes of proteins in emulsion-based products and process have always been a focus of attention in the scientific community and some of them are still difficult to measure due to the limitations of experimental methods.This study provides a microscopic insight of the adsorption process of OVA at O/W interface and paves the way for the functional design of emulsion-based products with proteins at O/W interface which widely exists in biochemistry and bio-industry.Further research should be extended to the structural change of protein molecules under more complex environments which offers more underlying mechanisms for the accurate manipulation of their properties in biochemistry fields.
Declaration of Competing Interest
The authors declare that they have no known competing financial interests or personal relationships that could have appeared to influence the work reported in this paper.
Acknowledgements
This work was financially supported by the National Natural Science Foundation of China (Nos.21821005,21973097,92034302 and 91834303),the Innovation Academy for Green Manufacture,Chinese Academy of Sciences (IAGM-2019-A03 and IAGM-2019-A13) and Key Research Program of Frontier Science,Chinese Academy of Sciences (QYZDJ-SSW-JSC029).We also acknowledge the computational resources provided by HPC Cluster of Mole-8.5E at Institute of Process Engineering,Chinese Academy of Sciences.
Supplementary Material
Supplementary data to this article can be found online at https://doi.org/10.1016/j.cjche.2022.06.014.
 Chinese Journal of Chemical Engineering2022年10期
- Chinese Journal of Chemical Engineering的其它文章
- Enhance hydrates formation with stainless steel fiber for high capacity methane storage
- Understanding the effects of electrode meso-macropore structure and solvent polarity on electric double layer capacitors based on a continuum model
- Refrigeration system synthesis based on de-redundant model by particle swarm optimization algorithm
- Adaptive multiscale convolutional neural network model for chemical process fault diagnosis
- Injectable self-healing nanocellulose hydrogels crosslinked by aluminum: Cellulose nanocrystals vs.cellulose nanofibrils
- Establishment of nucleation and growth model of silica nanostructured particles and comparison with experimental data
