
Correlation between imaging features on computed tomography and combined positive score of PD-L1 expression in patients with gastric cancer
2022-11-15 03:12:58ZhilongWangYinkuiWangXiaotingLiYanlingLiZhaodeBuZhongwuLiYingshiSunJiafuJi
Zhilong Wang ,Yinkui Wang ,Xiaoting Li ,Yanling Li ,Zhaode Bu ,Zhongwu Li ,Yingshi Sun,Jiafu Ji
Key Laboratory of Carcinogenesis and Translational Research (Ministry of Education/Beijing),1 Department of Radiology;2 Center of Gastrointestinal Surgery;3Department of Pathology,Peking University Cancer Hospital&Institute,Beijing 100142,China
Abstract Objective:To explore the correlation between computed tomography (CT) features and combined positive score (CPS) of programmed cell death ligand 1 (PD-L1) expression in patients with gastric cancer (GC).Methods:This study reviewed an institutional database of patients who underwent GC operation without neoadjuvant chemotherapy between December 2019 and September 2020.The CPS results of PD-L1 expression of postoperative histological examination were recorded by pathology.Baseline CT features were measured,and their correlation with CPS 5 or 10 score groups of PD-L1 expression was analyzed.Results:Data for 153 patients with GC were collected.Among them,124 were advanced GC patients,and 29 were early GC patients.None of the CT features significantly differed between CPS groups with a cutoff score of 5 and a score of 10 in patients with early GC.In advanced GC,the presence of lymph nodes with short diameters >10 mm was significantly different (P=0.024) between the CPS<5 and CPS≥5 groups.CT features such as tumor attenuation in the arterial phase,long and short diameter of the largest lymph node,the sum of long diameter of the two largest lymph nodes,the sum of short diameter of the two largest lymph nodes,and the presence of lymph nodes with short diameters >10 mm significantly differed between the CPS<10 and CPS≥10 groups in advanced GC.The sensitivity,specificity and area under receiver operating characteristic (ROC) curve of logistic regression model for predicting CPS≥10 was 71.7%,50.0% and 0.671,respectively.Microsatellite instability (MSI) status was significantly different in CPS groups with cutoff score of 5 and 10 in advanced GC patients.Conclusions:CT findings of advanced GC patients with CPS≥10 showed greater arterial phase enhancement and larger lymph nodes.CT has the potential to help screen patients suitable for immunotherapy.
Keywords: Gastric cancer;computed tomography;combined positive score
Introduction
Gastric cancer (GC),including gastroesophageal junction cancer (GEJC),is an aggressive disease with high incidence and mortality worldwide (1-3).Globally,it is the fourth leading cause of cancer-related deaths (4).Immunotherapy is an important method for treating GC (5-7).Nivolumab is the first programmed cell death protein 1 (PD-1)inhibitor that has been associated with superior overall survival (OS),as well as progression-free survival (PFS)benefit in combination with chemotherapy versus chemotherapy alone in previously untreated patients with advanced gastric adenocarcinoma (8).Programmed cell death ligand 1 (PD-L1) testing is considered for locally advanced or metastatic gastric carcinomas in patients eligible for treatment with PD-1 inhibitors.A specimen is considered to have PD-L1 expression if the combined positive score (CPS) ≥ 1. In CheckMate-649 trial,nivolumab in combination with chemotherapy was used in patients with CPS≥5 (8).In another trial (KEYNOTE-062)with the advanced GC/GEJC patients,the patients with PD-L1 expression CPS≥1 and CPS≥10 had better OS than those undergoing chemotherapy (9).The results of these two clinical trials showed that the CPS score was positively correlated with the efficacy of immunotherapy.Due to the limitation of the lesion site of gastroscopy biopsy,the CPS score of gastroscopy results may differ from that of surgical pathology (10).The overall sensitivity of CPS score matching the results of endoscopical biopsies with resection specimens was 0.73.Compared to the tissue microarrays,the preoperative biopsies showed reduced sensitivity(0.412) (10).So we consider to find more characteristics of patients with high CPS scores preoperatively.
Multi-detector computed tomography (CT) is currently the routine technique of choice for preoperative staging of GC (11-15).At present,the relationship between CPS score and CT imaging features of GC remains unknown.In this study,CT imaging signs of GC patients with different CPS scores groups were analyzed to explore whether CPS scores could be predicted based on CT imaging signs so as to provide help for screening patients and make prognosis predictions for patients receiving immunotherapy.
Materials and methods
Patients
This retrospective study was approved by the Institutional Review Board of Peking University Cancer Hospital (No.2019KT105),and the requirement for informed consent was waived.
We collected the clinicopathological data of 227 patients with pathologically-confirmed GC who underwent gastrectomy between December 2019 and September 2020.All patients underwent baseline contrast-enhanced CT scans of the abdomen before treatment.The exclusion criteria were as follows: 1) patients who received neoadjuvant chemotherapy before gastrectomy;2) patients with other simultaneous malignant tumors;3) patients with multiple GC;4) patients with insufficient distention of the stomach;or 5) those with tumors that were too small to locate by CT.
Pathological diagnosis
The postoperative histopathological diagnosis was performed by an experienced pathologist.The Lauren classification,histological differentiation and pathological TNM stages were evaluated based on the 8th American Joint Committee on Cancer (AJCC) Cancer Staging Manual (16).The CPS of PD-L1 expression with 22C3 pharmDx was defined as the ratio of potential PD-L1 expression,including tumor cells and immune cells to the total number of viable tumor cells by immunohistochemical results.The expression patterns of mismatch repair (MMR)major proteins (MLH1,MSH2,MSH6 and PMS2) in immunohistochemistry were used to confirm the microsatellite instability (MSI) status in GC tissues.The lack of expression of any of the four MMR proteins was defined as MSI-high.Tumors with preserved expression of all MMR proteins were considered as MSI-low.
CT protocol
Two CT scanner with 64 or 128 rows of detectors were used (LightSpeed 64; Discovery CT750 HD,GE Healthcare,Milwaukee,WI,USA).After fasting >8 h,all patients were given 8 g of oral gas-producing crystals for gastric distension,along with an intramuscular injection of 10 mg anisodamine to reduce gastric motility(raceanisodamine hydrochloride,Hangzhou Minsheng Pharmaceutical Co.Ltd.,China).After 10-15 min postinjection,a non-contrast CT scan from the diaphragm dome to 2 cm below the lower margin of the air-distended gastric body was acquired (collimation: 0.625 mm,peak tube voltage: 120 kVp,tube current-time product:automatic).Next,100 mL of a non-ionic contrast medium(Ultravist 300 mg/mL;Bayer,Munich,Germany) was administered intravenously at 3.0-3.5 mL/s using an automatic injector. The arterial phase images were captured using bolus tracking.The arterial phase scanning was initiated when the radiodensity in the abdominal aorta at the level of the celiac artery was 100 HU.The mean delay after the trigger threshold to the onset of arterial phase scanning was 22 (range: 20-25) s.Portal phase scanning began 35 s after arterial phase scanning.
Image analysis
Two radiologists with 10 years and 5 years of abdominal imaging diagnosing experience jointly performed image analysis using the workstation (Carestream Health,Shanghai,China). To achieve a consensus,any discrepancies were resolved by consulting another radiologist with 20 years of experience.They reviewed the axial,sagittal and coronal CT images of the stomach to detect tumors.The relationship between CT images and results of endoscopy was made by radiologists to confirm the location of the tumor for every case.The CT features of GC observed and measured in this study were as follows:
Location of gastric tumor: Gastric tumor location was defined as the site of the tumor center,which was divided into the esophagogastric junction,upper stomach,middle stomach and lower stomach.
Gastric tumor thickness: The thickest diameter of the gastric tumor on the axial CT image measured before treatment.With the application of oral gas contrast and intramuscular injection anisodamine medicine in our CT protocol,adequate gastric distension and reduced gastric motility ensured the accuracy of tumor thickness.For some early GC tumors that are difficult to identify,we checked the location in endoscopy to confirm the measurement site of the lesion.
Distance of tumor penetrates outward through the gastric wall: The distance of the tumor beyond the gastric serous was measured as the point where the tumor invasion was most obvious.
CT attenuation of gastric tumor: CT attenuation values of the gastric tumor with an oval region-of-interest (ROI)in the portion of the tumor on the axial arterial and portal phase CT image were measured on baseline CT.
Diameter of the two largest lymph nodes: The long and short diameters of the two largest regional lymph nodes were measured on axial CT images.
CT attenuation of the two largest lymph nodes: The attenuation of the portal phase of the two largest regional lymph nodes was measured on axial CT images.
Presence of lymph nodes with short diameter >10 mm:The number of lymph nodes with short diameters >10 mm detected on axial CT images was recorded.
Statistical analysis
The continuous and categorical data were presented asand frequency (%),respectively.Data processing and analysis were performed using SPSS statistics (Version 22.0;IBM Corp.,New York,USA).CT features of the CPS<5 and ≥5 groups,CPS<10 and ≥10 groups were compared using the independent-samplest-test and Mann-Whitney U test.P<0.05 was considered to be statistically significant.Multivariate logistic regression was conducted,from which the statistically significant variables tested were substituted into logistic regression to determine independent CT features that predicted different CPS scores group.Sensitivity,specificity and receiver operating characteristic (ROC) curve analysis were performed to determine the diagnostic ability of CT features in predicting CPS score.
Results
Patients and tumor characteristics
In the 227 patients with GC who underwent gastrectomy,one patient who had lymphoma simultaneously was excluded.Two patients who had multiple GC were excluded.Two patients who had insufficient distention were excluded.Sixteen patients were excluded because the gastric lesions were too tiny to locate by CT.Fifty-three patients who received neoadjuvant chemotherapy were excluded.Finally,a total of 153 patients were included in the study.The patient and tumor characteristics are summarized inTable 1.
Comparison of CT features between CPS groups in patients with early GC
Univariate analysis showed that none of the observed CT features significantly differed between CPS groups with a cutoff score of 5 and a score of 10 in patients with early GC(Table 2).
Comparison of CT features between CPS groups in patients with advanced GC
Between the CPS<5 and CPS≥5 groups in advanced GC,the presence of lymph nodes with short diameters >10 mmwas significantly different (P=0.024).Also,the MSI status was significantly different (P=0.015).The rate of MSI-high patients in CPS≥5 group (11.0%,8/73) was higher than that of CPS<5 group (0,0/51).Other CT features had no significant differences between the CPS groups with a cutoff score of 5 in patients with advanced GC (Table 3).Several CT features,including tumor attenuation in the arterial phase,long and short diameter of the largest lymph node,the sum of long diameter of the two largest lymph nodes,the sum of short diameter of the two largest lymph nodes,and presence of lymph nodes with short diameters>10 mm showed significant difference (P<0.05) between the CPS<10 and CPS≥10 groups in advanced GC (Table 3).For the CPS≥10 group,on the multivariate logistic regression analysis with forward selection,two CT features,presence of lymph nodes with short diameters >10 mm(OR=4.221,95% CI: 1.519-11.728,P=0.006) and tumor attenuation in the arterial phase (OR=1.019,95% CI:1.004-1.034,P=0.011) were the independent predictors for CPS≥10 (Table 4).The ROC curves showed that the multivariate logistic regression model achieved the largest area under the curve (0.671) (95% CI,0.574-0.769) for predicting CPS≥10 (Figure 1). The sensitivity and specificity of logistic regression model were 71.7% (33/46)and 50.0% (39/78),respectively.
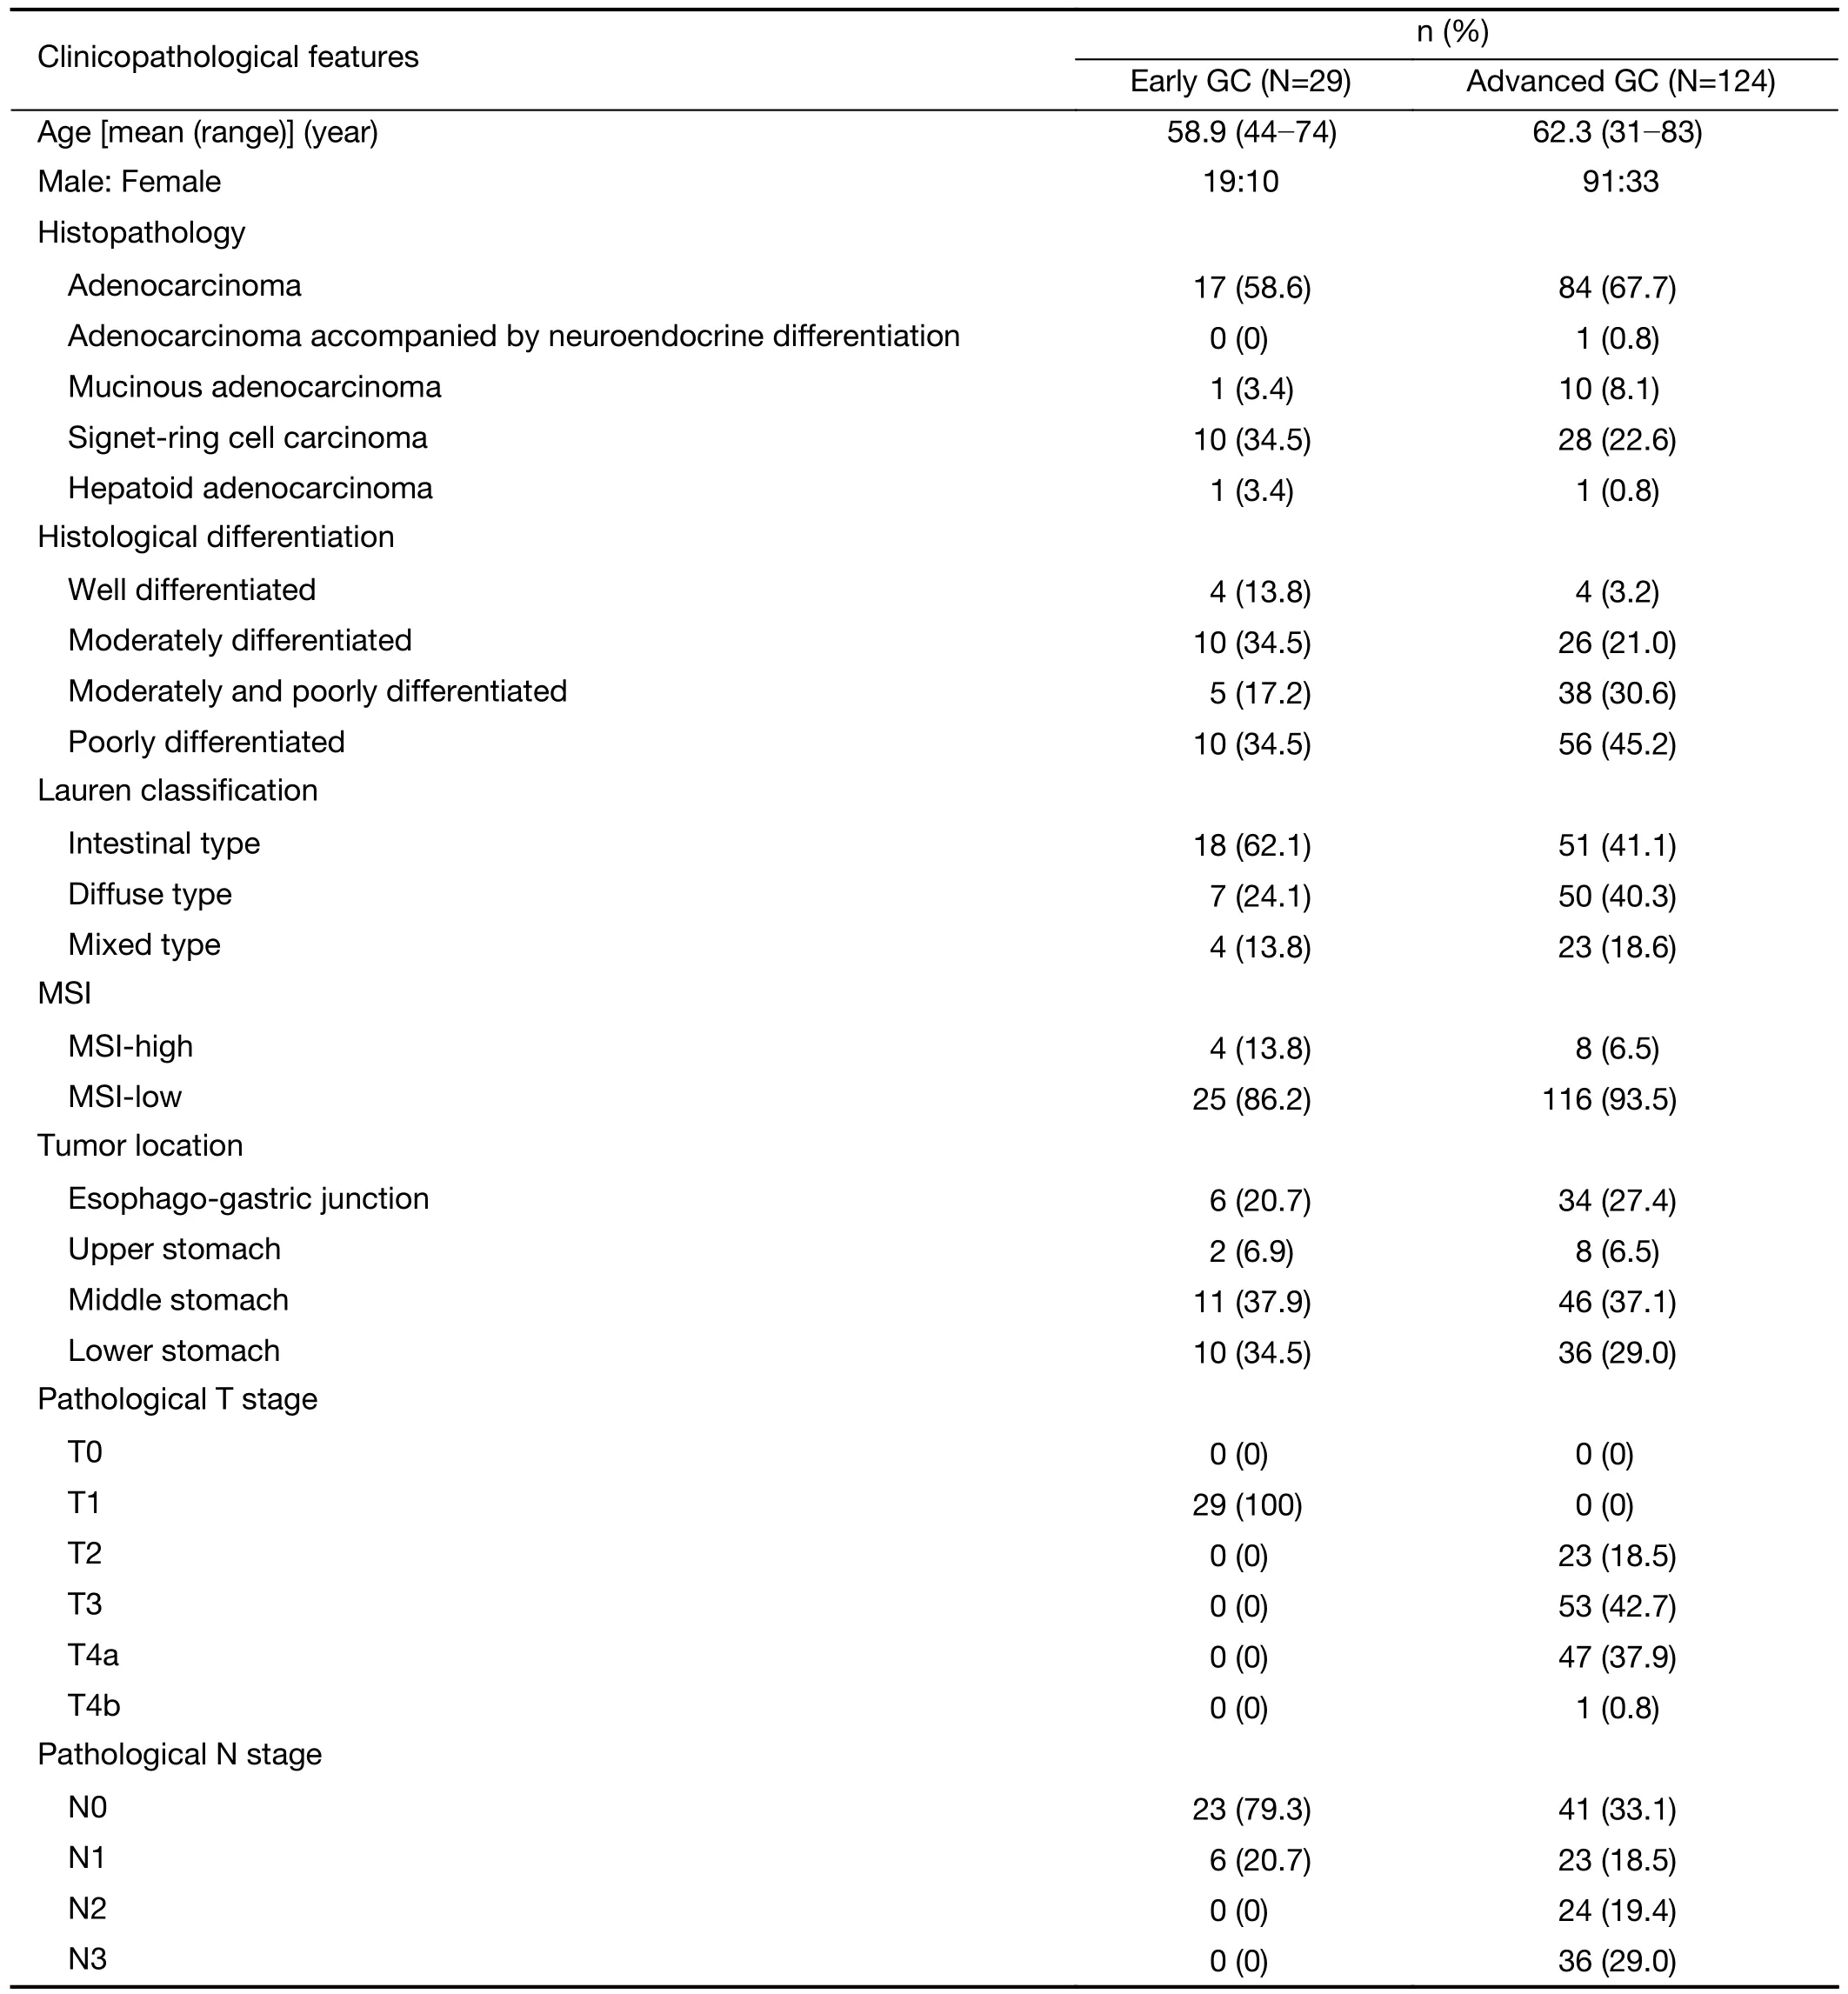
Table 1 Clinicopathological features of patients included in this study
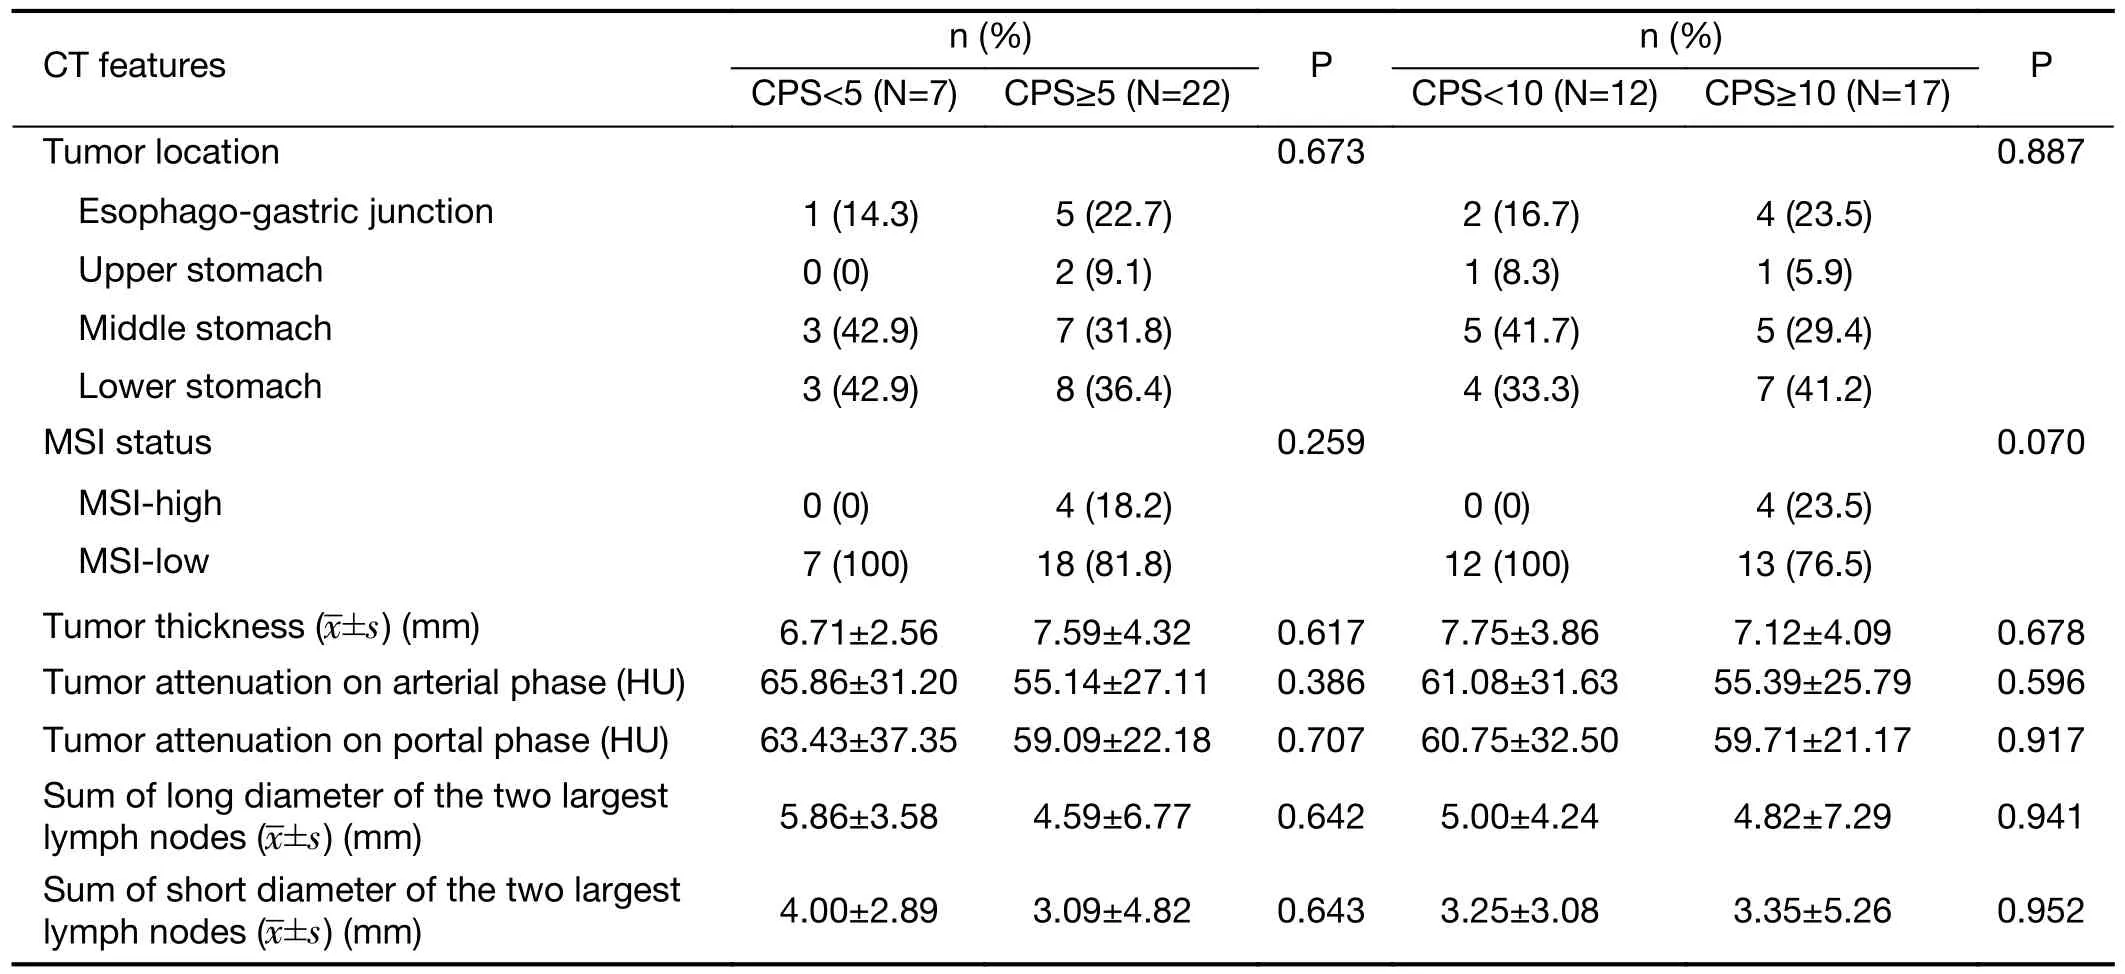
Table 2 Comparison of CT image features between CPS groups in patients with early GC
The MSI status was significantly different (P=0.022).The rate of MSI-high patients in CPS≥10 group (13.0%,6/46) was higher than that of CPS<10 group (2.5%,2/78)(Table 3).
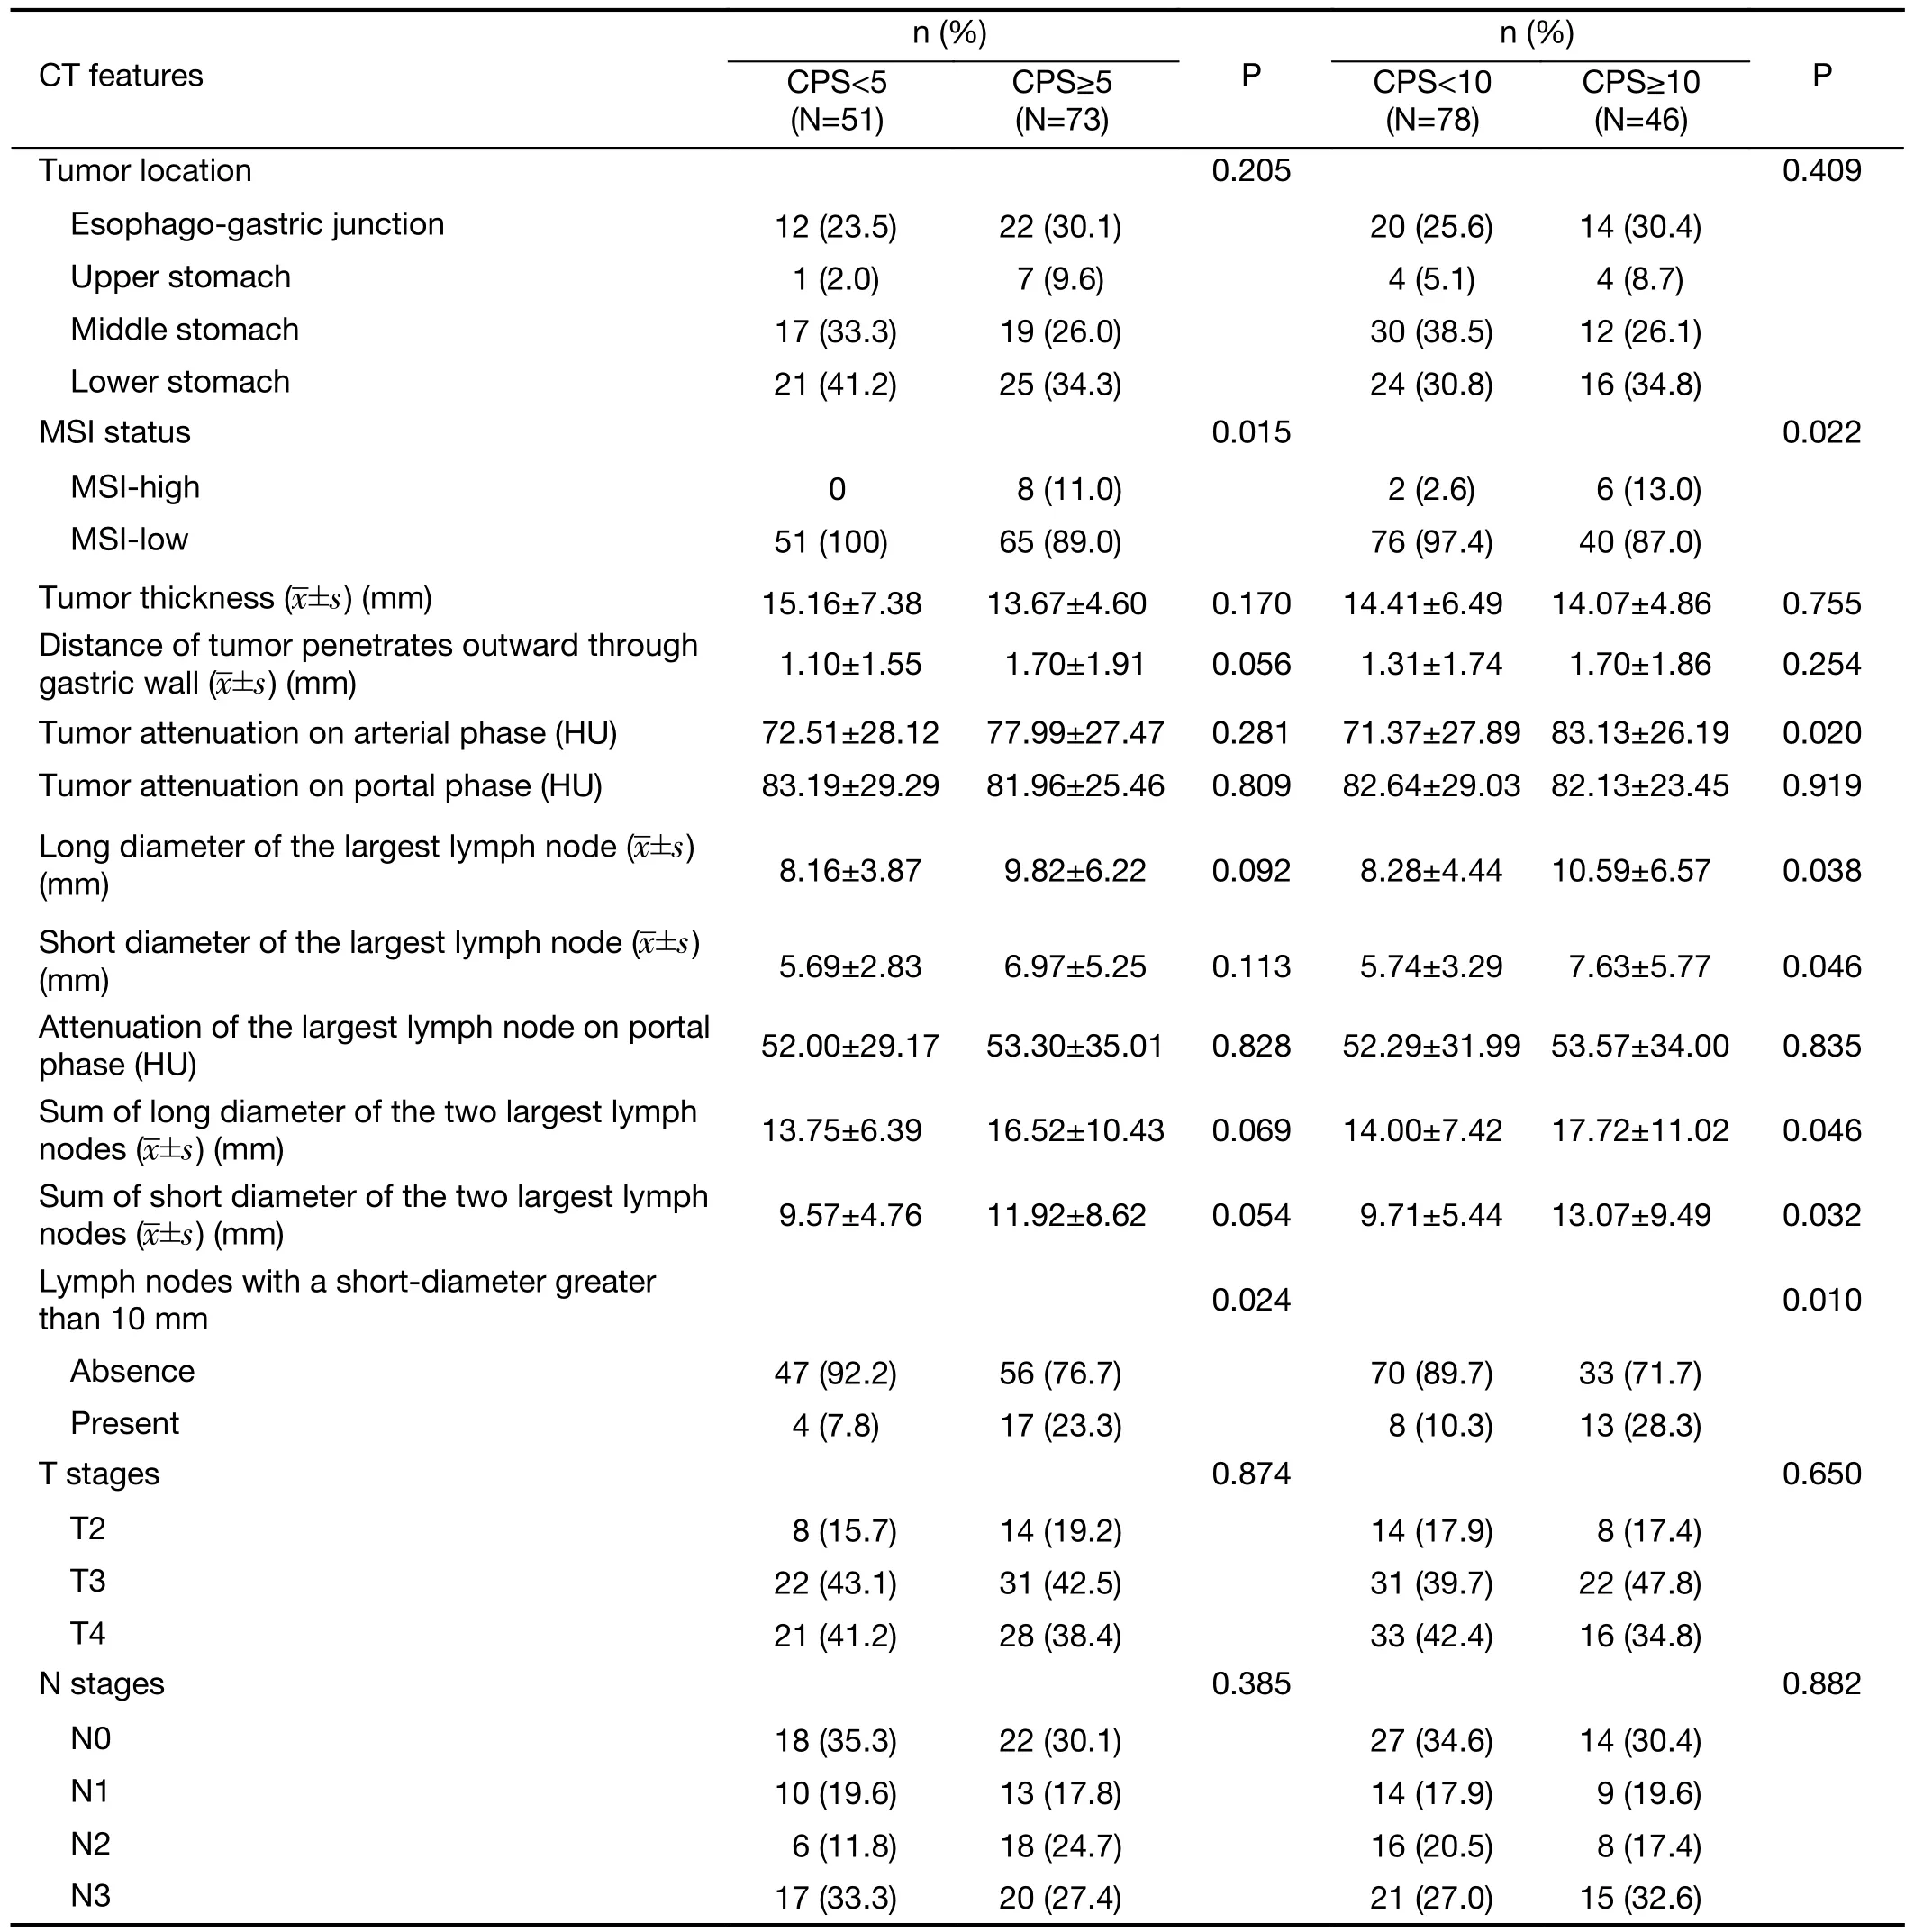
Table 3 Comparison of baseline CT image features between CPS groups in advanced GC
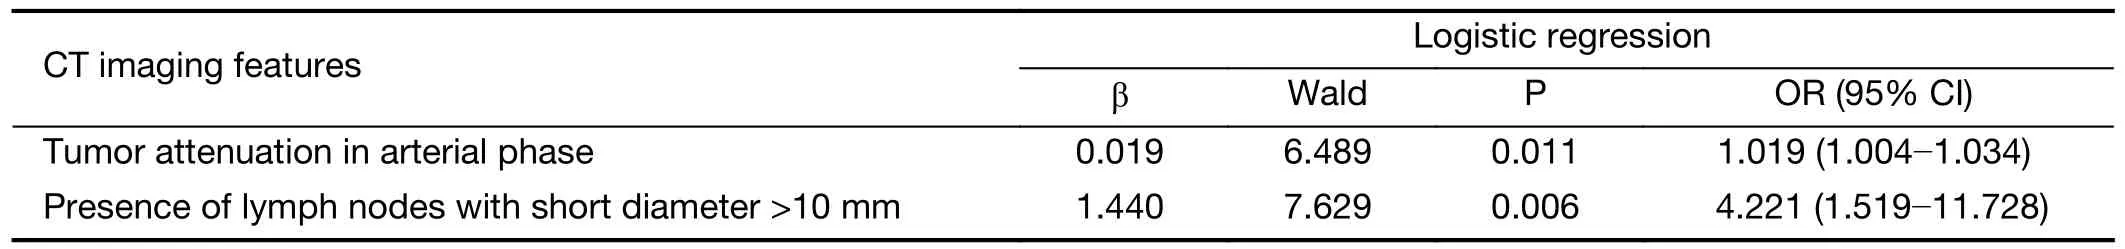
Table 4 Results of multivariate logistic regression analysis of CT features for diagnosing CPS≥10 with gastric cancer
Discussion
Previous studies have demonstrated that the CPS score of PD-L1 for GC was positively correlated with the efficacy of immunotherapy (17).Recently,a report found the biopsies endoscopically may not map the actual PD-L1 status of the entire tumor in GC.Fewer surface biopsies decreased sensitivity and specificity and caused falsenegative classifications of CPS scores (10).Meanwhile,the relationship between CPS score and GC CT imaging features remains unclear.We hypothesized that if there was a link between CPS and CT findings of GC,then we could select suitable patients for immunotherapy based on noninvasive CT.
Since immunotherapy is mostly used for advanced GC,we analyzed the cases of early GC and advanced GC separately.In early GC cases,none of the observed CT features significantly differed between the CPS 5 and 10 groups.This might be the fact that the size of early GC tumors was relatively small,and their CT characteristics,such as size and enhancement,hardly differed among patients with different CPS scores.Gotodaet al.reported on the lymph node metastasis rate of early GC,revealing that none of the 1,230 well-differentiated intramucosal cancers of <30 mm in diameter and none of the 929 lesions without ulceration were associated with nodal metastases(18).As enlarged lymph nodes were rarely detected on CT images of patients with early GC,it was difficult to predict CPS scores by CT features of lymph nodes in early GC.
For the CPS<5 and CPS≥5 groups of advanced GC,wefound that the presence of lymph nodes with short diameters >10 mm was significantly different.The incidence of large lymph nodes (≥10 mm) in CPS≥5 groups(23.3%,17/73) was larger than that in CPS<5 group (7.8%,4/51).For the CPS<10 and CPS≥10 groups in advanced GC,some CT features of the tumor (attenuation on arterial phase) and lymph nodes (long and short diameter of lymph node,the presence of large lymph nodes) were significantly different.The patients tended to have higher tumor enhancement and larger lymph nodes in CPS≥10 groups (Figure 2).As the CPS score was calculated by potential PD-L1 expression,including tumor cells andimmune cells,we speculated that the lesion with a higher CPS score was associated with a greater inflammatory reaction.The inflammatory reaction may cause the lymph nodes to enlarge.In many cases of gastritis and inflammatory diseases,high mucosal enhancement in the arterial phase was the common CT finding due to mucosal hyperemia (19,20).Accordingly,we thought that the higher tumor enhancement in the arterial phase in CPS≥10 patients was correlated with more immune cells at the lesion.
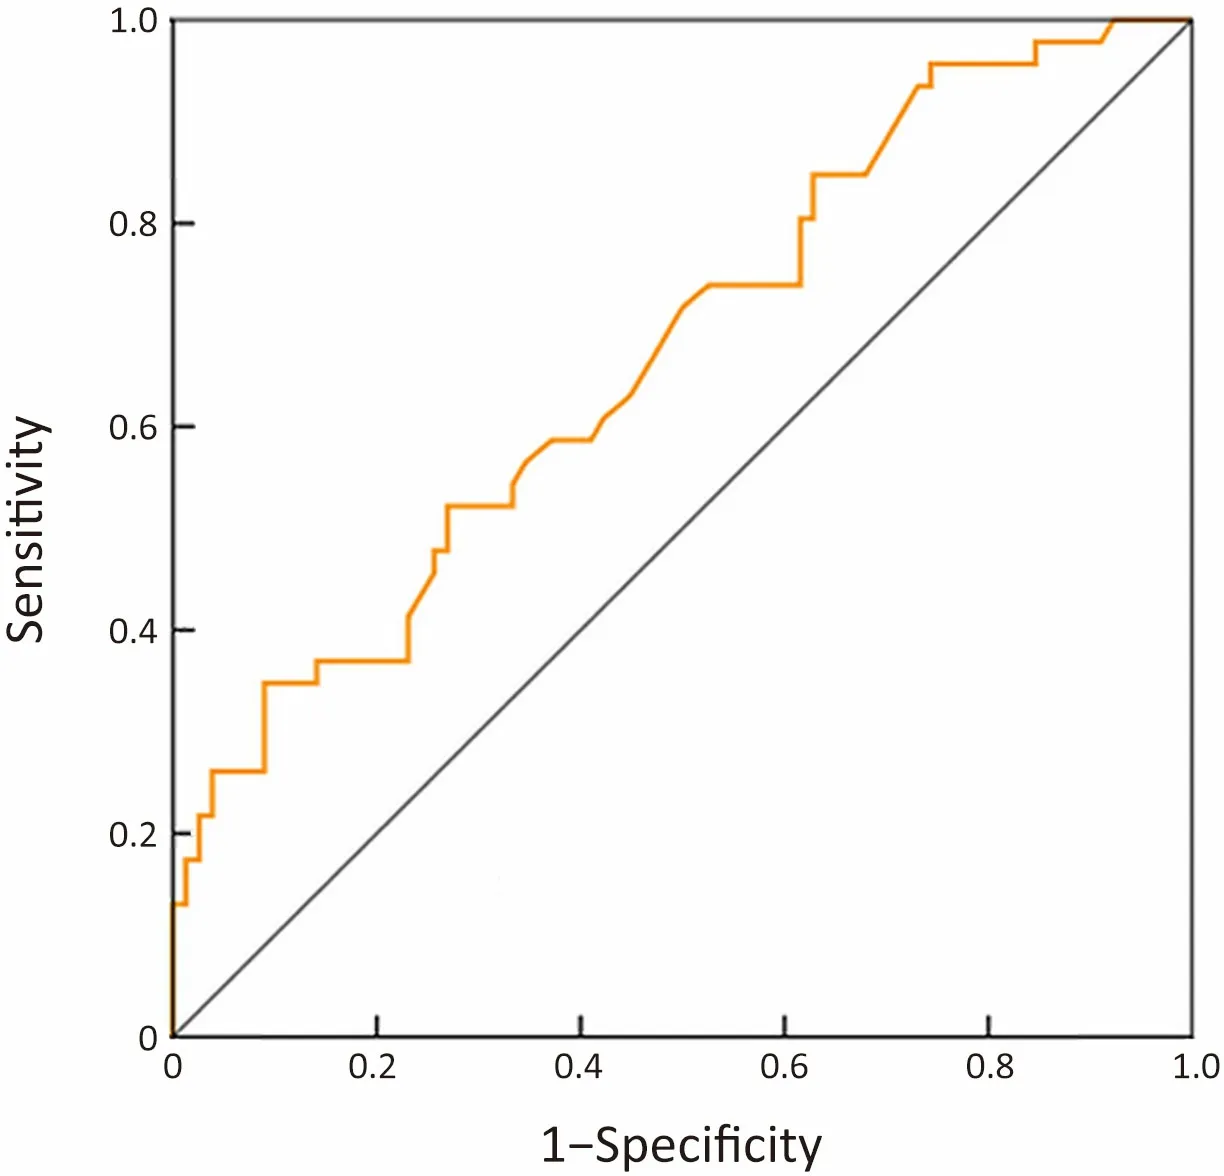
Figure 1 ROC curve of logistic regression model for predicting CPS≥10.Area under the ROC curve was 0.671 (95% CI,0.574-0.769).The sensitivity and specificity were 71.7% and 50.0%,respectively.ROC,receiver operating characteristic;CPS,combined positive score;95% CI,95% confidence interval.
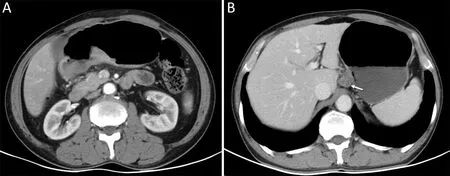
Figure 2 A male,62-year old patient with advanced gastric cancer.Pathological results after operation showed it was ulcerative poorly differentiated adenocarcinoma with CPS score 50,T3N2 stage and MSI-stable.(A) Axial CT indicated thickening and enhancement of the gastric wall at the posterior wall of gastric antrum.CT attenuation of tumor on arterial phase was 102 HU;(B) A 19 mm × 16 mm metastatic lymph node (arrow) was detected at the lesser curvature area of stomach.CPS,combined positive score;CT,computed tomography;MIS,microsatellite instability.
For diagnosing CPS≥10 cases,the quantitative results of sensitivity,specificity and area under ROC curve of logistic regression model were 71.7%,50.0% and 0.671,respectively.The sensitivity was similar to that of the endoscopic biopsies (10).Although endoscopic biopsy was the routine method to diagnose CPS score before surgery,the clinical value of CT features predicting CPS score may be useful for the cases which did not receive adequate number of biopsies in endoscopy examination.
Previous study reported the relationship between MSI status and CPS score.Liuet al.’s study showed that PD-L1 was expressed in 59.3% of GC patients and was associated with MSI (21).Yoshidaet al.reported that a higher proportion of patients with MSI-H tumors demonstrated PD-L1 expression with a CPS≥10vs.those with MSIlow/stable tumors in GC (22).Our study got the same result.MSI-H tumors were observed in higher PD-L1 expression.Another report found that the features of MSIH GC included intestinal-type histology,antral location,and good prognosis (23).While,in our study,the tumor location had no significantly different between the CPS groups.
This study has some limitations.First,this was a retrospective single center study with small samples size,which may lead to some biases.The conclusions of our study need to be further confirmed by prospective studies and external validation.Second,we did not make a one-toone correspondence between CT images and histopathological specimens,so we could not prove whether high enhancement and large lymph nodes were related to the increased immune cells in histopathology.
Conclusions
CT findings of advanced GC patients with CPS≥10 showed greater arterial phase enhancement and larger lymph nodes.CT has the potential to help screen patients suitable for immunotherapy.
Acknowledgements
This work was supported by the Digestive Medical Coordinated Development Center of Beijing Municipal Administration of Hospitals (No.XXT20).
Footnote
Conflicts of Interest: The authors have no conflicts of interest to declare.
 Chinese Journal of Cancer Research2022年5期
- Chinese Journal of Cancer Research的其它文章
- Characteristics of lymph node stations/basins metastasis and construction and validation of a preoperative combination prediction model that accurately excludes lymph node metastasis in early gastric cancer
- Evaluation of triage strategies for high-risk human papillomavirus-positive women in cervical cancer screening: A multicenter randomized controlled trial in different resource settings in China
- Colorectal cancer burden,trends and risk factors in China:A review and comparison with the United States
- Myeloid checkpoints for cancer immunotherapy
- National guidelines for diagnosis and treatment of malignant lymphoma 2022 in China (English version)
- Beyond images: Emerging role of Raman spectroscopy-based artificial intelligence in diagnosis of gastric neoplasia