Leaf morpho-physiology and phytochemistry of olive trees as affected by cultivar type and increasing aridity
Said TOUATI, Jawaher AYADI, Abdelhakim BOUAJILA, Smail ACILA,Rami RAHMANI, Jalloul BOUAJILA, Mohamed DEBOUBA*
1 Laboratory of ''Biodiversity, Molecule and Applications, LR22ES02'', Higher Institute of Applied Biology of Medenine,University of Gabes, Zrig 6029, Tunisia;
2 Laboratory of Geosystems, Georessources and Geoenvironments, Faculty of Science of Gabes, Department of Earth Sciences,University of Gabes, Zrig 6029, Tunisia;
3 Laboratory of Biology, Environment and Health, Department of Biology, Faculty of Nature and Life Sciences, University of Echahid Hamma Lakhdar El-Oued, Chott 39000, Algeria;
4 Laboratoire de Génie Chimique, Université de Paul Sabatier, CNRS, INPT, UPS, Toulouse, France
Abstract: The olive species (Olea europaea L.) is an ancient traditional crop grown under rainfed conditions in the Mediterranean Basin. In response to the growing national and international demand for olive oil,the olive cultivars are introduced into highly arid new bioclimatic areas. Subsequently, the morpho-physiology and phytochemistry of olive trees are potentially changing among cultivar types and geographical conditions. In the present work, we have undertaken an assessment on the impacts of geographical location and cultivar types on the leaf morpho-physiology and phytochemistry of olive trees.Thus, leaves of the two most cultivated olive tree varieties, Chemlal and Sigoise, were collected from three geographical regions (Setif, Batna, and Eloued) with increasing aridity in Algeria. Leaf samples from the geographical regions were analyzed using the standard physiological experiment, colorimetric method, and a chromatography assay. Leaves of both cultivars exhibited a significant variance in terms of the leaf shape index but not for the leaf tissue density, specific leaf weight, and specific leaf area. Photosynthetic pigment contents were affected by both cultivar type and geographical location, with the lowest pigment content recorded in the Sigoise cultivar from the Setif region. Compared with the Setif and Batna regions,dried leaves of both cultivars from the Eloued region showed the higher levels of the total polyphenol,total flavonoid, and total tannin, as well as a better antioxidant capacity. Liquid chromatography-mass spectrometry analysis of all leaf extracts identified the following phenolic acids as major compounds:oleuropein, naringin, apigenin-7-O-glucoside, kaempferol, quercetin, quercitrin, luteolin-7-O-naringenin,and quinic acid. Lower contents were found for p-Coumaric acid, trans-Ferulic acid, hyperoside, rutin,apigenin, caffeic acid, protocatechuic acid, o-Coumaric acid, and gallic acid. Also, epicatechin and catechin+ were not found in the leaf extracts of the Sigoise cultivar. The leaf organic extracts in both cultivars displayed promising anti-cancer activity that was affected by geographical location and organic solvent polarity. Briefly, although increasing aridity and soil organic and mineral deficiency affected the leaf morpho-physiological parameters, both cultivars sustained a chemical richness, a good antioxidant,and an anti-tumoral capacity in leaves. Furthermore, the findings revealed that regardless the olive tree genotype, there was a significant impact of geographical location on the leaf morpho-physiology,bioactivity, and chemical composition, which may consequently modulate the growth and oil production of olive trees.
Keywords: Olea europaea L.; aridity; leaf morpho-physiology; bioactivity; olive cultivar; geographical location; Algeria
1 Introduction
The olive tree (Olea europaeaL.) has had a wide geographical distribution in the Mediterranean regions for thousands of years (Dhia et al., 2018). According to Gomes et al. (2012), there are more than 8.05×10⁸olive trees in the world, 98.0% of which are distributed in the Mediterranean regions. The global olive genetic heritage is characterized by a diversity of taxa (Muzzalupo et al.,2014) and includes about 30 genera and 600 species; especially, the genusOleaL. includes more than 30 species distributed across Europe, Asia, Oceania, and Africa (Kermanshah et al., 2020).
In Algeria, olive trees are mainly cultivated in the northern mountainous part of the country(Abdessemed et al., 2018). Among the 36 identified olive cultivars in Algeria, Chemlal and Sigoise are the most cultivated (Ilarioni and Proietti, 2014), occupying 40.0% and 25.0% of the olive orchards in Algeria, respectively (Douzane et al., 2021). Recently, a national program has been implemented to boost the development of intensive olive trees growing in the steppe,pre-Saharan, and Saharan areas in Algeria (including M'sila, Biskra, Gharda?a, Batna, and Eloued). The launched sectoral development plan aims to increase the production of olive trees and olive oil, and to improve the economic and ecological conditions in the more marginalized parts of the country. Because of the olive tree's exceptional longevity and aerial part with evergreen leaves and root system, it can preserve and protect soils from erosion and desertification in arid areas (A?achi Mezghani et al., 2021). Given that olive oil has undeniable health benefits, an increasing interest is being dedicated to the potential of olive leaves as a source of nutraceuticals and medicinal compounds for the prevention and treatment of several diseases in the Mediterranean countries (Salah et al., 2012; Medina et al., 2019; Acar-Tek and A?agündüz,2020). Recent studies have shown that olive leaves contain many biologically active compounds(Markhali et al., 2020); for example, oleuropein is considered to promote health (Hassen et al.,2015), as it is associated with antispasmodic properties, immunomodulatory effects, and cardioprotective stimulants. It is also considered hypotensive and hyperdiabetic, and has the functions of anti-tumorous, anti-inflammatory, antioxidant, and anticoagulant. In addition, olive leaves contain triterpenic compounds such as oleanolic acid, which exhibit an effective protective potential against various hepatotoxicants that can induce oxidative and electrophilic stresses(Guinda et al., 2015). Olive leaves are also being exploited as an alternative material for synthetic isotopes and fossil fuels (Gilani and Khan, 2010). The study of de Bock et al. (2013) showed that olive leaf polyphenol supply for 12 weeks significantly improved insulin sensitivity and pancreatic β-cell secretory capacity in overweight middle-aged males.
However, there have been reports that the chemical composition and bioactivity of olive trees are changing in response to seasonal variation (Wang et al., 2019), cultivar type, sampling time(Martín-García et al., 2019), and genetic diversity (Bilgin and ?ahin, 2013; Talhaoui et al., 2015).Accordingly, it is of paramount importance to characterize the potential changes in the leaf morpho-physiology and phytochemistry of olive trees concurrently by considering the cultivar diversity and the vast geographical distribution of olive trees in Algeria. This study can highlight the potential impact of geographical location on leaf morpho-physiology and phytochemistry with increasing aridity. Besides, obtained data were analyzed to investigate whether the observed effects of aridity are cultivar dependent.
2 Materials and methods
2.1 Study area
The current research work was performed in the three geographical regions with increasing aridity in Algeria (Setif, Batna, and Eloued). The Setif region (36°23′01″N, 04°59′07″E) has a semi-arid temperate climate with a mean annual precipitation of 583 mm, a mean relative humidity of 77.0%, and an annual mean temperature of 13.5°C (Fig. 1). The Batna region (35°18′33″N,05°22′08″E) has an arid climate with a mean relative humidity of 46.0%. The Eloued region(33°21′22″N, 06°47′42″E) has a Saharan climate with the lowest mean relative humidity of 30.0%and a mean annual precipitation of 65 mm (Fig. 1).
From the north (Setif region) to the south (Eloued region), there is a noticeable increase in the annual mean temperature against a decrease in the annual precipitation, that is, the aridity gradually increases with distance from the ocean. Indeed, the annual mean temperature in the Eloued region is about two times higher than that in the Setif region.
On the other hand, the annual precipitation in the Setif region is about nine times greater than that recorded in the Eloued region. As a result, the Batna region presents moderate values in the annual mean temperature and annual precipitation (Fig. 1).
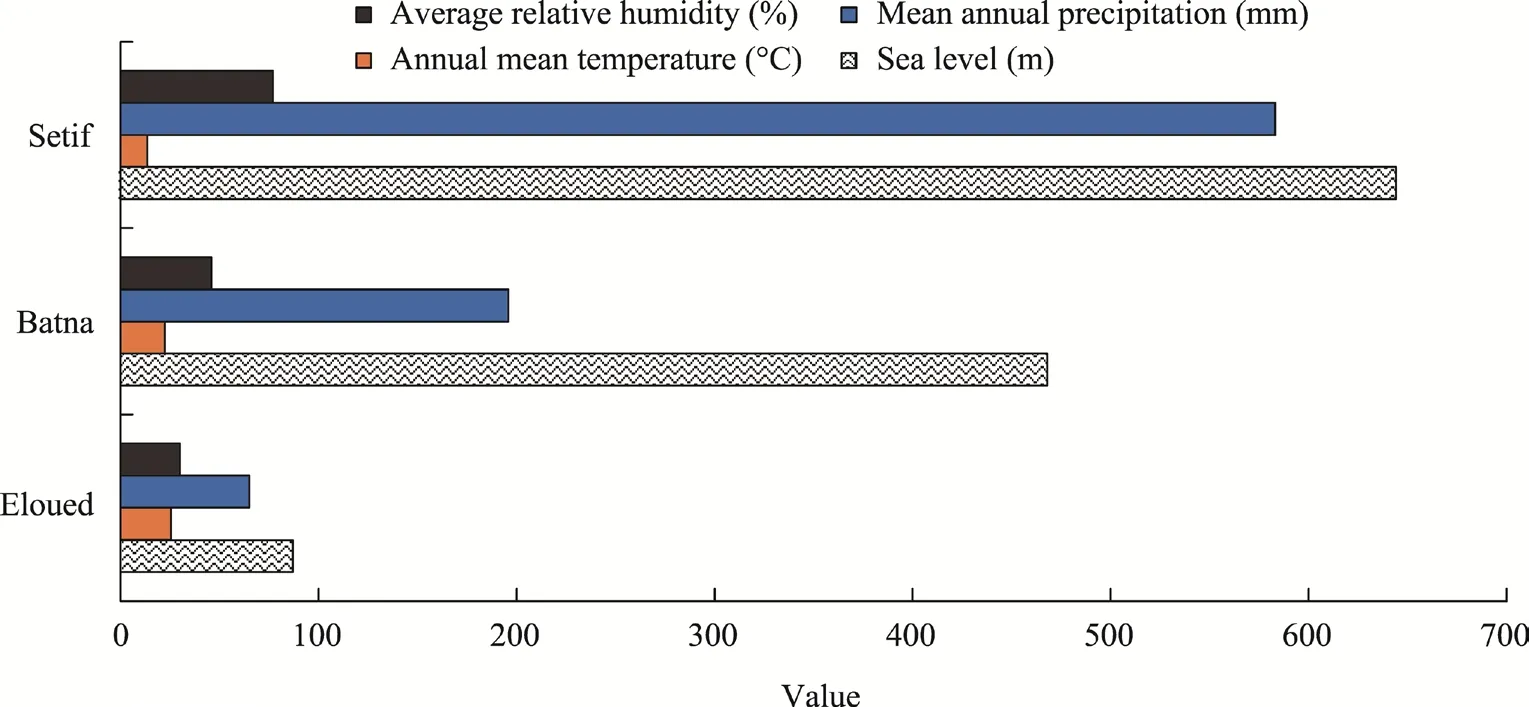
Fig. 1 Climatic conditions of the three geographical regions in Algeria (Setif, Batna, and Eloued)
2.2 Experimental design and plant materials
Leaves of two olive cultivars (Chemlal and Sigoise) were collected from three geographical regions of Eloued, Setif, and Batna with different aridity degrees. For the three regions, olive trees were planted in parallel with a spacing of 6.0 m×6.0 m and the ages of trees ranged from 15 to 18 years old. Both olive cultivars were subjected to drip system irrigation without any nutrient fertilization. Fresh leaves were collected from different sides of six trees in each cultivar's land in each region in March 2019, with a total of 36 olive trees in the three geographical regions(Eloued, Setif, and Batna). A part of the collected leaves was shade-dried, ground into a fine powder, and then stored in the dark until use.
2.3 Soil sampling and analysis
Soil samples were collected from the three geographical regions: Setif, Batna, and Eloued.Specifically, soil samples of each cultivar's land in each region were taken twice from four soil layers (0-20, 20-40, 40-60, and 60-80 cm) with a helical auger. Soil samples were air-dried first.The samples from the same soil layer of the same cultivar land in each region were mixed to obtain a homogeneous medium specimen of fine soil and then sieved through a 2-mm sieve before analysis. The soil pH (HI2211-02, Hanna Instruments? Woonsocket, Rhode Island, USA)and electrical conductivity (EC) (Inolab, Cond 7310, Xylem Analytics Germany Sales GmbH &Co. KG, WTW, Weilheim, Germany) were determined in a 1:5 soil:water suspension. The calcium carbonate content was measured by the calcimeter method (Nelson, 1983). The soil organic carbon (SOC) was determined using the mixture of K2Cr2O7and H2SO4according to the method of Walkley and Black (1934), as reported in Nelson and Sommers (1983). The distribution of soil particle sizes was determined with the method of Robinsons (1922).
2.4 Leaf morpho-physiology
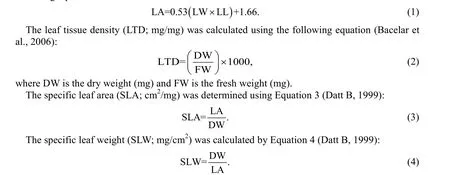
The leaf shape was determined by the value of the leaf shape index, which is the ratio of the leaf length (LL; cm) to the leaf width (LW; cm) (IOC, 1997). The leaf shape is elliptical if the leaf shape index is lower than 4, the leaf shape is elliptical-lanceolate if the leaf shape index is higher than 4 but lower than 6, and the leaf shape is lanceolate if the leaf shape index is higher than 6.The leaf length and width were measured using a graph paper.
According to Shaheen et al. (2011), the average leaf area (LA; cm2) was determined with the following equation:
2.5 Chlorophyll and carotenoid contents
For each cultivar, three fresh leaves were taken from the middle part of the olive tree, and then a disc of 50.0 mg from the central part of the fresh leaf was used. Each leaf sample was ground with 10.0 mL of methanol (99.0%) and a small amount of calcium carbonate, and then placed in a tightly closed tube. The leaf samples were left for 48 h in the dark at 4.0°C. After that, the methanolic extract was filtered (Lichtenthaler and Buschmann, 2001), and a spectrophotometer(Jenway 6300, Jenway? Equipment for Analysis, Staffordshire, UK) was used to read the absorbance (A; nm) of the samples at the following wavelengths: 665.2, 652.4, and 470.0 nm. The following equations were used to estimate the chlorophyll and carotenoid contents:

where chlorophylla, chlorophyllb, chlorophylla+b, and carotenoid contents were given in μg/mL and then converted into μg/g FW.
2.6 Phytochemical parameters
2.6.1 Metabolite extraction
Fractionated extraction was performed using three organic solvents of increasing polarity(hexane, dichloromethane, and methanol). After evaporation of the organic solvents using a rotary evaporator, the dry residue from each extraction was weighted and stored at -20.0°C.
2.6.2 Determination of the total phenolic content
We determined the total phenolic content using the Folin-ciocalteau reagent according to the method of Singleton and Rossi (1965). The Folin-ciocalteau reagent is reduced by polyphenols to
tungsten oxide with blue color. The resulting color has the maximum absorption intensity at a wavelength of 765.0 nm, which is proportional to the number of the total phenolic content in the extraction (Georgé et al., 2005). Exactly, 100.0 μL of the methanol leaf extract solution at 1.00 mg/mL was taken, and 500.0 μL of 10-times dilute Folin-ciocalteau reagent was added. The tubes were shaken for 3 min, and then 400.0 μL of sodium carbonate solution Na2CO3(7.5%) was added. The tubes were shaken well and incubated at laboratory temperature away from light for 30 min. The absorbance of the various samples was measured in a spectrophotometer at a wavelength of 765.0 nm. The result was expressed in the unit of milligram gallic acid equivalent per gram extract (mg GAE/g DW).
2.6.3 Determination of the total flavonoid content
The total flavonoid content was determined using aluminum trichloride and sodium hydroxide.The aluminum trichloride AlCl3forms a yellow compound with flavonoids, and the soda forms a pink compound that can be absorbed in the visible range at 510.0 nm (Zhishen et al., 1999). The leaf extract diluted with 1.0 mL methanol was added to 1.0 mL of AlCl3(methanol solution 2.0%), then the tubes were shaken and incubated at laboratory temperature in the dark for 10 min.The absorbance was read in a spectrophotometer at a wavelength of 430.0 nm. The result was expressed as milligram quercetin equivalent per gram extract (mg QE/g DW).
2.6.4 Determination of the tannin content
The quantitative tannin content of the leaf extracts was determined using the method of Schofield et al. (2001). The principle is based on the fixation of the aldehyde group of vanillin on the C6carbon of the catechin A-ringto form a red compound (chloroform), which is absorbed at a wavelength of 500.0 nm. Exactly, 400.0 μL of the olive leaf extract was added with 3.0 mL of vanillin solution (4.0%) and 1.5 mL of concentrated hydrochloric acid. The mixture was incubated for 15 min and the absorbance was measured at a wavelength of 500.0 nm. The result was expressed as milligram catechin equivalent per gram extract (mg CE/g DW).
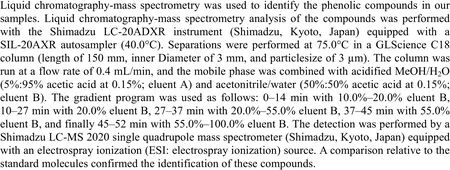
2.6.5 Secondary metabolite analysis using liquid chromatography coupled to mass spectrometry
2.7 Antioxidant activity
The antioxidant activity of the olive leaf extracts was assayedin vitroagainst the 2.2-diphenyl 1-picrylhydrazyl (DPPH). The DPPH radical scavenging antioxidant activity of the methanol extracts of olive leaves was assayed using the method described by Benhammou et al. (2009). A volume of 500.0 μL of different concentrations (0.01, 0.05, 0.10, 0.15, 0.20, 0.25, 0.30, 0.35, and 0.40 mg/mL) from each extract was added to 500.0 μL of 0.25 mM DPPH. Two replicates were used for all preparations, and then the samples were shaken and kept in the dark at laboratory temperature for 30 min. The absorbance was measured at a wavelength of 517.0 nm. Ascorbic acid was used as a standard in inhibiting free radicals. The percentage of DPPH inhibition (I; %)was calculated for the different concentrations of the olive leaf extracts using the following equation:

whereA0is the absorbance of the control sample (nm) andAIis the absorbance of the leaf sample(nm).
The antioxidant activity was estimated by calculating the half-maximal inhibitory concentration(IC50; μg/mL), which is defined as the concentration of the extract required to inhibit 50.0% of the DPPH radical.
2.8 Cytotoxic activity
The cytotoxic effect of the samples was evaluated using the Human Colon Cancer (HCT116) and Colorectal Carcinoma (CaCo-2) cell lines,ordered from the American Type Culture Collection(ATCC Co., Manassas, USA), as described by Bekir et al. (2013) with some modifications(Rahmani et al., 2019). Cells were cultured in a high glucose Roswell Park Memorial Institute(RPMI) and Dulbecco's Modified Eagle Medium (DMEM) medium (Thermo Fisher Scientific,Les Ulis, France), and supplemented with 10.0% fetal bovine serum and 1.0%penicillin-streptomycin and gentamicin in a humidified atmosphere with 5.0% CO2at 37°C,respectively. The cell suspension was distributed into 96-well plates at 13×103and 12×103cells/well in 100.0 μL, and then treated with 100.0 μL of sample dilution and prepared with a corresponding culture medium, at two concentrations of 50.0 and 5.0 mg/L, respectively. The samples were solubilized in the Dimethyl sulfoxide with a 5.00 mg/mL concentration. Cell growth was estimated using the 3-(4, 5-dimethylthiazol-2-yl)-2, 5-diphenyltetrazolium bromide(MTT) assay. The MTT test is a colorimetric test that measures the reduction of yellow MTT bromide to insoluble dark purple formazan crystals by mitochondrial succinate dehydrogenase of living cells. The solubilized formazan reagent is released by the Dimethyl sulfoxide and measured by a spectrophotometry at a wavelength of 605.0 nm. Tamoxifen was used as a positive control.The cells' activity inhibition percentage was calculated as:

2.9 Statistical analysis
Data were studied using the analysis of variance (ANOVA). Mean averages were compared by the Fisher's LSD test and considered significant atP<0.05 level. Statistical analyses were computed using Minitab 17 statistical software. Principal component analysis (PCA), based on the Pearson's product-moment correlation atP<0.05 level, was performed separately on morpho-physiological and phytochemical parameters. The study was conducted using the XLSTAT software (version 2009.4.03).
3 Results and discussion
3.1 Bioclimatic and pedological conditions
As shown in Table 1, the soil pH values of the three geographical regions were in the range of 7.53-8.39, indicating the alkaline soil. Probably, these alkaline pH values were indicative of the presence of carbonate. Similar pH results were reported in soils of several olive groves in Tunisia(Omar et al., 2017). Results of AVONA showed that geographical location and cultivar type(P=0.000) exhibited a very significant impact on the pH, but not an interaction between them(P>0.050; Table 1).
According to the recorded low EC values (<1.59 mS/cm), all sampled soils were non-saline(Table 1). The obtained EC data were consistent with the earlier findings reported by Zaanouni et al. (2018) for olive grove soils in Tunisia, where the EC varied between 0.80 and 1.60 mS/cm. The lowest EC value was measured in soils under Chemlal olive trees in the Setif region. In contrast,the highest EC value was observed in soils under Chemlal olive trees in the Batna region. ANOVA results revealed a highly significant effect (P=0.000) of all factors on the EC (Table 1).
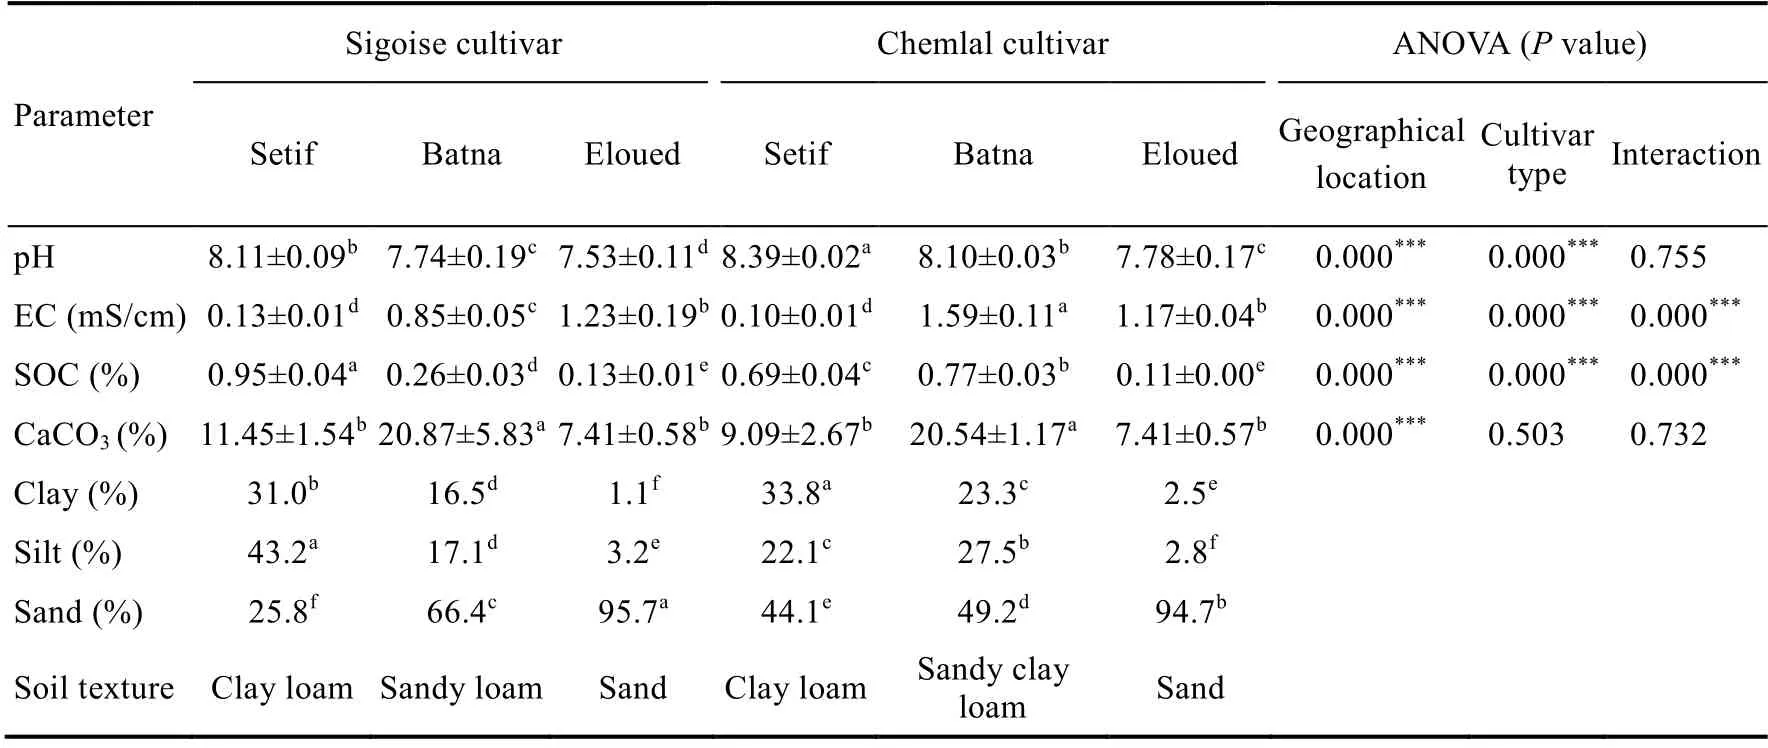
Table 1 Main properties of soils collected from Sigoise and Chemlal cultivated lands in the three different geographical regions (Setif, Batna, and Eloued)
The SOC content, CaCO3content, and soil texture varied greatly between Sigoise and Chemlal cultivated lands (Table 1). For example, soils from the Eloued region displayed the lowest SOC contents of about 0.13% and 0.11% in the Sigoise and Chemlal cultivated lands, respectively.However, soils from the Setif region showed the maximum SOC content in the Sigoise cultivated land. All studied soils, however, were considered poor as the SOC content did not exceed 2.00%.ANOVA results indicated that SOC was significantly affected by the following factors: cultivar type, geographical location, and the interaction between them (P<0.050). High variability of the CaCO3levels was observed among analyzed soils. The higher CaCO3contents were obtained in the soils from the Sigoise and Chemlal cultivated lands in the Batna region. According to the CaCO3levels, all soils could be classified as carbonated. Textural analysis showed that soils from the Eloued region were mostly sandy for both the Chemlal cultivated land (95.7%) and Sigoise cultivated land (94.7%). A lower sand percentage was found in soils of the Setif and Batna regions (Table 1). Soils from the Setif and Batna regions exhibited a fine texture with a clay percentage of 31.0%.
In the current study, the properties of soils from the Setif and Batna regions were similar to those reported in previous studies on soils of semi-arid regions in Algeria (Ababsa et al., 2020; Mehalaine and Chenchouni, 2020; Bona et al., 2021). Likewise, soils from the Eloued region showed the same characteristics as soils in the arid regions of Tunisia (Omar et al., 2017; Brahim et al., 2021).
3.2 Changes in leaf morpho-physiology proprieties
3.2.1 Leaf morphology
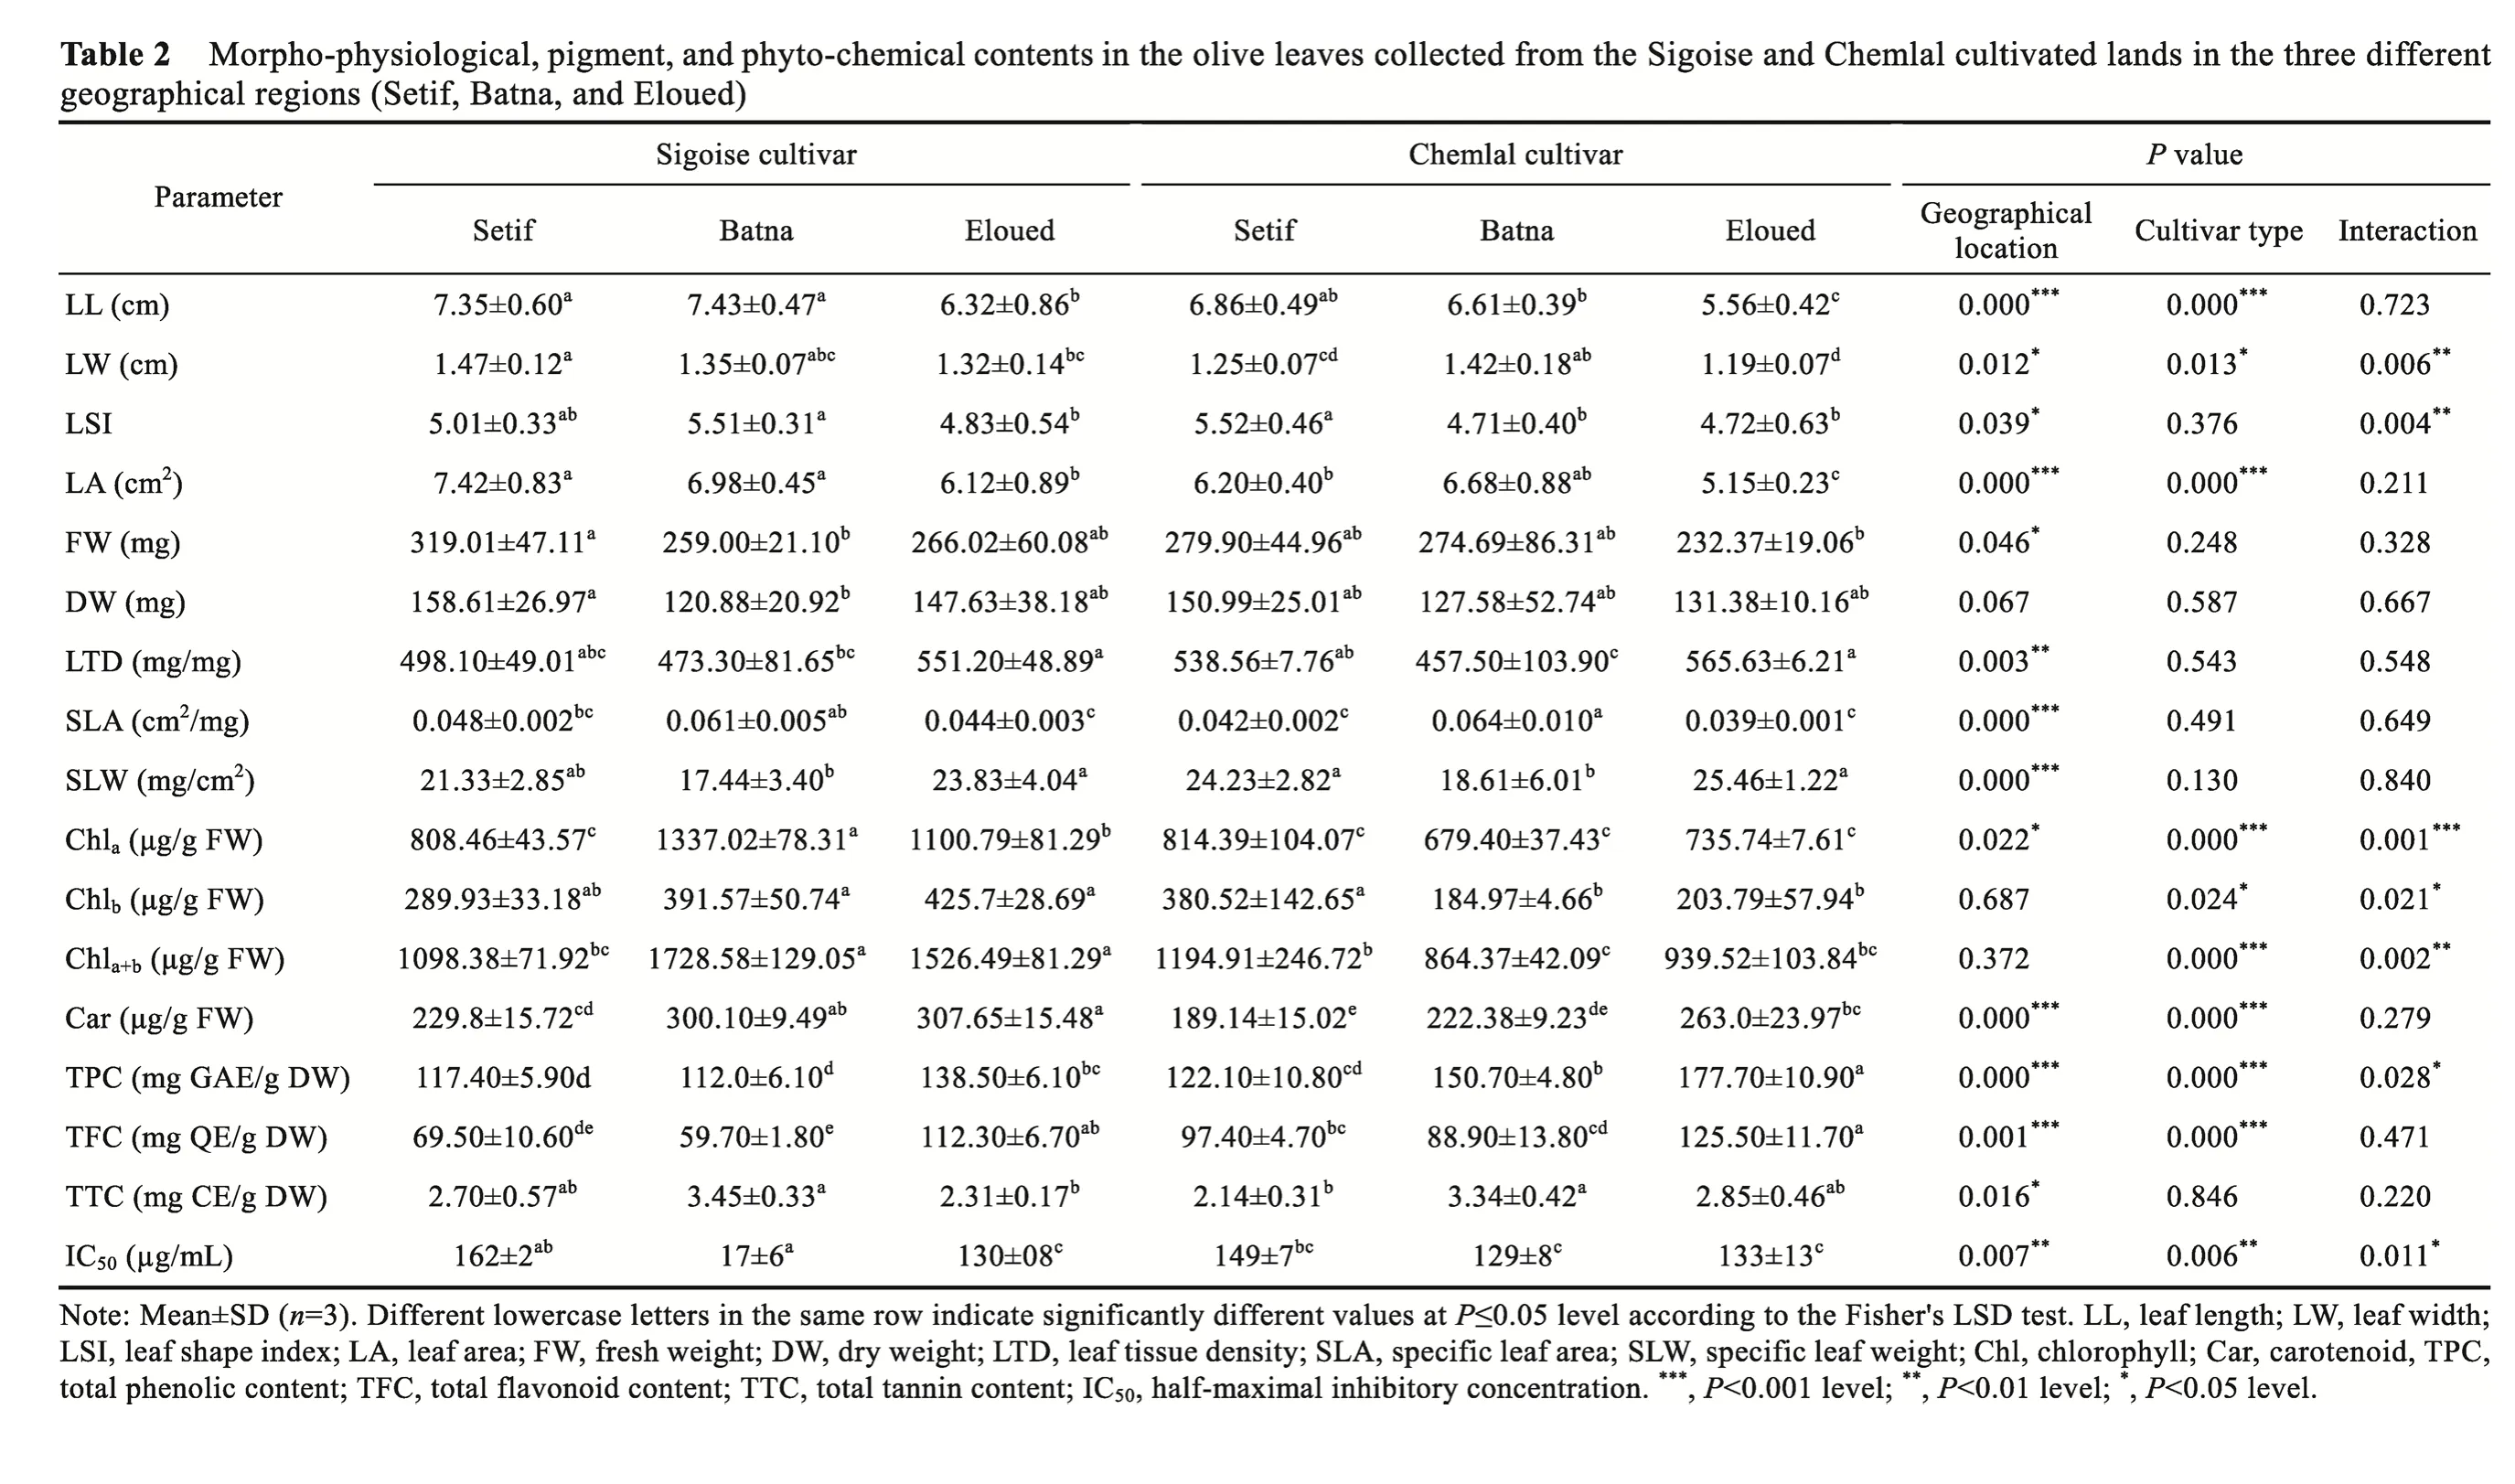
Analyzed morpho-phological parameters shown in Table 2 indicated that both cultivars from different regions showed an elliptical-lanceolate pattern in the leaf shape. However, there was a slight difference in the leaf shape index, with the average leaf length from 5.56 to 7.43 cm and the average leaf width from 1.19 to 1.47 cm (Table 2). The largest values of the leaf shape index were recorded as 5.52 (±0.46) in the Chemlal cultivated land of the Setif region and 5.51 (±0.31) in the Sigoise cultivated land of the Batna region, while the lowest one was calculated for the Chemlal cultivated land in the Batna region, at 4.71 (±0.40). These results were similar to those of Ozkaya et al. (2006), showing that the leaf shape index of the Derik Halhali olive leaf cultivar grown in Turkey ranged from 6.35 to 3.48. Results of ANOVA indicated that the leaf shape index was more influenced by geographical location and the interaction between geographical location and cultivar type (P<0.050) than by cultivar type (P>0.050).
It was stated that the Sigoise cultivar in the Setif region had the largest leaf area of 7.42 cm2(Table 2). However, the Chemlal cultivar in the Eloued region had the lowest value of 5.15 cm2.Similar results have been recorded in the five olive tree cultivated lands in Portugal, with the leaf area ranging from 3.51 to 7.69 cm2(Bacelar et al., 2004).
ANOVA results showed extreme and highly significant differences between the leaf area in geographical location and cultivar type (P=0.000), but the interaction between them did not change significantly. It was stated that increasing aridity was associated with decreased leaf area(Table 2). Numerous previous studies reported that olive tree cultivars grown in xeric areas exhibited smaller leaves than genotypes in mesic areas (Pita and Pardos, 2001; Bacelar et al.,2004), which may reduce water loss through transpiration.
3.2.2 Leaf sclerophylly indices
We noticed that the Chemlal cultivar of the Batna region recorded the highest specific leaf area(0.064 cm2/mg), while the Chemlal cultivar of the Eloued region showed the lowest one (0.039 cm2/mg) (Table 2). ANOVA results revealed that the specific leaf area was mostly affected by geographical location (P=0.000), which was also recorded for other Mediterranean cultivars(Guerfel et al., 2009; Ennajeh et al., 2010). Conversely, there were no significant effects of cultivar type as well as the interaction between geographical location and cultivar type on the specific leaf area.
The Chemlal cultivar in the Eloued region recorded the highest value in the average specific leaf weight as 25.46 mg/cm2, while the Sigoise cultivar in the Batna region presented the lowest one, at 17.44 mg/cm2(Table 2). According to the variance analysis, the specific leaf weight was highly affected by geographical location (P=0.000) but not significantly changed by cultivar type(P=0.130) and the interaction between geographical location and cultivar type (P=0.840).
There was a convergence in the leaf tissue density of both Chemlal and Sigoise cultivars in the three geographical regions, which varied between 457.50 and 565.63 mg/g (Table 2). The leaf tissue density of the Chemlal cultivar in the Batna region recorded the lowest value among the two cultivars in all regions. Statistical analysis showed that the leaf tissue density was significantly affected by geographical location (P=0.003), which was also reported in olive tree leaves of two Tunisian cultivars (Chemlali and Chétoui) growing under arid conditions (Guerfel et al., 2009). The leaf tissue density was not significantly regulated by cultivar type, suggesting that environment rather than genotypes modulated this morphological parameter.
Based on the leaf morphological analysis, it could be concluded that the two olive cultivars,Chemlal and Sigoise, belonged to the elliptical-lanceolate cultivar group in the growing areas(IOC, 1997). Regarding the morpho-physiological characteristics, Connor (2005) confirmed that environmental conditions significantly affect the properties of olive leaves during the growing season. Here, increasing aridity was associated with high significant changes in the leaf morpho-physiology of both cultivars (Table 2).
Taken together, the values of leaf morpho-physiological parameters decreased with increasing aridity, which showed that the leaf area reduced, the small cell size decreased, and the elasticity of the cell wall changed. It seems that the smaller size olive trees in the Eloued region were better adapted to water deficit and high transpiration conditions (Connor and Fereres, 2010). In fact,lower air vapor pressure could ensure less plant transpiration under high drought conditions(Tognetti et al., 2009; Diaz-Espejo et al., 2012). In addition to the influence of geographical location, cultivar type also affected the leaf morpho-physiological parameters, among which the Chemlal cultivar displayed a less effect under drought conditions (Table 2).
?
3.2.3 Total chlorophyll and total carotenoid contents
Determination of the total chlorophylla+brevealed that in the Batna region, the highest content(1728.58 μg/g FW) was recorded for the Sigoise cultivar, while the lowest one (864.37 μg/g FW)was found for the Chemlal cultivar (Table 2). Compared with the Setif region, the total chlorophyll content of the Sigoise cultivar was reduced by 35.0% in the Eloued region, primarily due to a drop in the chlorophyllalevel (Table 2). However, for the Chemlal cultivar, the leaf chlorophyll content did not change among the different geographical regions. The achieved results in the total chlorophyll content were similar to those reported in the olive leaves of four Tunisian cultivars (Bahloul et al., 2014) and higher than those reported in the olive trees of other Mediterranean countries (Maayan et al., 2008; Brahmi et al., 2012; Tekaya et al., 2016). Statistical analysis revealed that cultivar type was the prevalent factor in influencing the chlorophyll content(P=0.000), which was also argued by Bahloul et al. (2014).
Regardless of geographical location, the higher carotenoid content in olive leaves was recorded in the Sigoise cultivar compared to the Chemlal cultivar. For both cultivars, increasing aridity was associated with an improvement of the total carotenoid content (Table 2). In various higher plants,carotenoids were found to play a direct role in drought tolerance by reducing the reactive oxygen species toxicity (Niyogi et al., 1997). Tolerant plant species, compared to sensitive genotypes,accumulated higher carotenoid contents under drought conditions (Parida et al., 2007). ANOVA results showed that the carotenoid content was separately and significantly affected by cultivar type and geographical location but not by their interaction.
3.3 Phytochemical properties
3.3.1 Total polyphenol and flavonoid contents
For both olive cultivars, the highest total polyphenol content was recorded in the Eloued region(Table 2). The observed changes in the total phenolic content among harvesting locations could be attributed to arid climatic and environmental factors (Miliauskas et al., 2004; Gharibi et al.,2019). Sarker and Oba (2018) found that 16 phenolic acids and flavonoids in the leaves ofAmaranthustricolorwere remarkably increased with the severity of drought stress.According to the results in Table 2, changes in the total phenolic content values in leaves of both olive cultivars could be partially linked to the increment of the total flavonoid content.
3.3.2 Total tannin content
In plant species, tannins play a major role in defence against pathogens (Marsh et al., 2020) and contribute to protein binding (Jones and Palmer, 2000; Karonen et al., 2015) and antioxidant activity (Moilanen et al., 2016). According to Table 2, we can find that the total tannin content in leaves of both cultivars varied from 2.14 to 3.45 mg CE/g DW. ANOVA results showed that the total tannin content in leaves of the two olive cultivars was significantly affected by geographical location (P=0.016) but not by cultivar type (P=0.846).
3.3.3 Identification of phenolic compounds in olive leaves
Liquid chromatography-mass spectrometry analysis on the dry residue extract of olive leaves of the Sigoise and Chemlal cultivars enabled us to identify 20 phenolic compounds (Tables 3 and 4).The obtained data revealed the richness of olive leaves in phenolic compounds, including oleuropein, luteolin-7-O-glucoside, kaempferol, quercetin, quercitrin, apigenin-7-O-glucoside,quinic acid, and naringenin in all geographical regions and with different used solvents (Tables 3 and 4).
We found that oleuropein was the major phenolic compound (Tables 3 and 4), as it was also reported for other olive tree cultivars (Petridis et al., 2012; Zeitoun et al., 2017). The analyzed olive leaves showed average contents of other phenolic compounds such as p-Coumaric acid,rutin, trans-Ferulic acid, hyperoside, naringin, quercetin, quercitrin, and apigenin. Other compounds were very weakly identified: catechin+, epicatechin, caffeic acid, o-coumaric acid,gallic acid, and protocatechuic acid. The liquid chromatography-mass spectrometry data indicated that methanol extraction allowed the detection of maximum phenolic compound compared to other solvents (Tables 3 and 4). In addition, the highest oleuropein content was recorded in the methanolic extract of olive leaves of the Sigoise cultivar from the Batna region, at the value of 15,900.86 mg/kg. The methanolic extract of the Chemlal cultivar from the Eloued region exhibited a predominance in quinic acid, gallic acid, protocatechuic acid, luteolin-7-O-glucoside,naringin, o-coumaric acid, and quercetin; the same was found for the Sigoise cultivar from the Eloued region, namely with rutin, hyperoside, and quercitrin (Tables 3 and 4).
The methanolic extract of the Chemlal cultivar from the Setif region was relatively enriched in catechin+, trans-Ferulic acid, and kaempferol. The Sigoise cultivar, however, was more enriched in apigenin. As for the dichloromethane extracts of olive leaves from the Batna region, they showed a slight superiority in the epicatechin and naringenin contents for the Chemlal cultivar and a higher content of caffeic acid for the Sigoise cultivar (Tables 3 and 4).
A predominance of oleuropein and luteolin7-O-glucoside as phenolic compounds in the analyzed olive leaves was also reported in previous studies (Pereira et al., 2007; Mohamed et al.,2018). It should also be emphasized that several factors can qualitatively and quantitatively modify the composition of olive leaves in terms of phenolic compounds (Bilgin and ?ahin, 2013), such as the variety of olive trees as well as water deficit, salinity, fertilization, geographical location(Vinha et al., 2005), sample collection time, and climatic conditions (Talhaoui et al., 2015).
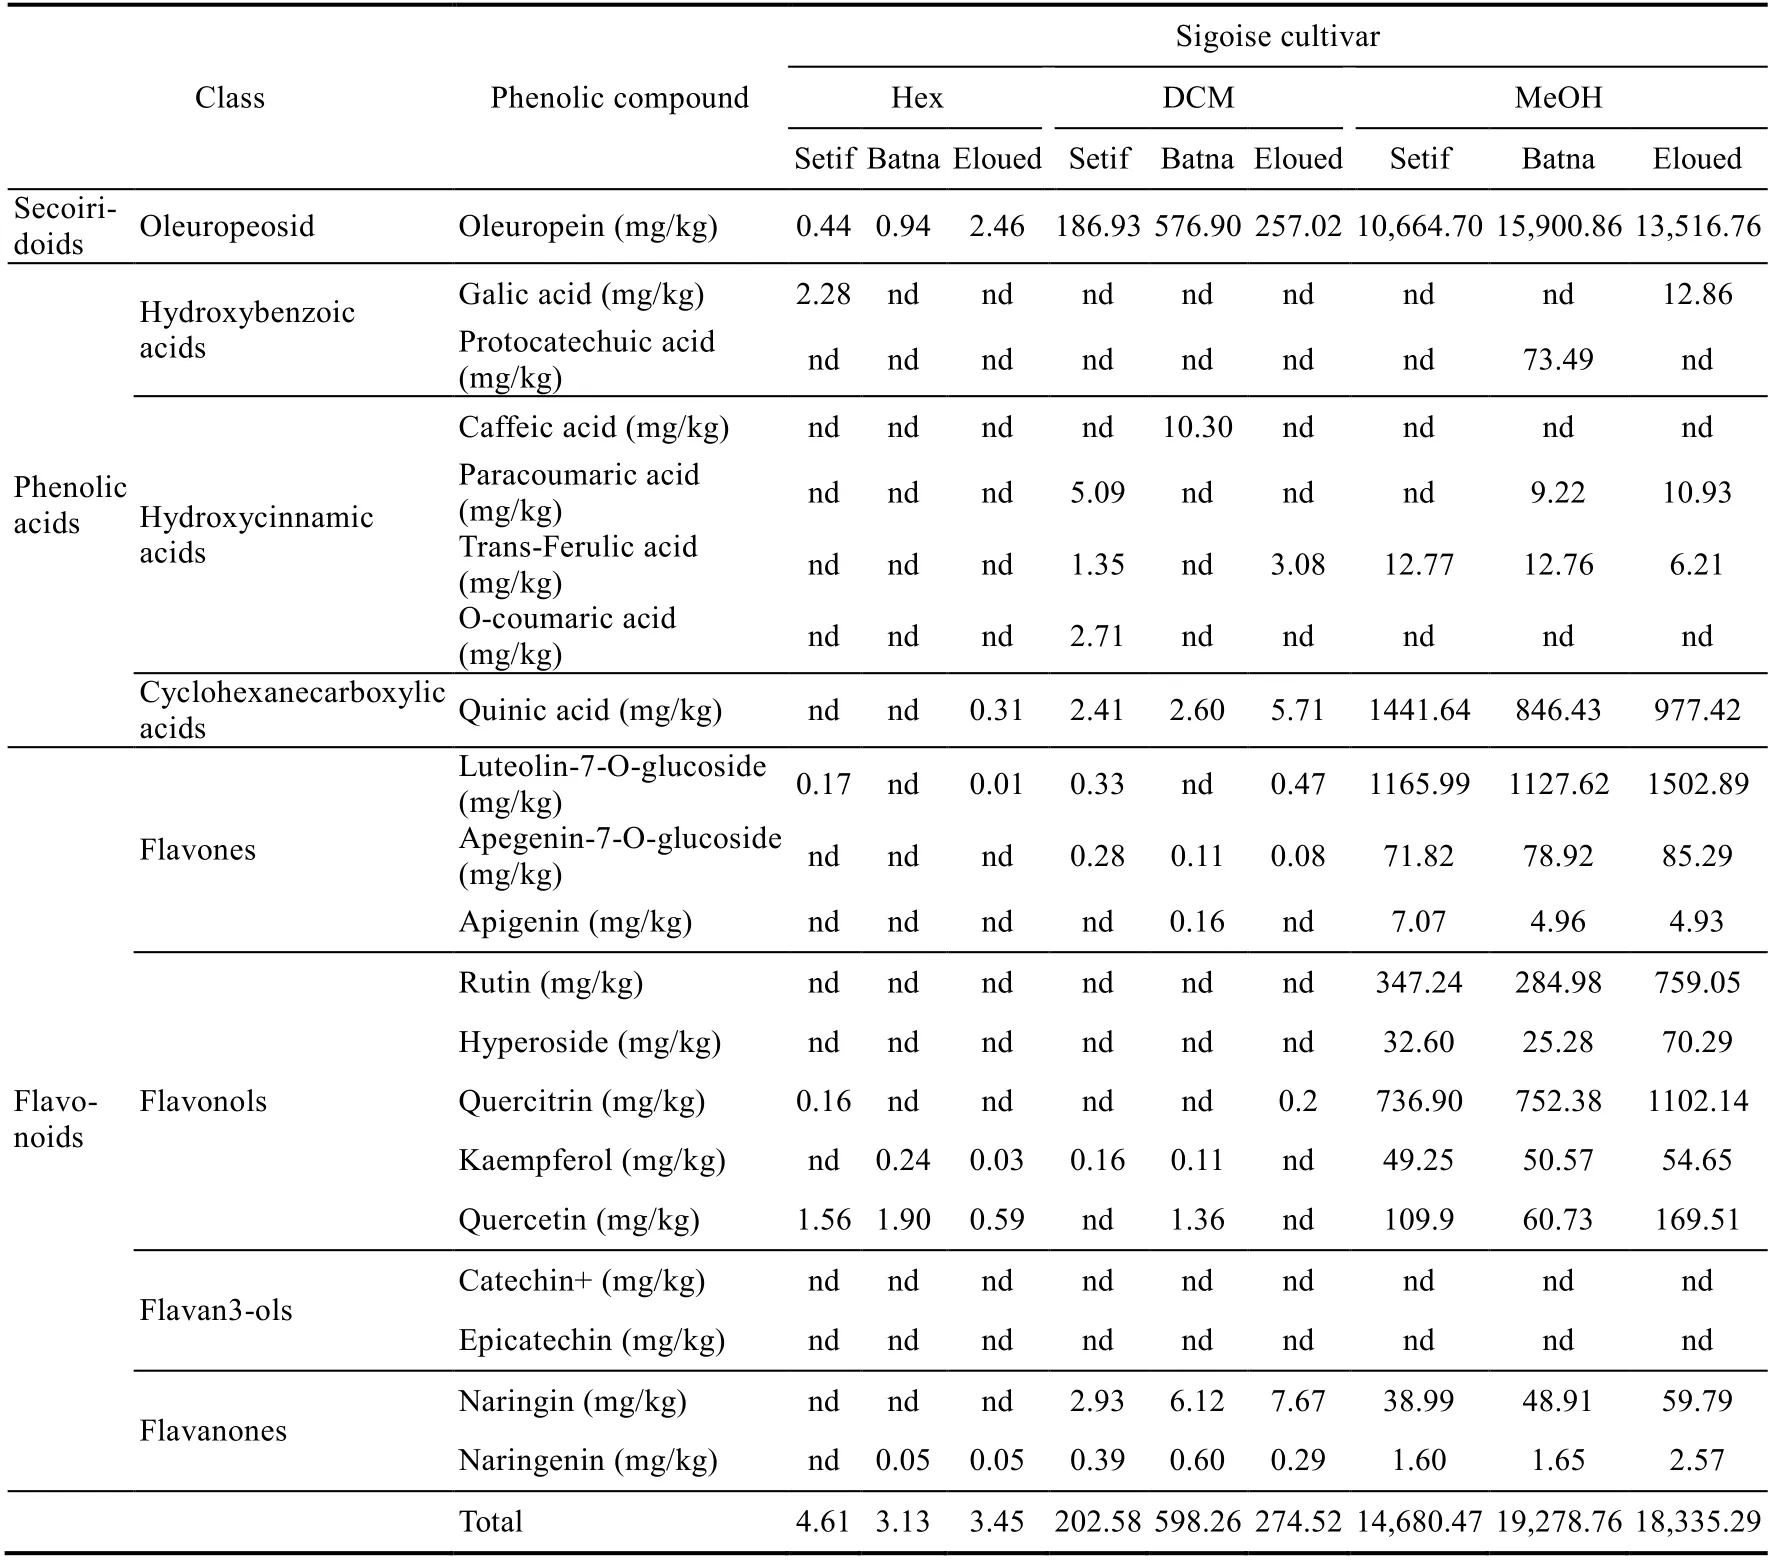
Table 3 Liquid chromatography-mass spectrometry analysis of phenolic compounds extracted using organic solvents (hexane, DCM, and MeOH) in leaves of Sigoise cultivar in the three different geographical regions(Setif, Batna, and Eloued)
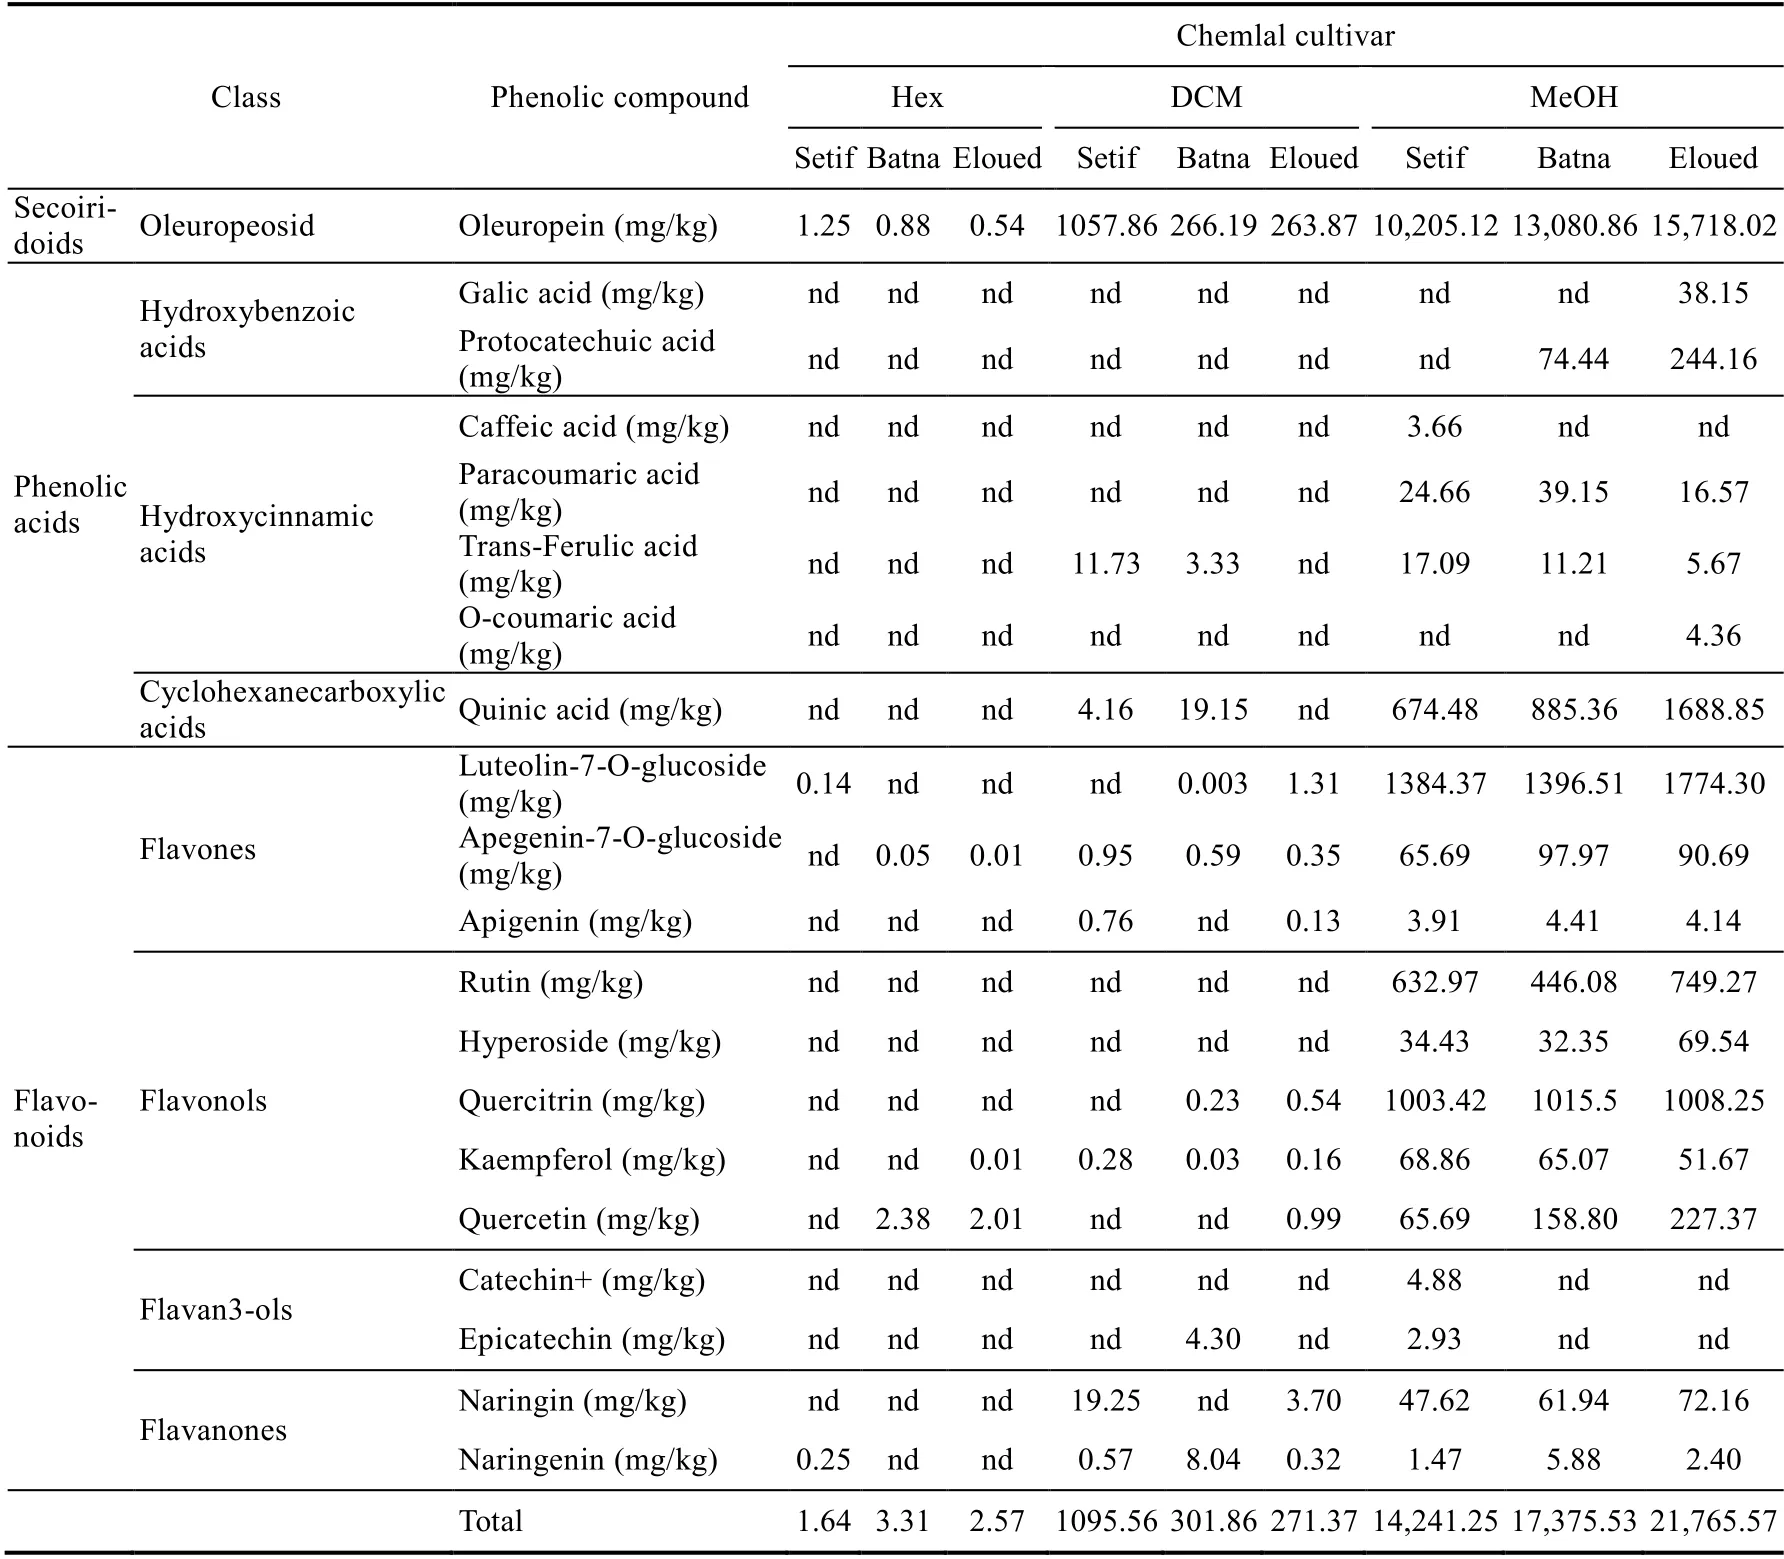
Table 4 Liquid chromatography-mass spectrometry analysis of phenolic compounds extracted using organic solvents (hexane, DCM, and MeOH) in leaves of Chemlal cultivar in the three different geographical regions(Setif, Batna, and Eloued)
Then, we can classify the detected phenolic compounds according to their families in three categories: (1) phenolic acids (quinic acid, gallic acid, protocatechuic acid, caffeic acid,p-coumaric acid, o-coumaric acid, and trans ferulic acid); (2) oleuropeoside (oleuropein); and (3)flavonoids (flavan3ols (catechin+ and epicatechin), flavanones (naringenin and naringin),flavones (apigenin, luteolin-7-o-glucoside, and apigenin-7-o-glucoside), and flavonols (rutin,hyperoside, quercitrin, kaempferol, and quercetin)).
The differences in the contents of the phytochemical compositions in the leaf extracts of the Chemlal cultivar in the three different geographical regions are illustrated in Figure 2. Leaf extracts of the Chemlal cultivar in the Eloued region were the most enriched in all phenolic compounds except for flavan3ols, which was not detected (Fig. 2). However, the lowest contents of the detected phenolic compounds were recorded in olive leaves from the Setif region (Fig. 2).
Divergent data were reported regarding the richness of olive leaves in the phenolic compounds.These differences may be due to variety, temperature, drying duration, ripening, time of harvest(Al Juhaimi et al., 2018), and geographical location (di Donna et al., 2010). In addition, Bilgin and ?ahin (2013) reported that the phenolic profile of olive leaves is affected by several agronomic and technological factors such as leaf age, degree of maturity, geographical location,variety, phonological stage at sampling, the proportion of brunch on the tree, moisture content,degree of soil contamination, and industrial extraction processes (Ahmad-Qasem et al., 2013).
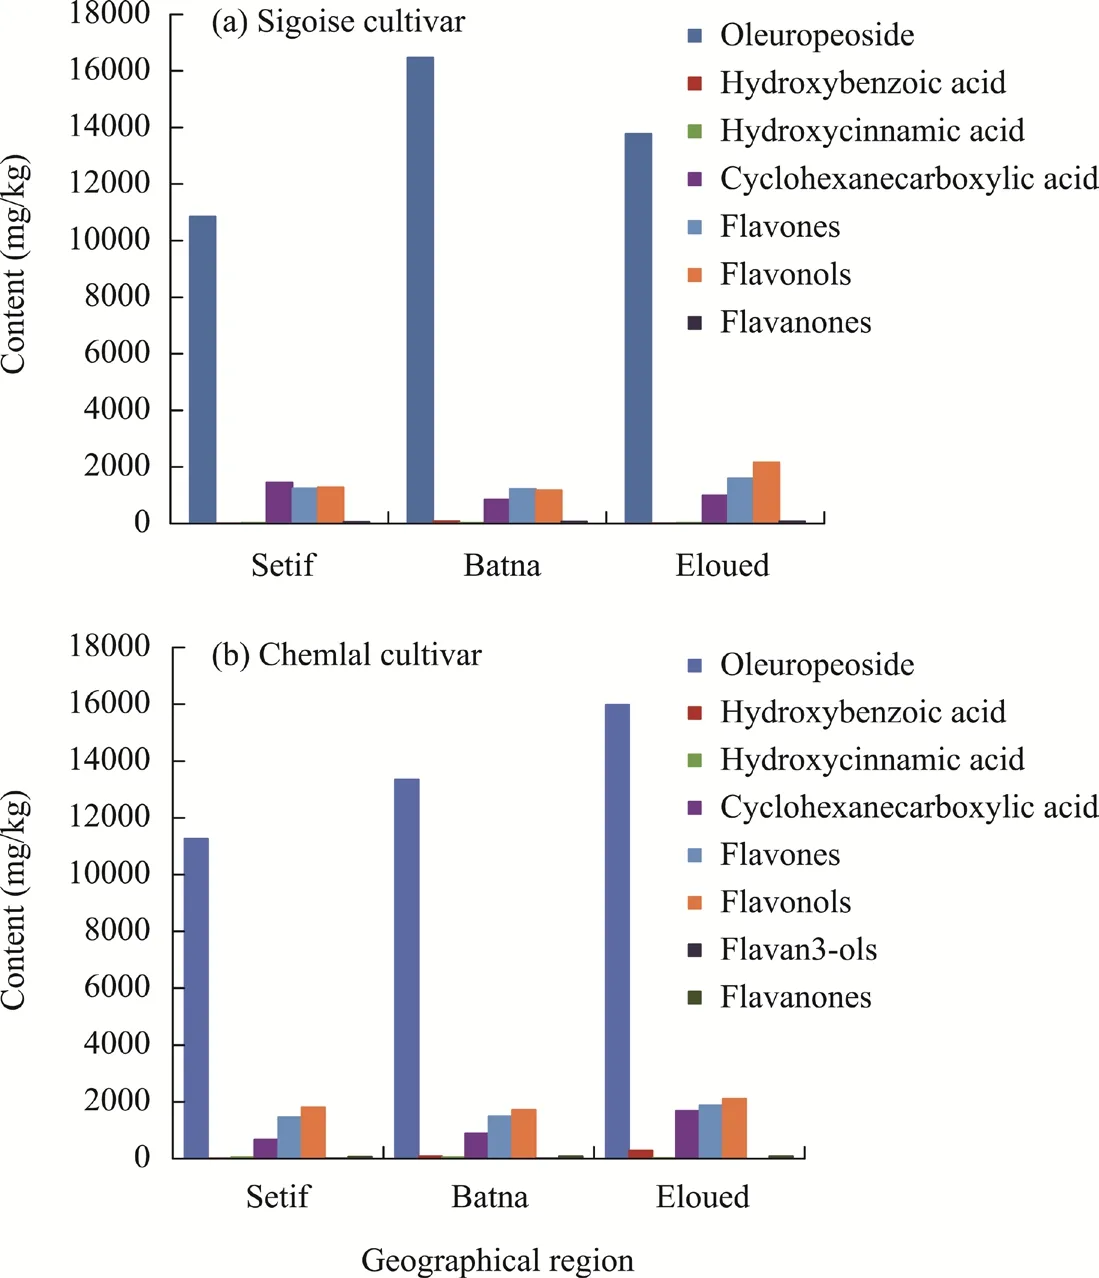
Fig. 2 Liquid chromatography-mass spectrometry analysis on the contents of the phenolic compounds in olive leaves of the Sigoise cultivar (a) and Chemlal cultivar (b) in the three different geographical regions (Setif, Batna,and Eloued)
3.4 Antioxidant activity
We analyzed the olive leaf antioxidant activity based on its scavenging capacity of free DPPH radical (Table 2). The IC50value was inversely related to the antioxidant capacity of the extract,expressing the number of antioxidants needed to scavenge 50.0% of free DPPH radicals.Therefore, the lower the IC50value, the higher the antioxidant activity.
It was found that the antioxidant activity was slightly improved with increasing aridity for both cultivars (Table 2). The most potent antioxidant capacity was recorded in the leaves of Sigoise cultivar from the Eloued region and the Chemlal cultivar from the Batna and Eloued regions(Table 2). In addition, it could be stated that for the two cultivars, the highest antioxidant activity of the olive leaf extracts in the Batna and Eloued regions was correlated with the higher contents of the total polyphenols and flavonoids (Table 2) and oleuropein (Tables 3 and 4). The olive leaf extracts were an essential source of antioxidants, such as the total phenolic compounds and flavonoids (Tables 3 and 4), which exhibited effective antioxidant activity (Condelli et al., 2015;Borjan et al., 2020; Martín-García et al., 2022). The high levels of oleuropein recorded in the methanolic extracts of both cultivars (Tables 3 and 4) seemed to be the most crucial phenolic compound conferring antioxidant capacity to olive leaves (Lins et al., 2018). Statistical data showed that antioxidant capacity was concomitantly affected by both cultivar type and geographical location.
3.5 Cytotoxic activity
Cytotoxic activity of the organic extracts against HCT116 and Caco-2 cell lines was performed using the MTT assay, which is reliable for detecting cell proliferation. It could be observed that the cytotoxic activity of leaves from the Chemlal cultivar was affected by the extraction solvent and geographical location (Fig. 3).
The strongest cytotoxic activity against the HCT116 cell line was recorded in leaves of the Chemlal cultivar from the Batna region and extracted with hexane, with the inhibition of reaching over 70.0% (Fig. 3a). Extracts with MeOH from the Chemlal cultivar displayed the weakest anti-HCT116 activity, with the inhibition ranging from 20.0% to 29.0%. The organic extracts from the Sigoise cultivar showed a lower activity against the HCT116 cell line, which did not exceed 50.0%.
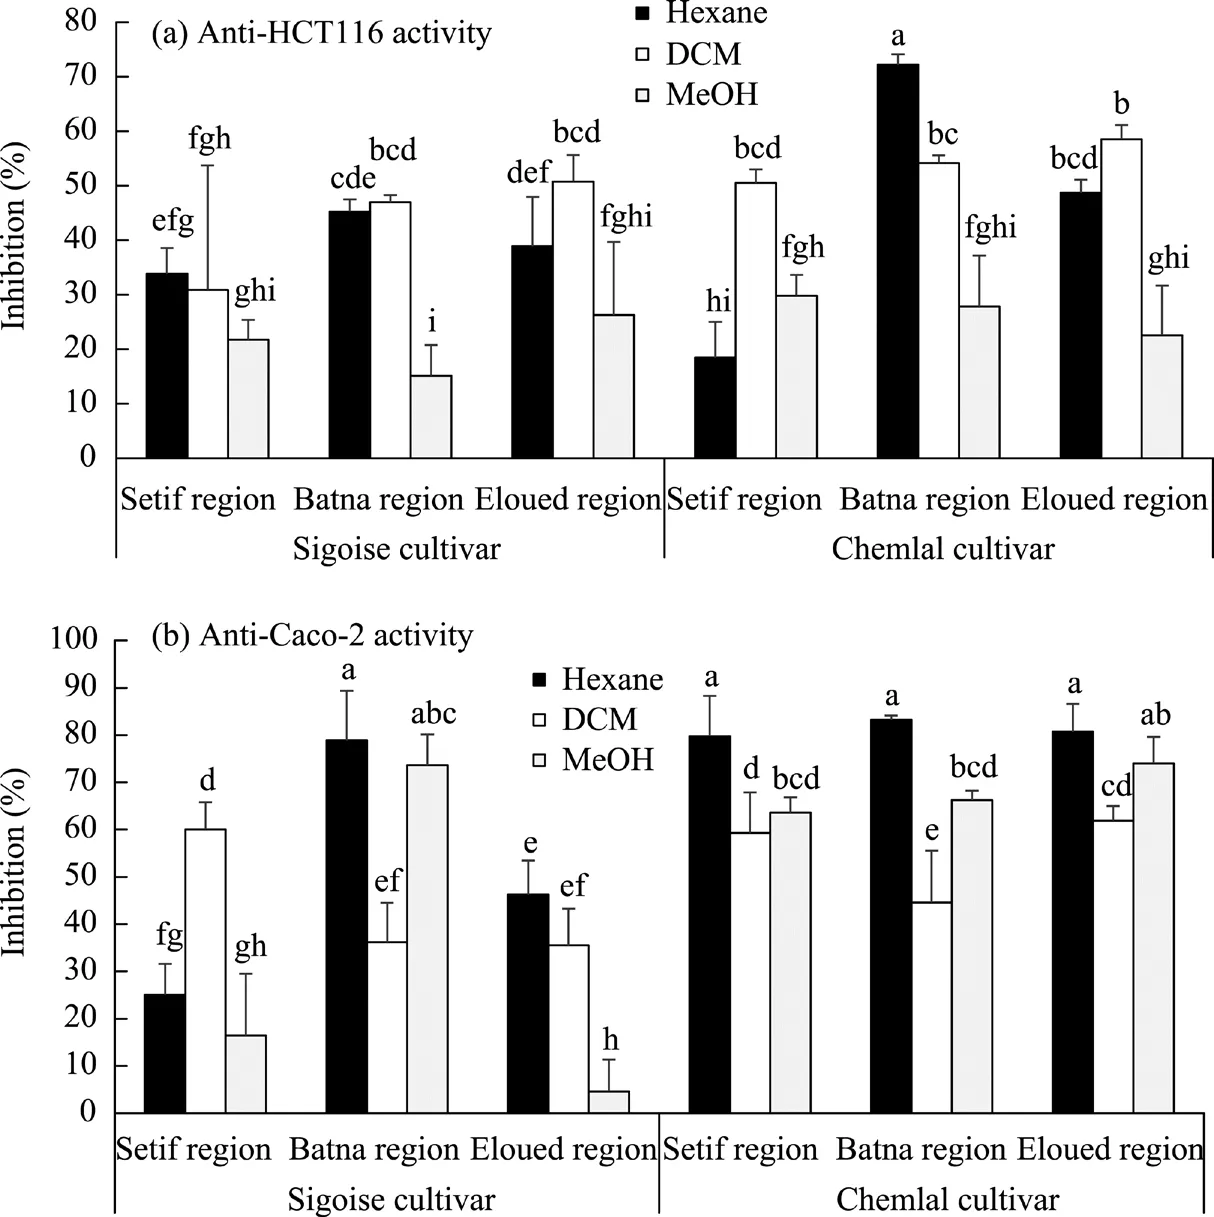
Fig. 3 Changes in the anti-HCT116 (a) and anti-Caco-2 (b) activities of the olive leaf extracts using organic solvents (hexane, dichloromethane (DCM), and methanol (MeOH)) in the Sigoise and Chemlal cultivars in the three different geographical regions (Setif, Batna, and Eloued). Different lowercase letters indicate significantly different values at P≤0.05 level according to the Fisher's LSD test.
The better activity of both cultivars was recorded against the Caco-2 cell line (Fig. 3b). The potent anti-Caco-2 activity of about 80.0% was measured in the hexane extracts from the Chemlal cultivar in all geographical regions and from the Sigoise cultivar in the Batna region (Fig. 3b). On the other side, the weakest anti-Caco-2 activity was obtained for the organic leaf extracts from the Sigoise cultivar in the Eloued region (Fig. 3b). Indeed, the olive leaf extracts exhibited a strong cytotoxic activity against various cancer cell lines (Antoniou and Hull, 2021), including the human colon (Hashim et al., 2008; Corona et al., 2009; Terzuoli et al., 2016), pancreatic(Goldsmith et al., 2015), and leukemia (Abaza et al., 2007).
Accordingly, it could be concluded that both olive cultivars' hexane extracts behave with the highest anti-tumoral capacity relative to the dichloromethane (DCM) and methanol (MeOH) ones.Conversely, the accumulative content of oleuropein was low in the leaf hexane extracts (Tables 3 and 4). Therefore, the anti-cancer capacity of the leaf extracts from both cultivars could not be attributed only to oleuropein but also to other biomolecules. They can also be the results of the synergetic effect. Ruzzolini et al. (2018) suggested that olive leaf extract enriched in oleuropein could be more effective when other polyphenols are present.
However, de Marino et al. (2014) found that in olive tree leaves, there were other compounds in addition to oleuropein, such as secoxyloganin and tyrosol, which are of high anticancer potential. Statistically, there was a significant difference in cytotoxic activity against Caco-2 among all factors, but the anti-HCT116 activity was mostly affected by geographical location and solvent polarity, as well as their interaction (Table 5).

Table 5 Results of P values and the related significance levels for the anti-HCT116 and anti-Caco-2 activities of the olive leaf extracts using organic solvents (hexane, DCM, and MeOH) in the Sigoise and Chemlal cultivars in the three different geographical regions (Setif, Batna, and Eloued)
3.6 Data statistical analysis
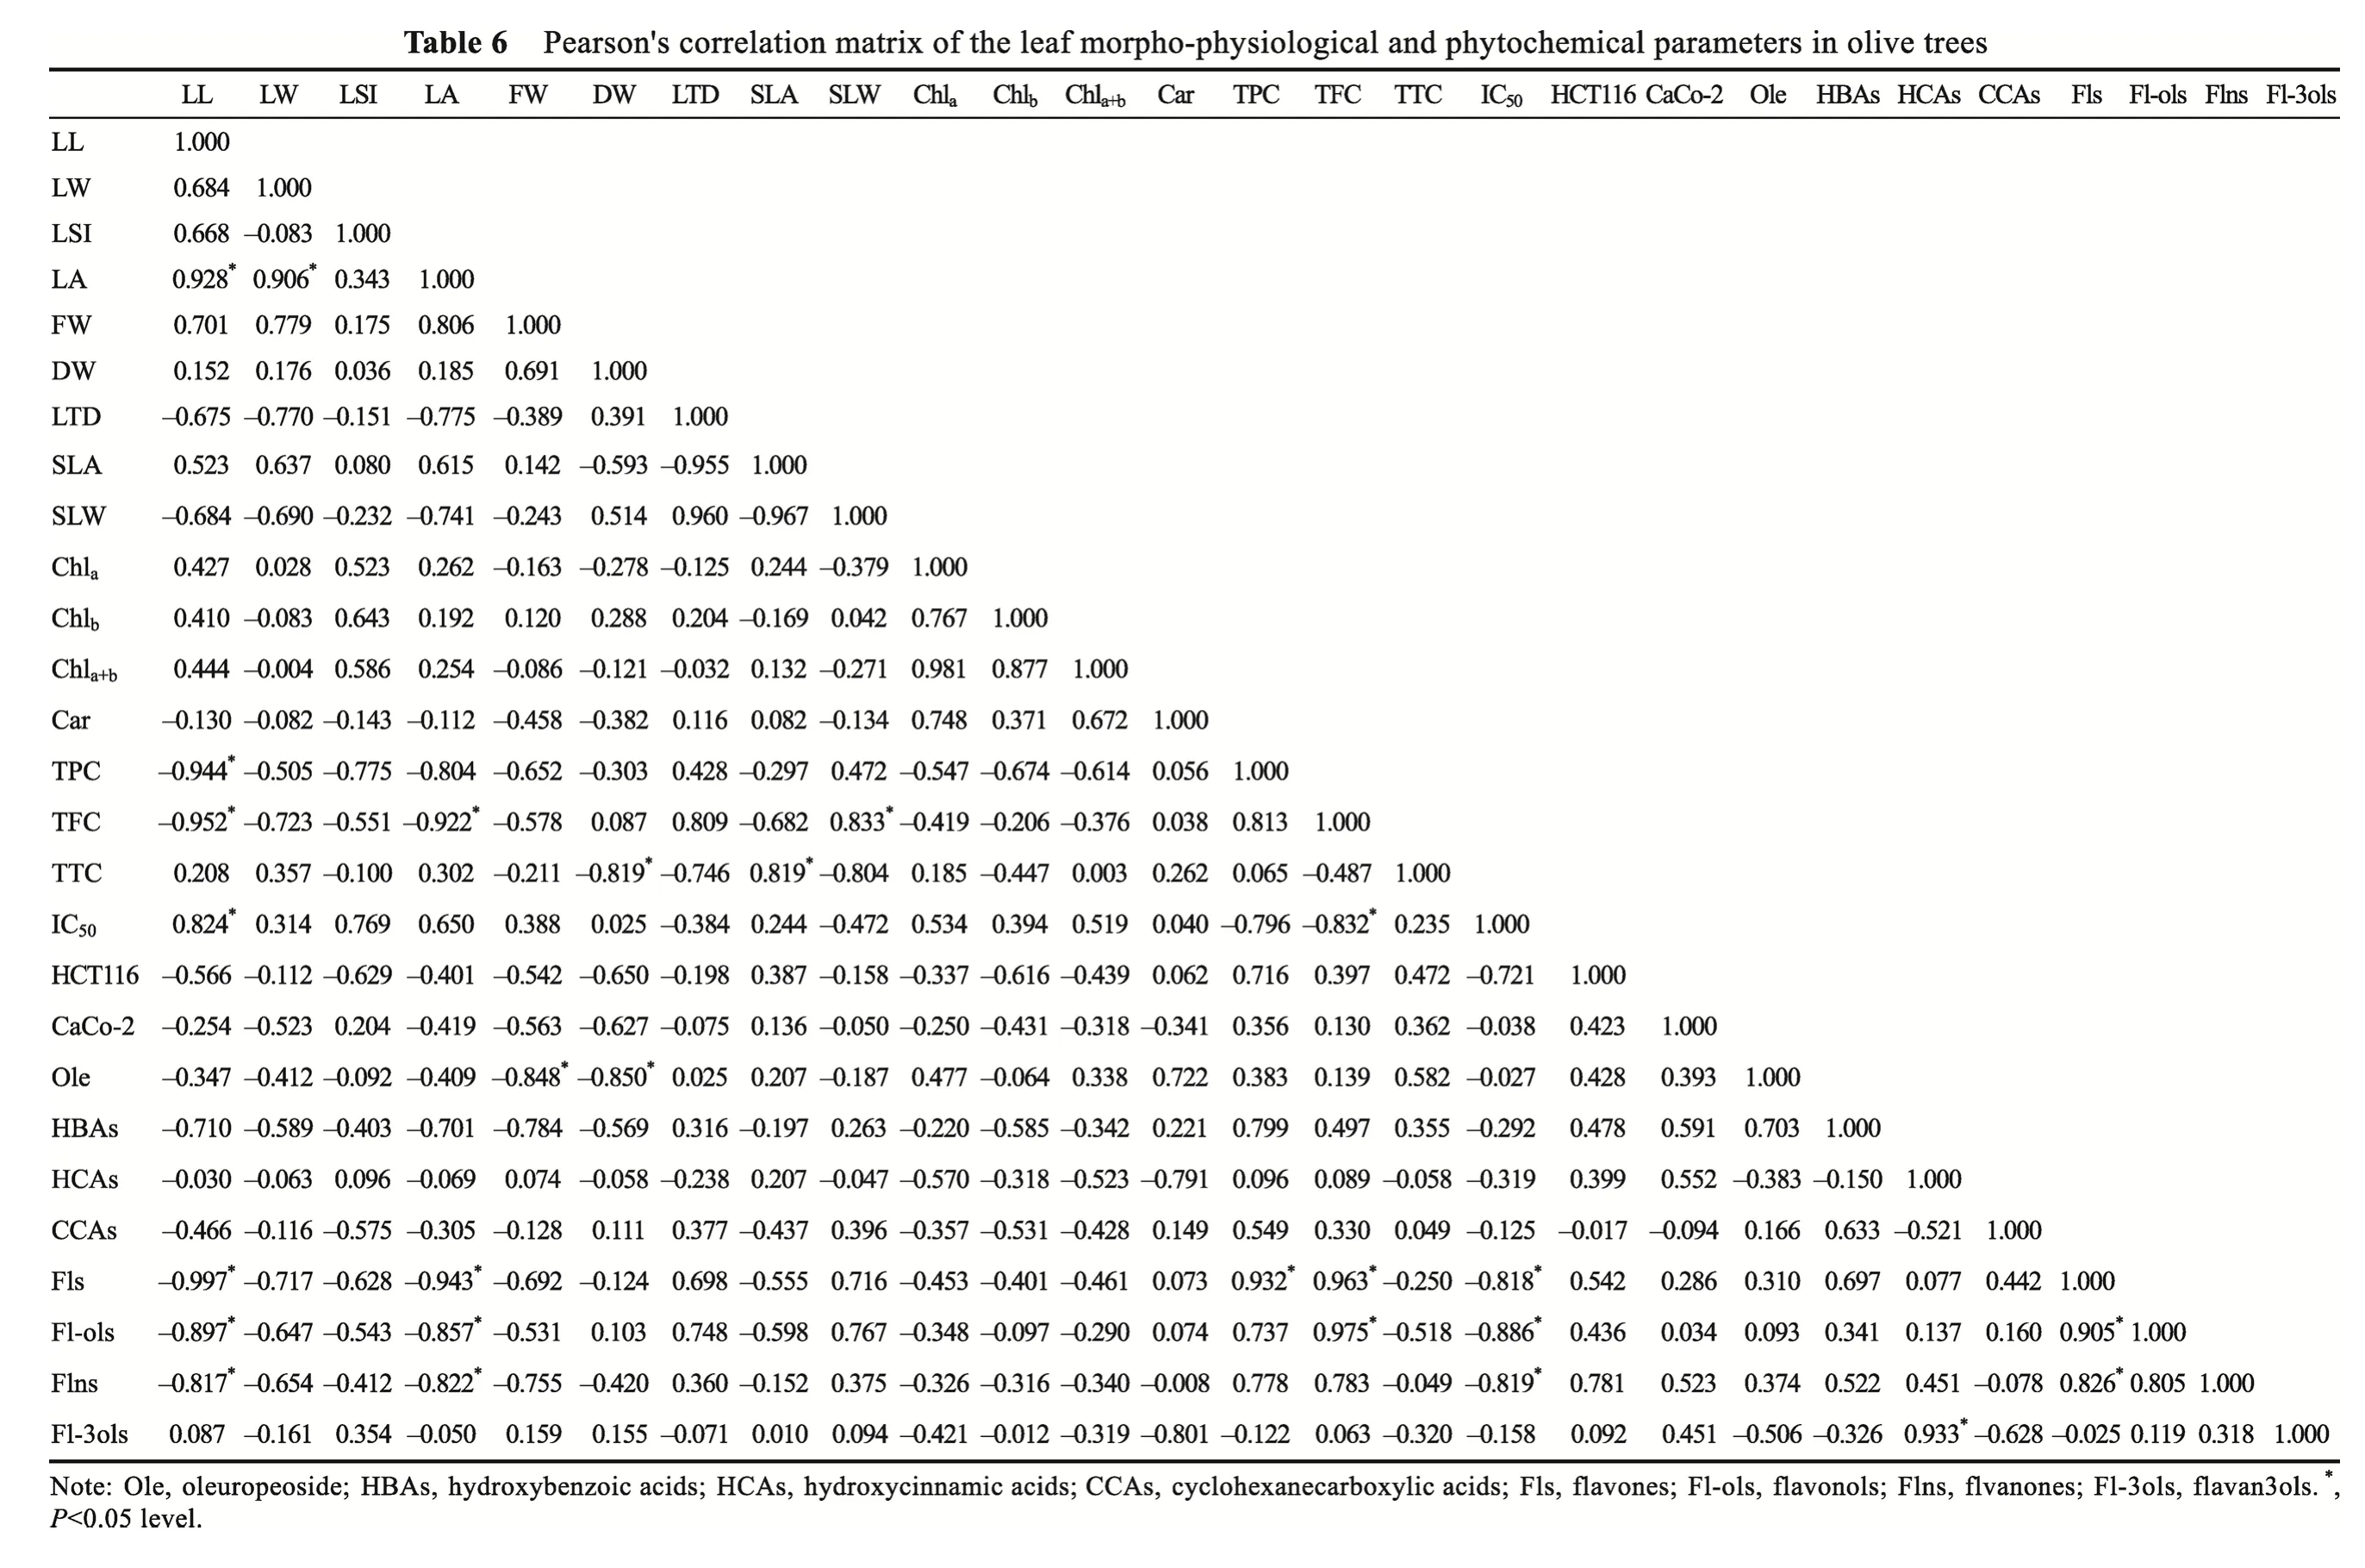
Pearson's correlation matrix was used to analyze the descriptors of morpho-physiology,photosynthetic pigment concentration, phenolic content, antioxidant, and cytotoxic activity of the studied cultivars in the different geographical regions to illustrate the associations of individuals or the links between variables (Table 6). Our analysis revealed that the cytotoxic activity against the HCT116 cell lines exhibited positive correlations with the flavanones and flavones, while the cytotoxic activity against the Caco-2 cell line showed positive correlations with the hydroxybenzoic and hydroxycinnamic acids (Table 6). Conversely, a weak correlation was reported between the anti-cancer activities (anti-HCT116 and Caco-2 cell lines) and the contents of flavan3ols and flavonols (r=0.092 andr=0.034, respectively).
PCA analysis showed that the two axes (PC1 and PC2, where PC is the principal component)explained most of the observed variability (62.84%), the first of which was the most significant,at 42.28% of the total inertia (Fig. 4). There was a positive correlation between flavones and the variables related to both cultivars in the Eloued region, which were particularly affected by the leaf tissue density, specific leaf weight, cyclohexanecarboxylic acids, hydroxycinnamic acids,flavan3ols, total flavonoid content, flavonols, flavones, flavanones, and total phenolic content;likewise, for Chemlal cultivar in the Batna region, the variables included the hydroxybenzoic acids, cytotoxic activities against the HCT116 and Caco-2 cell lines, oleuropeoside, and total carotenoid content. On the other hand, the second axis accounted for 20.56% of the total inertia,and it showed a positive correlation for the variables related to both cultivars in the Setif region,including chlorophyllb, leaf dry weight, leaf fresh weight, leaf shape index, leaf length, IC50, and total carotenoid content.
The PC1 and PC2 axes of the two cultivars can be divided into four groups. The first one was composed of the Sigoise cultivar in the Eloued region, which was situated on the positive side of the PC1 and PC2 axes (Fig. 4). The second group was composed of the Chemlal cultivar in the Eloued and Batna regions, which was placed on the negative side of the PC1 axis and on the positive side of the PC2 axis. The third group included both cultivars in the Setif region and was located on the positive side of the PC1 axis and on the negative side of the PC2 axis. The last group included the Sigoise cultivar in the Batna region and was placed on the negative side of the PC1 and PC2 axes.
?
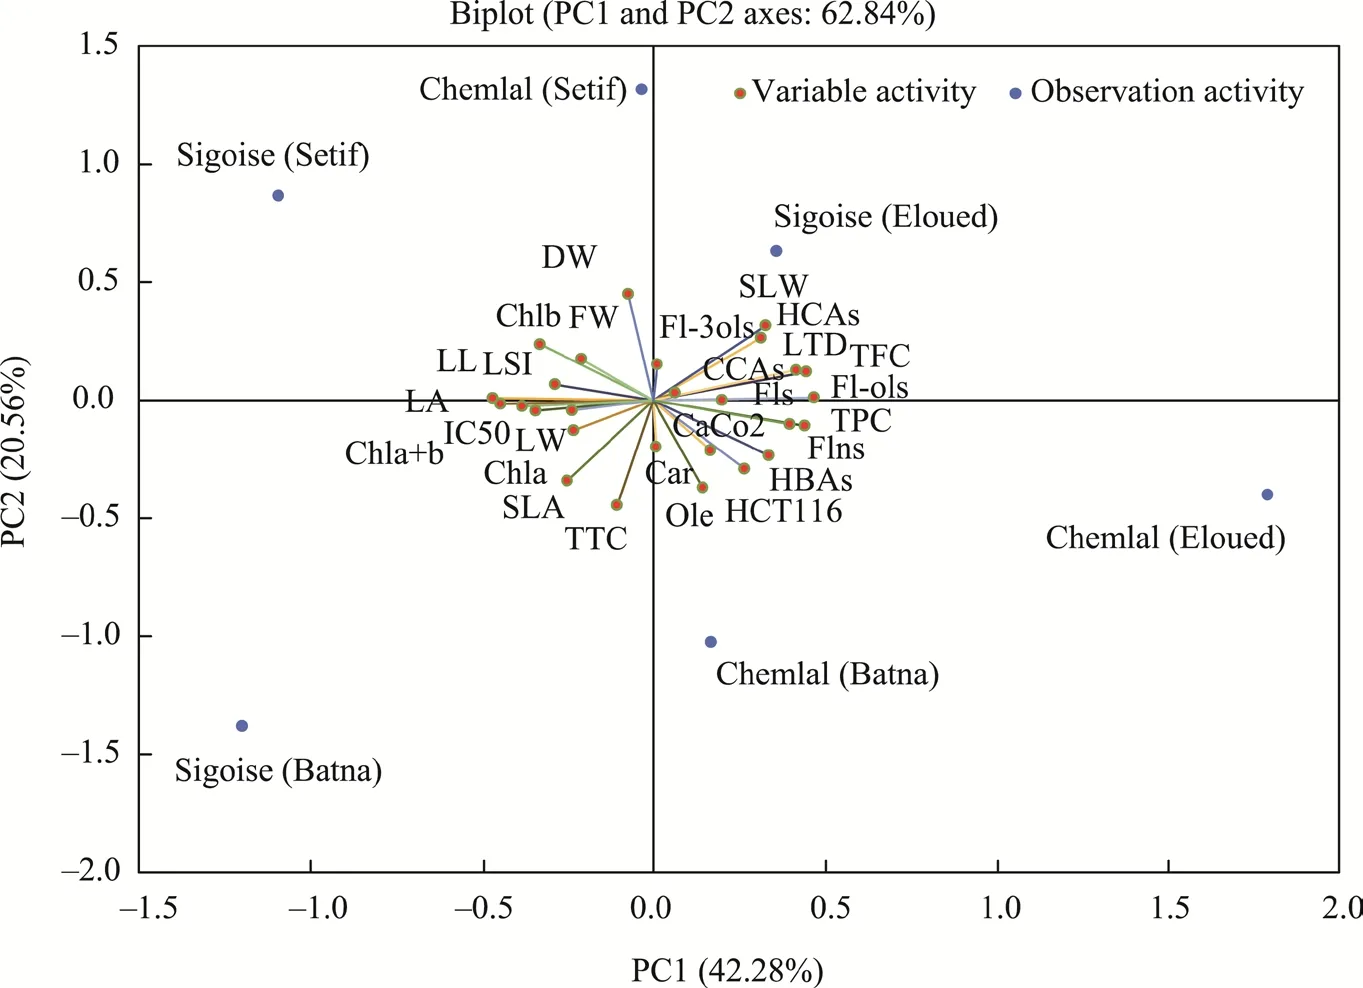
Fig. 4 Principal component analysis performed with all of the measured parameters of olive leaves collected from the Sigoise and Chemlal cultivars in the three different geographical regions (Setif, Batna, and Eloued). PC,principal component; LL, leaf length; LW, leaf width; LSI, leaf shape index; LA, leaf area; FW, fresh weight; DW,dry weight; LTD, leaf tissue density; SLA, specific leaf area; SLW, specific leaf weight; Chl, chlorophyll; Car,carotenoid; TPC, total phenolic content; TFC, total flavonoid content; TTC, total tannin content; IC50,half-maximal inhibitory concentration; Ole, oleuropeoside; HBAs, hydroxybenzoic acids; HCAs,hydroxycinnamic acids; CCAs, cyclohexanecarboxylic acids; Fls, flavones; Fl-ols, flavonols; Flns, flavanones;Fl-3ols, flavan3ols.
The PCA results also reported significant distinctions in the morpho-physiological parameters,phenolic content, antioxidant activity, photosynthetic pigment content, and cytotoxic activity between the two cultivars according to the geographical location (Fig. 4).
4 Conclusions
The Sigoise and Chemlal cultivars were growing on non-saline, alkaline, and carbonated soils.Both cultivars grown on poor sandy soils in arid climate in the Eloued region. Assessment of leaf morpho-physiological parameters in olive trees revealed that geographical location affected the leaf shape index. Nevertheless, the leaf tissue density, specific leaf weight, and leaf area were unchanged for both cultivars, which may sustain sufficient photosynthetic capacity among changes in climatic conditions associated with geographical location. The total phenolic content increased with aridity, and the oleuropein was the most abundant phenolic acid in leaves of both cultivars. The highest oleuropein content in the methanolic leaf extracts from the Batna and Eloued regions was associated with better antioxidant capacity. However, the most robust cytotoxic activity against the HCT116 and Caco-2 cell lines was unrelated to the oleuropein richness in leaves of both cultivars. Statistical analysis showed that the cytotoxic capacity was positively correlated with other bioactive compounds such as flavanones and hydroxybenzoic acids. All obtained results argued that introducing Sigoise and Chemlal cultivars in a geographical location with increasing aridity was associated with the leaf morpho-physiological adaptions,phenolic acids, flavonoid enrichment, and leaf bioactivity improvement.
A further experiment is suggested (i) to assess the impacts of a combined effect of cultivar type and geographical location on the growth and yield of olive trees and (ii) to identify the active molecule regulating antioxidant and anti-cancer potentialities from crude leaf extracts.
Acknowledgements
We are grateful to Dr. Khaled JEBAHI from the English Language Institute, KING ABDULAZIZ University,Saudi Arabia for his effort on English editing of this article.
- Journal of Arid Land的其它文章
- Antelope adaptations to counteract overheating and water deficit in arid environments
- Competition, spatial pattern, and regeneration of Haloxylon ammodendron and Haloxylon persicum communities in the Gurbantunggut Desert,Northwest China
- Leaf stoichiometry of Leontopodium lentopodioides at high altitudes on the northeastern Qinghai-Tibetan Plateau, China
- Manipulated precipitation regulated carbon and phosphorus limitations of microbial metabolisms in a temperate grassland on the Loess Plateau, China
- Effects of native and invasive Prosopis species on topsoil physiochemical properties in an arid riparian forest of Hormozgan Province, Iran
- Contents and spatial distribution patterns of heavy metals in the hinterland of the Tengger Desert, China

