Performance and genetic diversity of 23 provenances of northern red oak (Quercus rubra L.) after 25 years of growth in South Korea
Ki-Won Kim·Kyoung-Mi Lee·Soon-Ho Kwon·Ji-Min Park·Yang-Gil Kim·Hye-In Kang·Da-Bin Yum·Kyu-Suk Kang
Abstract Growth traits and genetic diversity of 23 provenances of Quercus rubra introduced from North America were analyzed in a provenance trial established with a randomized block design in Hwaseong,Gyeonggi,South Korea in 1993.Growth variables and survival at age 25 were compared with results from early stages.Height,DBH,volume and stem straightness of Q.rubra was better than those of the domestic oak (Quercus accutissima).Growth of the Dunham Island provenance from New York was the best among the 23 provenances that of the Eagle River provenance from Wisconsin was poorest.Survival rate at age 25 was on average 52%.The longitude of seed origin and growth of provenance were consistently significantly negatively correlated at all ages.Growth of coastal provenances was superior to that of the inland provenances,which were separated by the Appalachian Mountains.Genetic diversity and genetic distance among the provenances were evaluated using microsatellite markers.The allelic frequencies showed high polymorphism in 10 microsatellite loci,and 292 alleles were found.Of 10 loci,two were commonly found in the 23 provenances.The mean allelic diversity and heterozygosity observed among the provenances were similar to those from the native populations of Q.rubra in North America.Nei′s genetic distance among the 23 was estimated and showed that a clear trend between geographic and genetic distances,indicating that some provenances have high genetic diversity with superior growth performance.
Keywords Introduction breeding·Provenance test ·Adaptation·Microsatellite marker·Genetic distance
Introduction
Northern red oak (Quercus rubraL.) is a deciduous,broadleaved tree that is distributed at 1700 m above sea level in the mideastern United States and southeastern Ontario of Canada (Godfrey 1988).Its cold resistance is strong,so it can grow below ? 40 °C.Its excellent durability and elasticity in North America (Sander 1990) makes it especially good as flooring and construction lumber.In South Korea,the price of oak imported from North America is very expensive,while most of the domestic oak trees,such as sawtooth oak (Q.acutissima) are used to produce oak mushroom and charcoal.
As a part of breeding programs to develop hardwood varieties and improve timber quality,seeds of northern red oak were introduced to South Korea from various countries in 1972 and growth and adaptation compared among provenances.The results showed that provenances from North America origins had better growth and adaptability than those from other countries (Ryu et al.2004;Cho et al.2013).Therefore,23 additional provenances from North America(the United States and Canada) were introduced in 1991 and have been tested for adaptability and growth.
Very little research has focused on growth differences among the provenances of northern red oak at early ages in South Korea.For trees at age 14,Ryu et al.(2 004) reported that growth performances differed significantly different among eight provenances;a United States provenance (Missouri) was the best,a Canadian provenance (Simcore) the worst.They also stated that northern red oaks that came from higher latitudes or altitudes than those of Korean plantation should not be introduced.Genetic differences in growth characteristics among provenances might be revealed at the early age,whereas geographical origin of seed might be correlated with growth performance and genetic diversity of northern red oak at a mature age.However,until now,genetic diversity and DNA markers have not been studied for northern red oaks in South Korea.
The main purposes of the present study were to measure height,DBH,volume and stem straightness of 23 provenances at age 25 years and compare them with data from the early stages,to test for significant differences in growth characteristics and adaptability among provenances,and to select superior provenances to produce seeds for plantations in South Korea.In addition,the genetic variation among 23 provenances was analyzed using DNA markers and discussed in terms of selecting genetic resources.
Materials and methods
Study materials
For testing adaptability of northern red oak to conditions in South Korea,seeds of 23 provenances native to the United States and Canada were introduced in 1991 and sown in the nursery of the Department of Forest Bioresources of the National Institute of Forest Science,South Korea in April 1992.Seedling were then transplanted in three replications(randomized block design) in Hwaseong,Gyeonggi Province (37°16′56"N,126°55′17"E,88 m a.s.l.) in April 1993.Domestic sawtooth oak (Q.accutissima) was planted as a control species.Origins of the provenances are presented in Table 1.
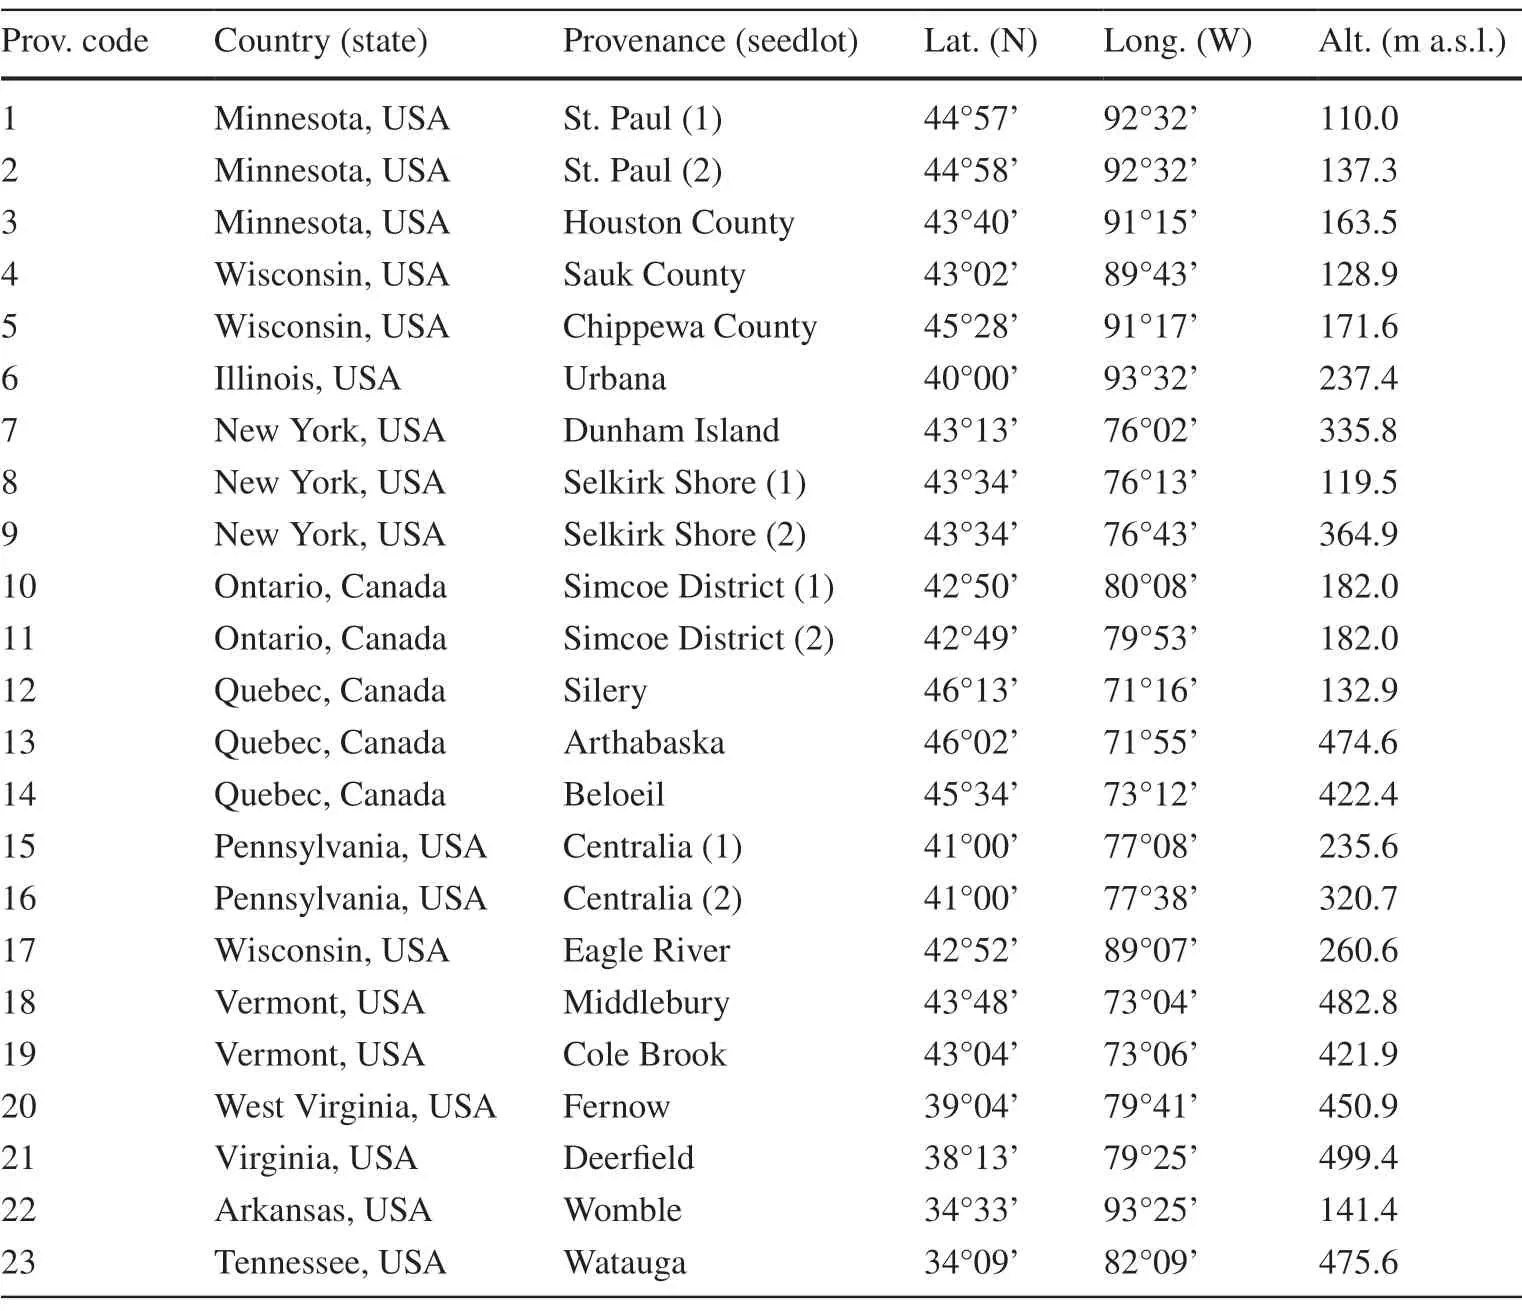
Table 1 Geographic information (seed origin,latitude [Lat.],longitude[Long.] and altitude [Alt.]) on the 23 provenances of Quercus rubra used in this study
Analysis of growth characteristics
A total of 23 provenances were examined for height,diameter at breast height (DBH),volume,stem straightness and survival rate.The growth data from early stages werecollected from Ryu et al.(2004) and Cho et al.(2013) and compared to our results northern red oaks at 25 years of age.Tree height and DBH were surveyed for all individuals in the test sites.The individual volume (V) was calculated based on the investigated height and DBH asV=(Π/4)hd2f,wherehis the height,dis the diameter at breast height andfis the factor of breast height form.Pearson’s product correlation coefficients were estimated among geographic origin variables and growth characteristics.
The stem straightness was cited from Kleinschmit et al.(1975) and the straightness scores were assigned to a grade from 1 to 6 as shown in Fig.1.Slenderness ratio analysis was also performed to determine growth stability.

Fig.1 Standard grades (1 to 6)to score stem straightness for Quercus rubra
All statistical analyses were conducted using R version 3.1.3 (R Core Team 2012) to determine the significance of any growth differences among the 23 provenances.Duncan′s post hoc test was performed to select provenances superior for growth performance and survival.In addition,t-tests were performed to compare differences in growth characteristics between inland and coastal groups,which were separated by the Appalachian Mountains.
DNA marker variation and genetic diversity
The genetic diversity and relationships among 23 provenances were analyzed using microsatellite markers developed by Aldrich et al.(2002).The DNA makers were applied to check for any differences in growth and survival between inland and coastal provenances based on the molecular levels and to compare representative introduced provenances to the natural populations in North America.
Genomic DNA from winter buds was extracted from 15 individuals per provenance and amplif ied by PCR.The PCR reaction was undertaken in 10 μL reactions having 30 ng of template DNA,1X Taq buffer A,1 mM dNTP Mix,1.2 mM MgCl2,2 μM RAPD primer and 1U Taq DNA polymerase.The PCR mixture was amplif ied with initial denaturation at 95 °C for 1 min followed by 50 cycles of 30-s denaturation at 94 °C,45-min annealing at 45 °C?53 °C and 1.5-min extension at 72 °C.At last,extended polymerization at 72 °C was done for 10 min.
10 primers were selected after pre-screening (Table 2).The amplif ied products were visualized by fluorescence using Applied Biosystem 3830 DNA Analyzer,and the size of loci was visualized using the GeneMapper program.
GeneAlEx ver 6.503 software (Peakall and Smouse 2012) was used to estimate the number of alleles observed per locus (A/L),number of effective alleles per locus (Ae/L),expected heterozygosity (He),and Shannon′s diversity index(I).
The degree of microsatellite variation and genetic diversity among 23 provenances was determined.Nei′s genetic distance was calculated to estimate the genetic distances among 23 provenances of northern red oak,and a neighbor-joining tree was constructed to identify the genetic relationship.
Results and discussion
Growth performance of the 23 provenances
For the 23 provenances ofQ.rubraat age 25,the average for tree height was 19.06 m and 12.87 cm for DBH (Table 3),greater than those for the control species,Q.accutissima(mean height:15.04 m,mean DBH:11.20 cm).Thus,the introduced oak was about 27% and 16% superior in height and DBH growth compared to the domestic oak.
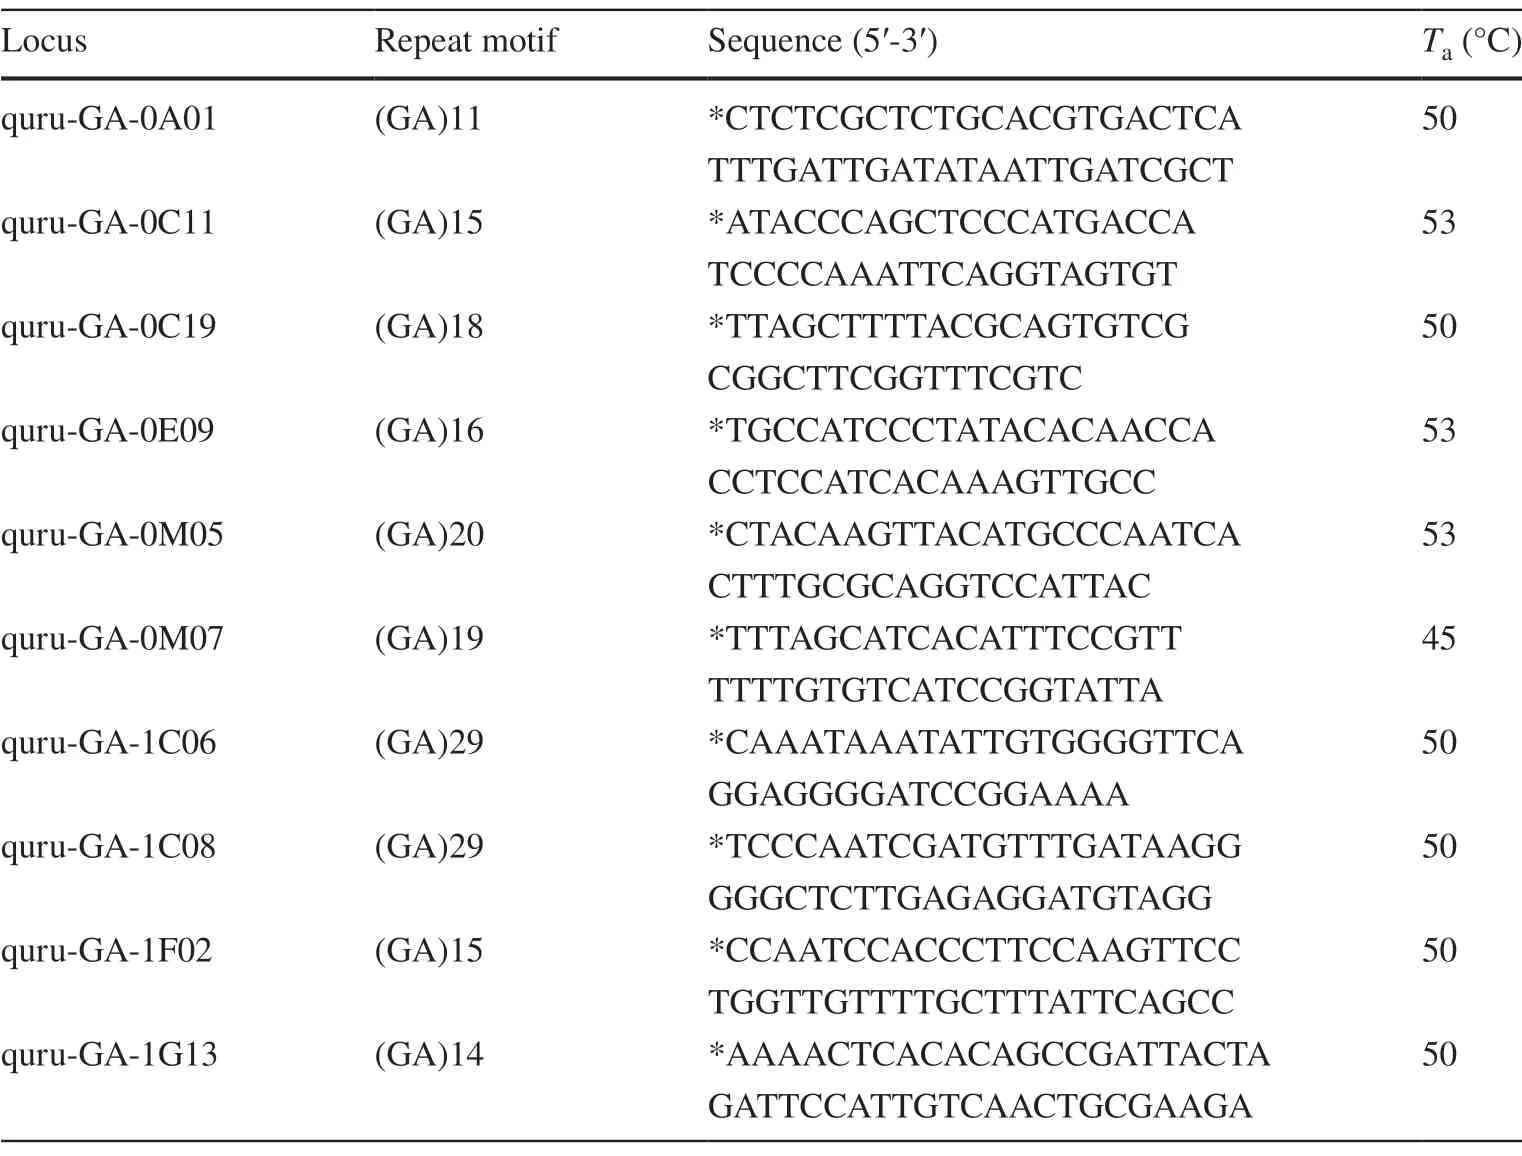
Table 2 Locus,motif and sequences of 10 microsatellite loci used to analyze genetic diversity among 23 provenances of Q.rubra
The Dunham Island and Middlebury provenances from the United States and the Arthabaska provenance from Canada were at the top for height growth for all ages,and the Eagle River provenance and Houston Country provenance from the United States were poorest.This result was similar to the research of Ryu et al.(2004),showing that the provenance with excellent height growth at age 4 was consistently superior at the age of 25.It is also coincident with the research that the good provenance at nursery also showed better growth at plantations (McGee et al.1986).
According to James et al.(1996),the average annual growth in height of northern red oak in six southern United States regions at 6 years old was ca 3.3 m.In South Korea,the annual growth in height of the introduced northern red oaks averaged 3.9 m when 8 years old,similar to the oaksgrowing in the natural distribution areas.The best provenance,Dunham Island,was 20.9 m tall at age 25,which was about 9.7% better than the average height for the introduced oaks.The poorest provenance,Eagle River,was 13.7 m tall,about 39.1% less than the average height of the introduced oaks.
The DBH growth at age 25 showed different patterns from 12 and 18 years of age.The best growth was Dunham Island provenance,the United States and the poorest was Eagle River provenance,the United States.In particular,the DBH growth of Eagle River provenance was lower than that of domestic oak for all ages.The Dunham Island provenance was superior with 15.3 cm of DBH,about 20% better than the average.The poorest provenance Houston Country was 10.1 cm that was 27% poor than the average.
The slenderness ratio,calculated as the ratio of height to DBH.Generally,the larger the ratio,the more likely the tree is to suff er damage from weather events such as snow and wind (Stephan 1996).The slenderness ratio of the Watauga provenance,which had with good growth in DBH was relatively smaller (1.32) than that (1.64) of the Womble provenance,which had good growth in height (Fig.2).These results imply that provenances with better DBH growth than height growth will be somewhat stable to meteorological stresses such as storm,cold and heat.
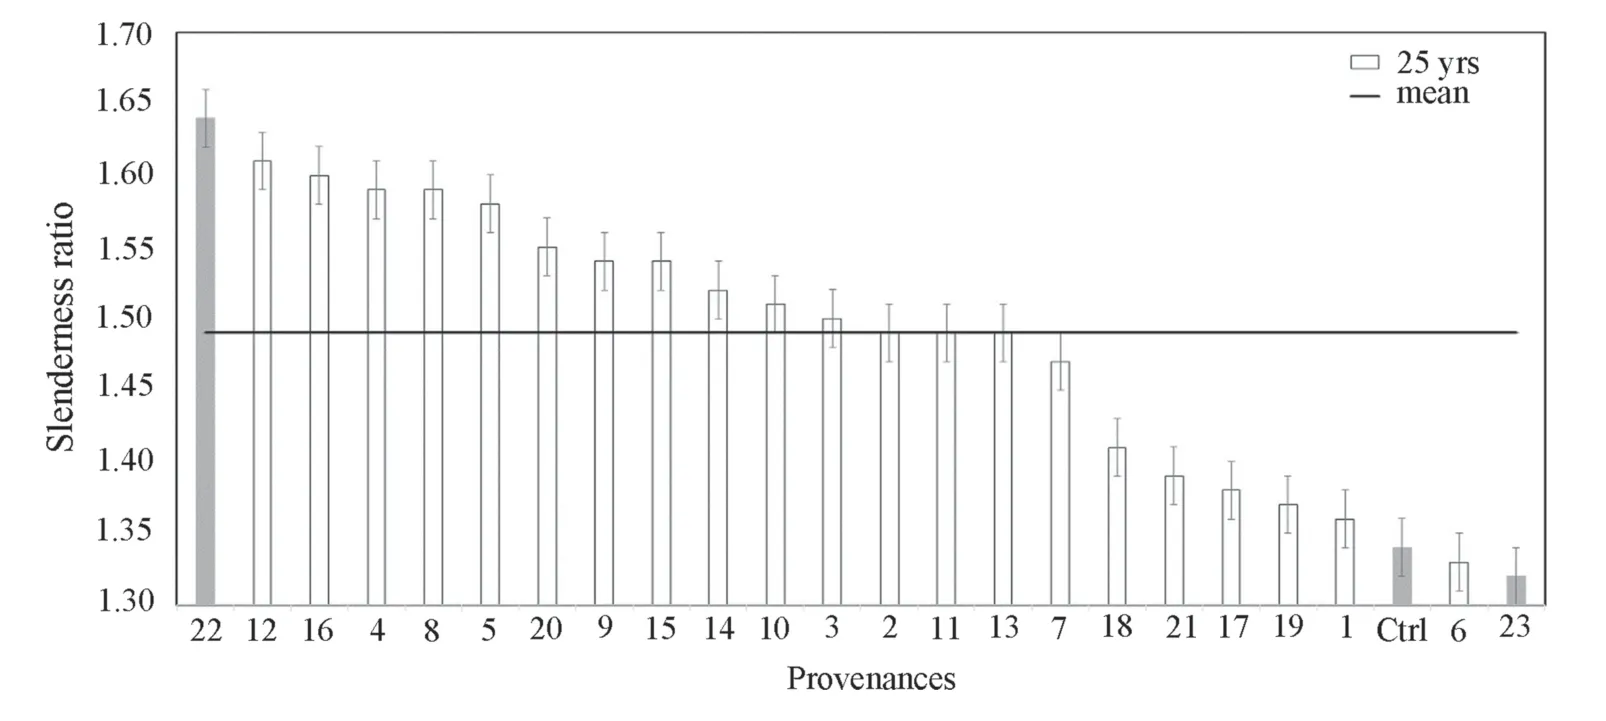
Fig.2 Mean (± SE) slenderness ratio (height/DBH) of the 23 provenances of Quercus rubra at age 25.The control is Korean native oak,Quercus acutissima
The higher the density of the stand,the larger the slenderness ratio.In the 1.3-ha study site of the northern red oaks,about 1700 trees survived;the high tree density should result in a relatively high slenderness ratio.The slenderness ratio is lower at young ages than mature stages,and commonly,slenderness ratios are smaller than one (Kwon et al.2007;Choi et al.2009).Therefore,the slenderness ratio of the northern red oak appears to be somewhat unstable in weather disasters compared to other introduced species in South Korea (Kwon et al.2007;Ryu et al.2013).
Pearson’s correlation showed that the latitude of seed origin was highly positive and significantly correlated with growth in volume,and longitude was negatively correlated with growth in height,DBH and volume (Table 4).Also,the negative correlation between longitude and growth characteristics held as the age increased,indicating that northern red oak trees introduced from lower longitudinal areas(coastal) could be better than the high longitudinal (inland)origins.The correlation coefficient ranged from ? 0.4 to ? 0.6 at age 12 (Ryu et al.,2004) and from ? 0.15 to ? 0.23 at age 25,implying that the correlation between geographic variables of origin and growth characteristics tends to be consistent.
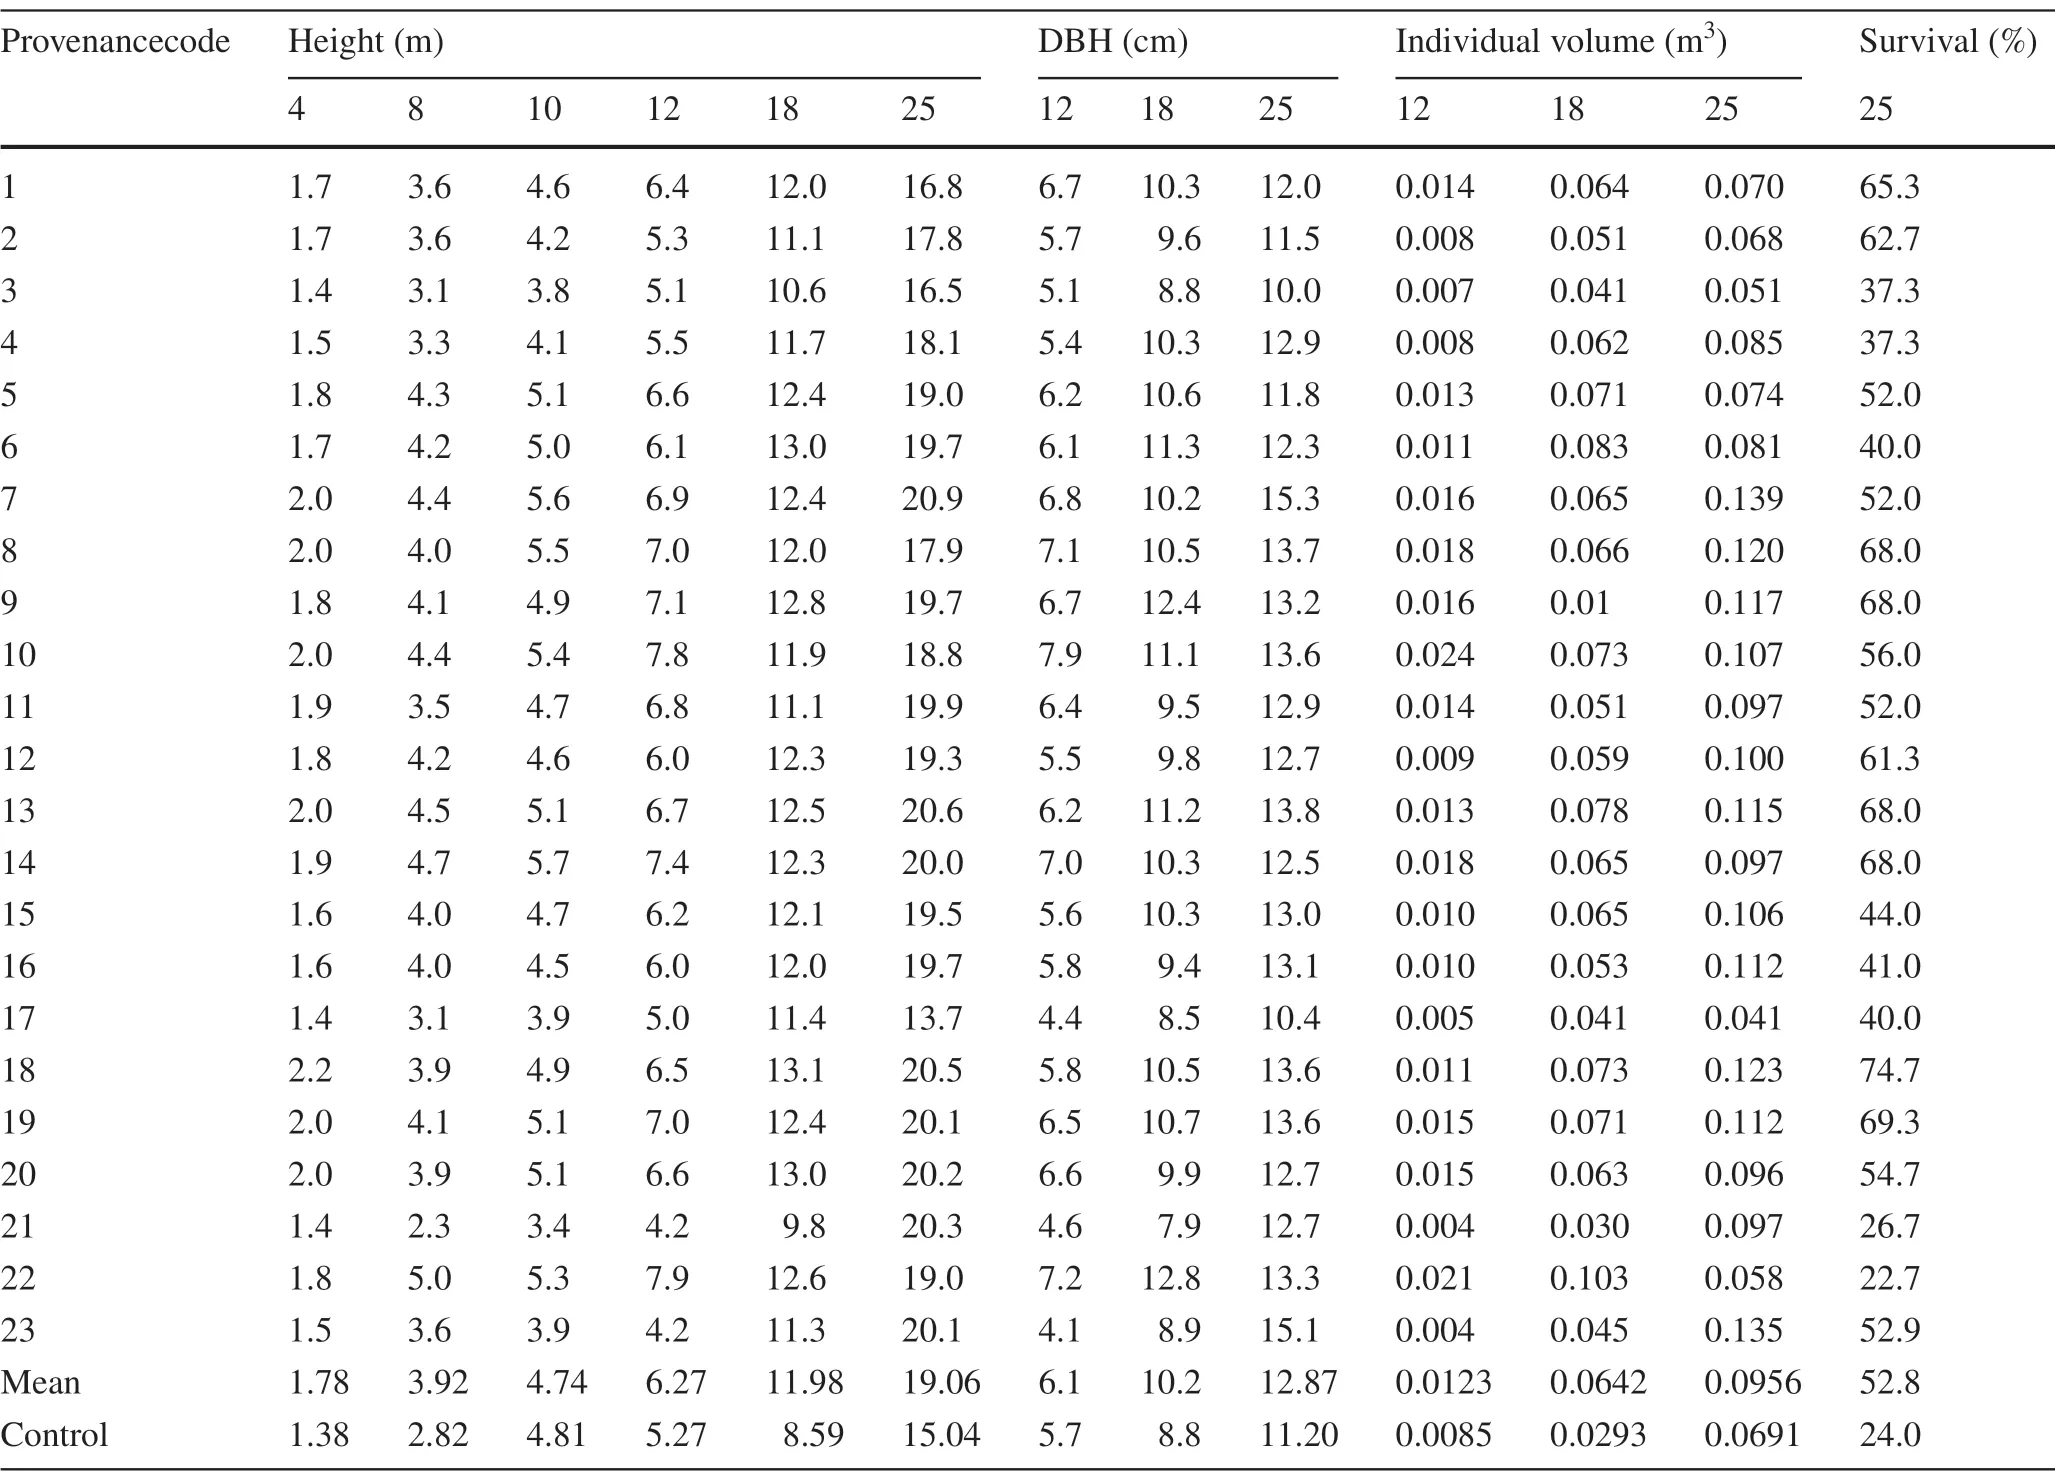
Table 3 Growth performance and survival of 23 provenances of Quercus rubra in South Korea at ages from 4 to 25 years
Due to the negative correlation between longitude and growth traits,we divided the 23 provenances into two groups that were separated by the Appalachian Mountains (15 coastal and 8 inland provenances).Thet-test showed that growth in height,DBH and volume differed significantly between two groups.Also,the northern red oak from the coastal areas had better growth and survival (adaptability)than the inland provenances.This result might be due to the better adaptation of coastal provenances that grow in warmer,more constant climate conditions than the inland provenances.
Analysis of DNA marker variation
The distribution of allelic frequencies among the 23 provenances of northern red oak showed high polymorphisms in 10 microsatellite loci.Two (GA-0A01,GA-1C08) of the 10loci were found in common for all 23 provenances,and 292 alleles were found.The number of alleles per genetic marker ranged from 14 (GA-0A01) to 38 (GA-0E09,GA-1C06).The average number of alleles (A/L) was 5.2,8.2,and 7.6 in the St.Paul (1),Houston Country and Watauga provenances;theA/Lwas higher (10.6) for the Dunham Island,Simcoe Dist.(1) and Fernow provenances (Table 5).

Table 4 Pearson′s product correlation coefficient among geographical variables of origin and growth performance at the test site of the 23 provenances of Quercus rubra
The provenances with allelic diversity lower than the average (A/L=9.0) were St.Paul (1) (5.2),St.Paul (2) (5.3),Houston County (8.2),Sauk Country (8.5),Centralia (2)(8.9),Eagle River (8.4),Middlebury (8.5),Cole Brook (8.8),Deerfield (8.9) and Watauga (7.6) (Table 5).The average number of effective alleles (Ae/L) ranged from 3.2 to 6.8 in the 23 provenances,and theAe/Lwas lower than theA/L.The Chippewa County provenance had a smallerA/Lthan the St.Paul (1) provenance,but theAe/Lof the Chippewa County was slightly larger than St.Paul (1).The average of observed heterozygosity (Ho) was 0.764 and theHovaried from the lowest of 0.647 for the Sauk County origin to the highest of 0.909 for the Watauga origin (Table 5).The average expected heterozygosity (He) was 0.767,and the St.Paul (1) provenance had the lowest (0.638),and the Chippewa County provenance had the highest (0.818).Shannon′s diversity index (I) was 1.813 on average,with the highestof 2.01 for the Dunham Island provenance and the lowest of 1.271 for the St.Paul (1) provenance (Table 5).
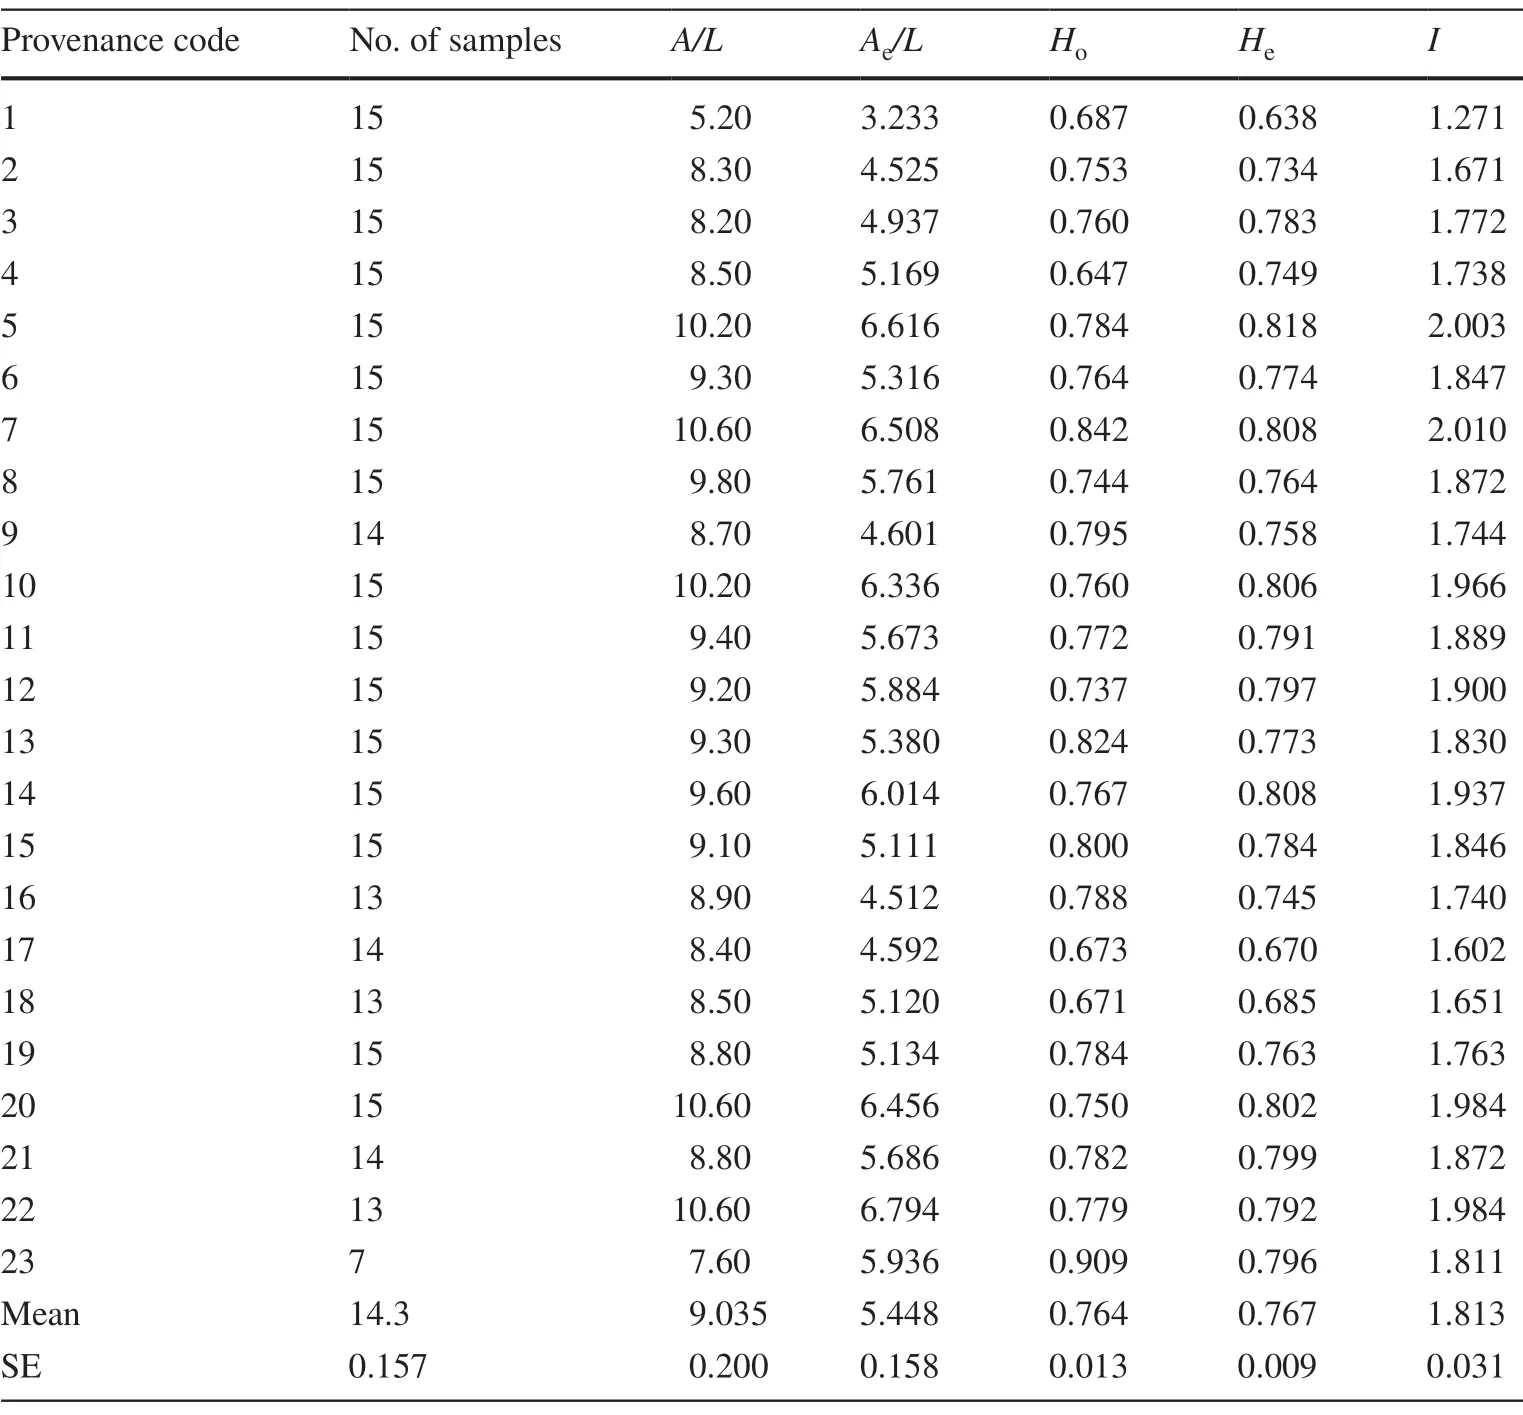
Table 5 Number of alleles per locus (A/L),effective number of alleles per locus (A e/ L),observed heterozygosity (H o),expected heterozygosity (H e)and Shannon’s diversity index(I) revealed by microsatellite makers in 23 provenances of Q.rubra
When the genetic diversity among the 23 provenances introduced to South Korea was compared with the genetic diversity of northern red oak populations in North America,the number of alleles in the North American populations was a little higher than in the South Korean populations,and the observed heterozygosity (He) was similar between South Korean and North America populations (see also Stephanie 2010).Thus,these provenances are worth conserving as northern red oak gene resources in South Korea.
Comparing the genetic diversity of the northern red oaks with other oak species,the allelic diversity and heterozygosity ofQ.rubrawere higher than those ofQ.variabilisnative to China (Xiaomeng et al.2017).Compared with northern red oak,Petra oak (Q.perta) had higher allelic diversity and heterozygosity (Valerie et al.1998) and Georgia oak (Q.georgiana) had lower (Priyanka 2017).Kim et al.(2009) reported that the genetic diversity of northern red oak introduced in Korea had significantly higher diversity than that of domestic sawtooth oak,Q.accutissima.The allelic diversity and the heterozygosity of northern red oak were higher than those ofQ.varibiabilisin South Korea (Jeong et al.2014).
Chippewa Country,Fernow and Womble provenances showed had higher genetic diversity than in the St.Paul (1)and Eagle River provenances based on effective number of alleles number (Ae),expected heterozygosity (He) and Shannon’s diversity index (I).Thet-test showed that the coastal and the inland provenances differed significantly in genetic diversity (e.g.,A/L,Ho,I).In conclusion,the costal provenances had better growth performance and higher diversity compared to the inland provenances.
Estimation of genetic diversity
Nei’s genetic distance was used to estimate the genetic distance among the 23 provenances of northern red oak and construct a neighbor-joining tree (Fig.3).The genetic distance between the St.Paul (2) provenance and Watauga provenance was the longest of 0.852,and the genetic distance between Deerfield provenance and Womble provenance was the shortest of 0.230 (data not shown).
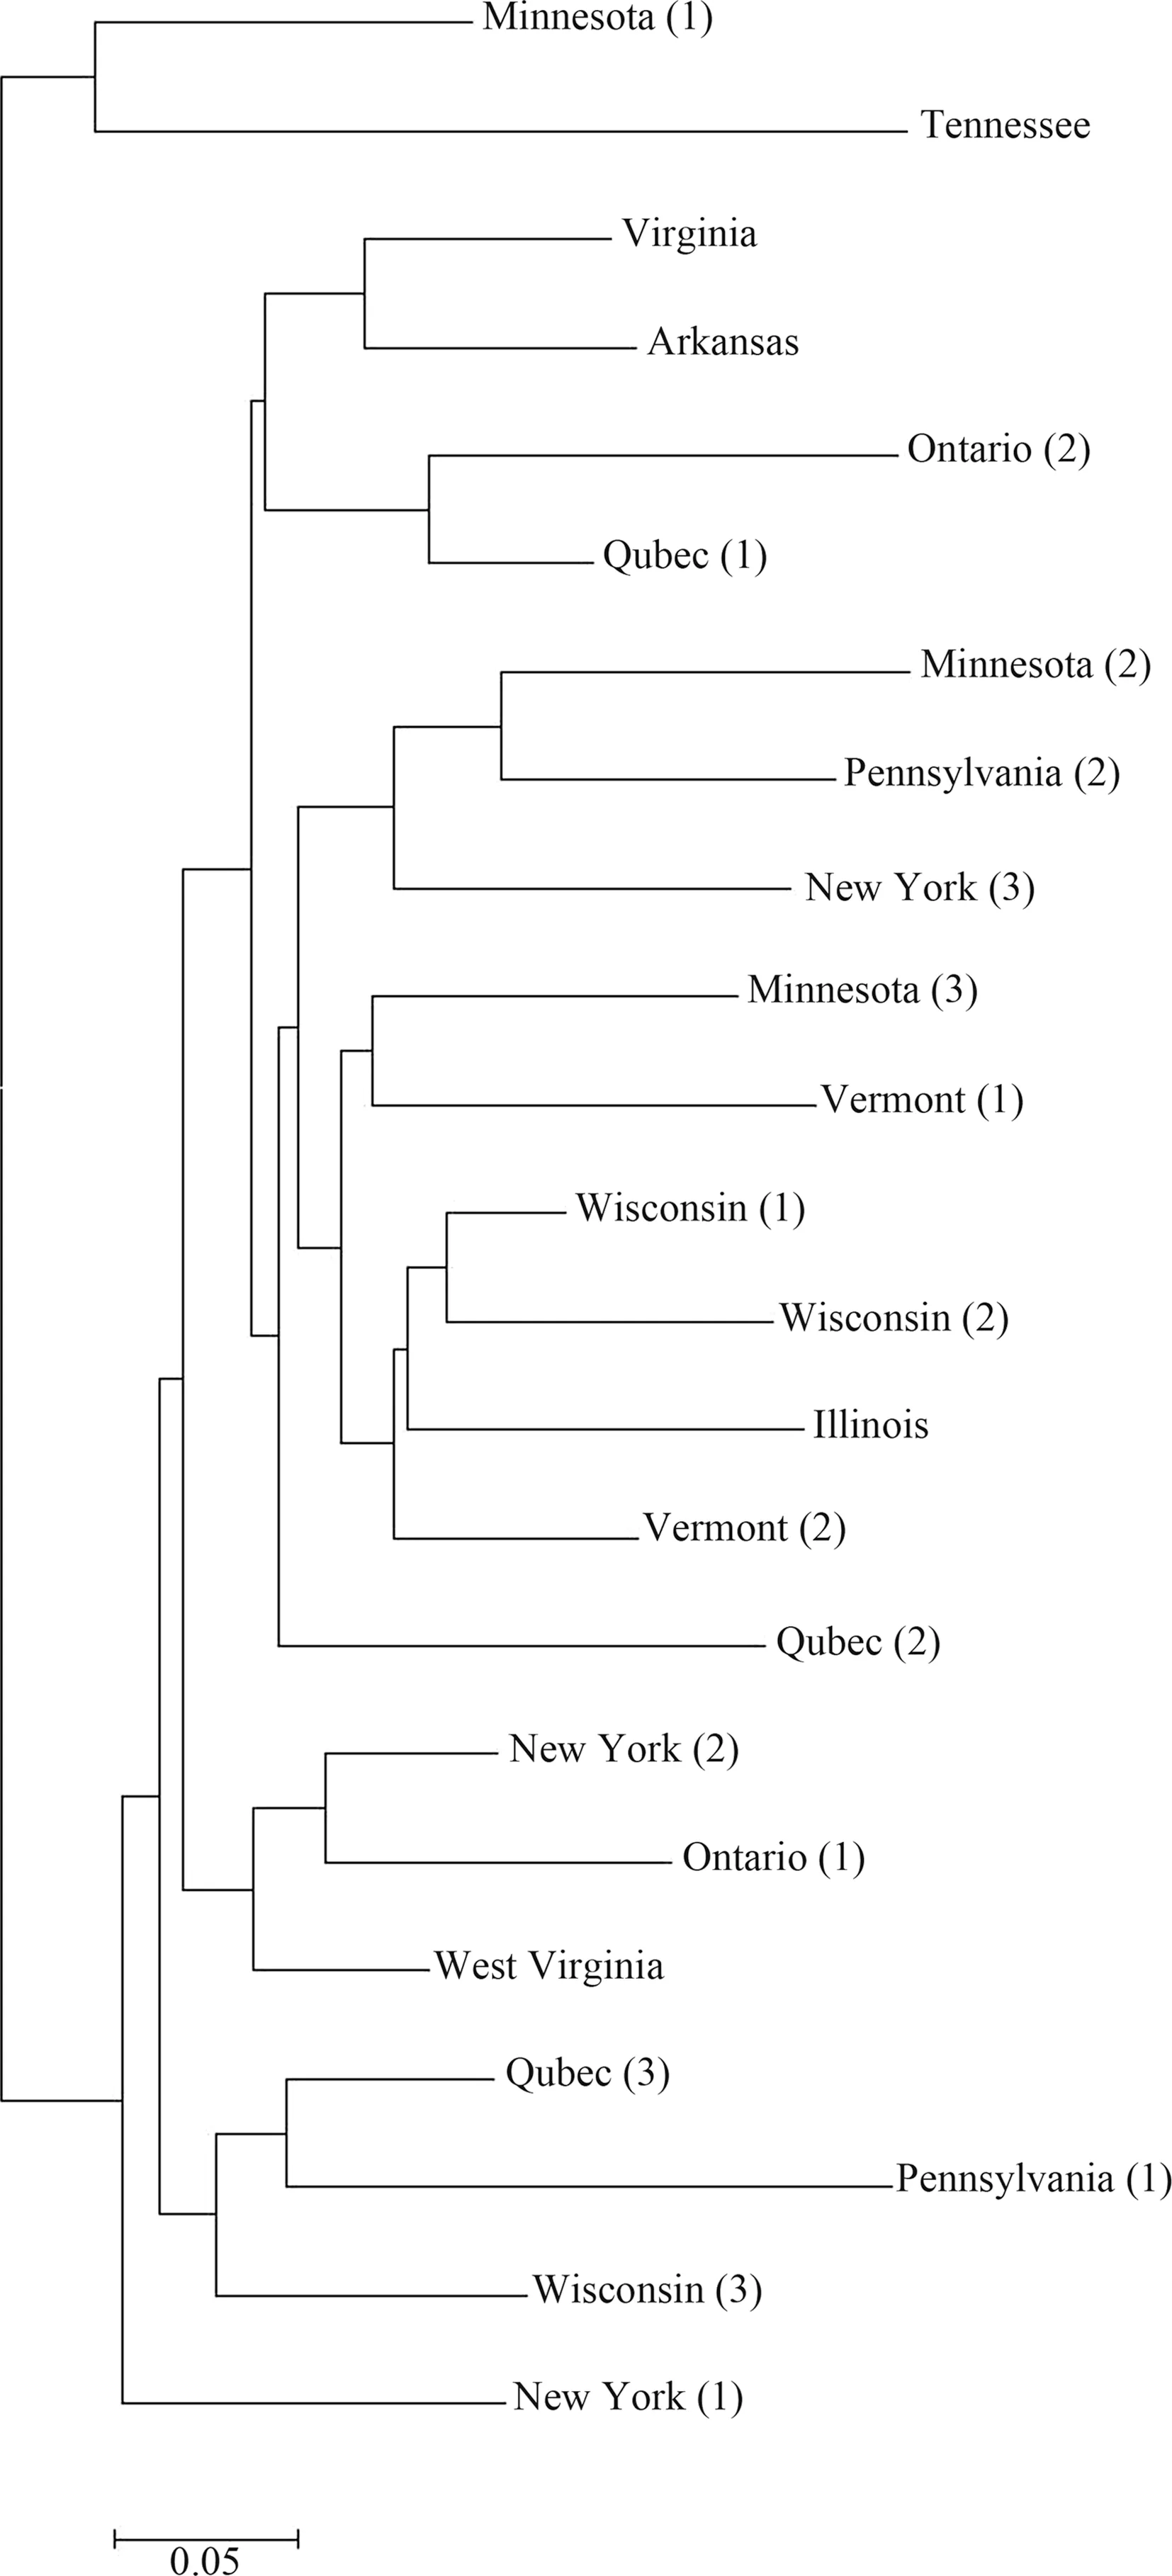
Fig.3 Neighbor-joining tree of the 23 provenances of Quercus rubra based on Nei′s genetic distance
The neighbor-jointing tree showed that the genetic distance seemed to be positively proportional to the geographical distance of provenances such as Selkirk Shore (1),Simcoe Dist (1),Beloeil,Centralia (1),Sauk County,Chippewa County and Urban.The Watauga provenance,for which the genetic distance was far from the other 22 provenances,grouped separately.For some provenances,however,the genetic and the geographic distances did not tend to be proportional.For example,Houston Country,Middlebury,St.Paul (2),Centralia (2),Deerfield and Womble provenances were in the same group although they are geographically far apart.This result was in contrast to the proportional increase found between geographical and genetic distances by Ryu(2004).This result might be due to the fact that the microsatellite marker could not strongly reveal the relation between geographic and genetic characteristics of provenance or species (Choi 2 010).Finally,the analysis of genetic relationships showed that geographical and genetic distances were not clearly correlated for the provenances.Therefore,we suggest that family selection of northern red oak should be based on growth characteristics rather than genetic molecular makers.
 Journal of Forestry Research2021年5期
- Journal of Forestry Research的其它文章
- Morphological and genetic differentiation in isolated populations of Mexican beech Fagus grandifolia subsp.mexicana
- Tree species classification using deep learning and RGB optical images obtained by an unmanned aerial vehicle
- Can small-scale altitudinal gradients predict spatial and temporal patterns in tropical forests?
- The composition and diversity of natural regeneration of tree species in gaps under different intensities of forest disturbance
- Shade and sapling size influence restoration of Araucaria angustifolia
- Genetic diversity and differentiation among populations of the pedunculate oak (Quercus robur) at the eastern margin of its range based on a new set of 95 SNP loci
