Morphological and genetic differentiation in isolated populations of Mexican beech Fagus grandifolia subsp.mexicana
Dulce María Galván-Hernández ·Pablo Octavio-Aguilar ·Luis Lazcano-Cruz ·Arturo Sánchez-González
Abstract Mexican beech [ Fagus grandifolia subsp.mexicana (Martinez) A.E.Murray] is a subspecies endemic to the Sierra Madre Oriental Mountains and considered endangered due to the low density of its populations and high degree of habitat fragmentation and environmental specificity.Because its morphological and genetic variation is associated with its ability to adapt to changes in environmental conditions,the objective of this study was to determine whether phenotypic and genotypic variation exist,and it relationships with population reduction events.In four beech populations in the states of Hidalgo and Veracruz,we analyzed 11 morphological variables for leaves and 6 microsatellite markers.The morphological variables that to discriminate between populations were related to the size of the leaf,but a robust differentiation pattern was not found,given that independent groups of leaves were identified.The populations located closest to each other,had greater genetic variation and less genetic distance;populations in the extreme north and south had the lowest genetic variation.Genetic differentiation among populations was associated with reduction in population size.In the 3 localities in Hidalgo,recent bottlenecks were identif eid,and in Veracruz,an old bottleneck was found.Variation in leaf morphology and genetic structure of Mexican beech populations could be the result of a combination of various geographical,climate and ecological factors.
Keywords Adaptation·Bottleneck·Genetic structure ·Leaf morphology·Mexico·Sierra madre oriental
Introduction
In North America,beech populations (Fagus grandifoliaEhrh.) extend over a large range in western Canada and the United States of America (USA),but in Mexico they are only present as relict populations.The climate changes that occurred in the Pliocene,more than two million years ago,isolated these populations from each other.Currently,the southern populations are restricted to the Sierra Madre Oriental (SMO) of Mexico,differentiated as the supraspecific taxonFagus grandifoliasubsp.mexicana(Martinez)A.E.Murray (Williams-Linera et al.2003).
The beech populations of Mexico are characterized by low density,high environmental specificity (vulnerability to climate change),and a fragmented distribution due to loss of their habitat (Fang and Lechowicz 2006;Vargas-Rodríguez et al.2010;Ortiz-Quijano et al.2016),which is why they are classified as“endangered”in national legislation (SEMARNAT 2010).At the species level,however,they are in the“l(fā)east concern”category (LC) in the International Union for Conservation of Nature Red List,because of their wide distribution including north of 31° latitude in North America (Barstow 2017).
Their high genetic variability enables the species to adapt to environmental changes and evolve,but when genetic variability is reduced,reproductive efficiency and survival are impaired (Frankham et al.2012).A few studies have been carried out onFagus grandifoliato estimate its genetic variability.Rowden et al.(2004),using RAPDs,RFLP markers and cpDNA haplotypes,found signif ciant differentiation between populations of this species in Mexico and the USA.These authors also identified a positive correlation between genetic diversity and effective population size.Koch et al.(2 010)estimated,through the use of 6 microsatellite markers,a high degree of cross-linking in USA populations ofF.grandifolia,consistent with high genetic diversity of the species.In contrast,Montiel-Oscura et al.(2 013) found,through the use of allozymes,only moderate genetic diversity inF.grandifoliasubsp.mexicana,which was not correlated with population size.
The results of these studies agree that populations ofF.grandifoliasubsp.mexicanashow high levels of differentiation and low genetic diversity due to the low density of individuals,geographic isolation,a high degree of disturbance of their habitat and local environmental variation.Consistent with these findings,Kitamura et al.(2008) report that it is probable that there is minimal or null genetic exchange among populations ofF.grandifoliain the USA,because pollen and seeds are dispersed within short distances (approximately 1.17 ha).
Environmental disturbance generates high levels of stress in plant populations and increases phenotypic and genotypic variation among them by reducing population size (bottleneck effect,founder effect) or by the effect of natural selection (Schlichting 2004;Frankham et al.2012).Species with restricted distribution and high sensitivity to changes in environmental conditions,such asF.grandifoliasubsp.mexicana(Williams-Linera et al.2003;Ortiz-Quijano et al.2016),can function as excellent biological models for assessing whether the variation in morphology between populations is due to phenotypic plasticity,natural selection,or seasonal changes(Via and Lande 1985).The main objective of the present study was to determine the relationships between phenotypic variation (foliar morphology) and genotypic variation (evaluated using nuclear microsatellites) with respect to Mexican beech population reduction events.
Materials and methods
Study area
FourFagus grandifoliasubsp.mexicanapopulations in the cloud forest from the states of Hidalgo and Veracruz,within the Sierra Madre Oriental,Mexico (Fig.1 a,Table 1) were sampled.The predominant climate is characterized by a humid temperate climate with abundant rain,high humidity,and frequent fog.The average annual temperature is 12.7 °C,the annual rainfall ranges from 1200 to 2050 mm,and the elevation ranges from 1557 to 1987 m a.s.l.The topography is irregular,and the soils are dark,with a thick layer of organic matter in the form of humus,and rich in nutrients(Rodríguez-Ramírez et al.2013).

Table 1 Site information for the studied populations of Fagus grandifolia subsp.mexicana
Sampling design
For the leaf morphological analysis,20 trees with a DBH greater than 20 cm and at least 25 m apart were chosen at random to avoid co-ancestry effects.Twenty leaves collected randomly from each individual were prepared as herbarium specimens for subsequent measurement in the laboratory.For the genetic analysis,some mature leaves without apparent mechanical damage were collected from 25—39 trees per population.
Morphometric characteristics
Eleven variables were measured,3 related to length:leaf blade length (LL),total leaf length (TLL) and length from the base to the maximum width of the blade (HMW);2 variables related to venation:diameter of the middle vein(MVD) and number of veins (NV);three related to the petiole:petiole length (LP),petiole diameter (PD) and maximum width (MWL);and three related to the partial shape of the leaf:width of the first basal third of the blade (LWB),width of the blade of the first apical third (LWA) and width of the blade at the first basal vein (ABV) (Fig.2) (álvarez-Zú?iga et al.2009).The measurements were estimated from photographs,using the backs of the leaves as reference with tpsDig2 2.04 program (Rohlf 2005).
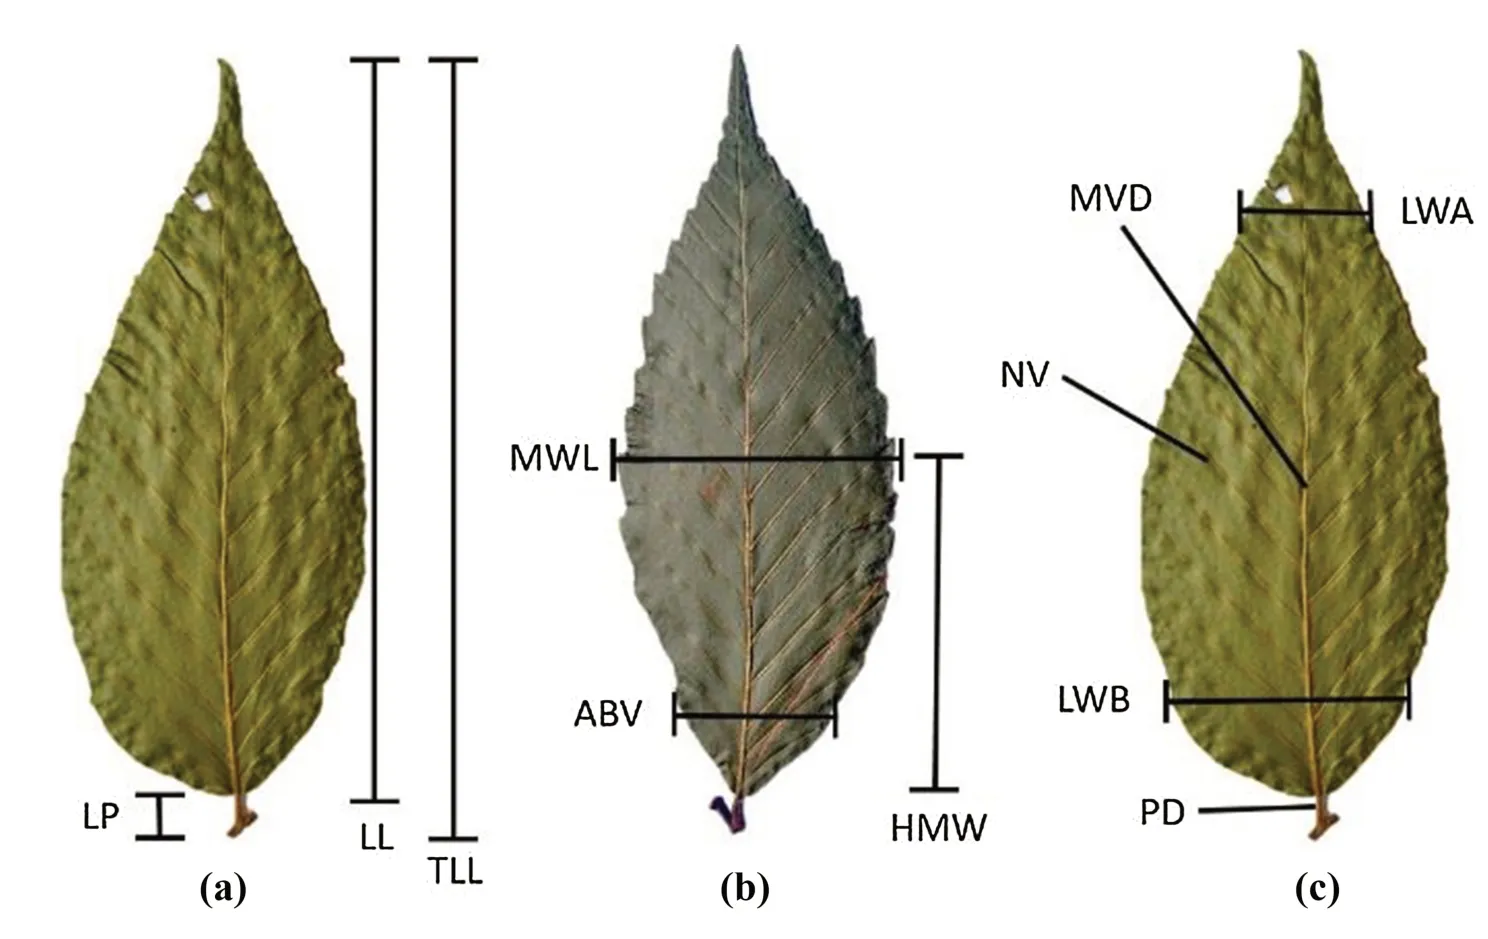
Fig.2 Morphometric variables of Fagus grandifolia subsp.mexicana a Length of blade(LL),petiole length (LP) and total blade length (TLL);b maximum width of lamina(MWL),length of base to maximum width of blade (HMW),blade width of the first basal vein (ABV);c blade width of the first basal third (LWB),blade width of the first apical third (LWA),petiole diameter(PD),median vein diameter(MVD) and number of veins(NV)
DNA extraction and microsatellite amplif ication
DNA was extracted by the CTAB method with modifications (Doyle and Doyle 1987):liquid nitrogen was used to macerate the samples before the use of CTAB and chloroform—octanol (24:1).Six microsatellite markers developed for the genusFaguswere used:FS1-03[(GA)18],FCM5 [(AG)10],FS1-25 [(GA)23],TBN-24 [(CAT TCA TATT)2(GA)23],TB-142 [(GTT)8] and TB-140[(TGT)22] (Pastorelli et al.2003;Li-Ping et al.2012).PCR amplif ication was carried out in a 15-μL reaction mixture containing 50 ng DNA,1 × PCR buffer,4.5 mM MgCl2,0.2 mM dNTPs,2 μM of each primer and 0.2 U of Taq polymerase.The PCR conditions were:initial denaturation at 95 °C for 5 min;followed by 30 cycles at 95 °C for 1 min,alignment temperature for 1 min (56 °C for FS1-03,FCM5,FS1-25,TBN-24,58 °C for TB-140 and 64 °C for TB-142)and 72 °C for 1 min;f inal extension at 72 °C for 8 min.The PCR products were separated using 15% polyacrylamide gels and recorded with the GelAnalyzer program (Lazar and Lazar 2010).
Morphometric analysis
The differences in leaf morphology between populations were determined by means of generalized discriminant factor analysis (GDFA).The variables were transformed withzstandardizationtonormalizethembeforeanalysis.For estimating Mahalanobis distances (MD) between localities,the variables with the greatest contribution to explaining the percentage of variance were chosen (LL,LP,TLL and MVD).A dendrogram was generated with the MD values,using the UPGMA group joining method (Kaufman and Rousseeuw 1990).
In addition,the Euclidean distance was estimated with the morphological variables LL,LP,TLL and MVD to estimate the total variation in the morphology of the leaves independently of locality to rule out any influence of spatial or temporal variation.The results were represented in a dendrogram generated by the method of Ward,a hierarchical procedure that uses the square of the difference of each centroid to join the branches (Murtagh and Legendre 2014).A correspondence analysis was carried out on the selected groups to estimate the relationship between the morphological categories obtained with the Ward method and with the populations.
The relationship between Mahalanobis distances (morphological characteristics) between populations and geographical distances was estimated using the Mantel test.All analyses were carried out using STATISTICA version 10 (Statsoft 2014) and PAST version 2.17c (Hammer et al.2001).
Genetic analysis
Genetic diversity was quantified according to the number of alleles per locus (A),effective number of alleles per locus(Ne),observed heterozygosity (Ho),expected heterozygosity(He),Shannon index (I) and fixation index (f).To estimate the genetic differences between localities,an analysis of molecular variance (AMOVA) was carried out with the GenAlEx program v.641 (Peakall and Smouse 2006).Genetic distances were calculated by Nei’s method and a dendrogram was constructed with the UPGMA group clustering method.The genetic flow between populations was estimated from the genetic differentiation index (FST) using the formulaNm=1 ?FST/ 4FST(Slatkin and Barton 1989),whereNmis the number of migrants per generation.The STRU CTU RE program was used to obtain information on the genetic structure of the original populations (Pritchard et al.2000).The number of inferred groups was evaluated in a range ofK=2—10 with 50,000 and 10 repetitions for each value ofK.The estimates were obtained from the admixture model,using allele frequency correlation and the LocPrior algorithm,which incorporates information on the origin of the samples.The value ofKwas determined by the ΔKmethod proposed by Evanno et al.(2005) using the STRU CTU RE HARVESTER program (Earl and vonHoldt 2012)and was corrected using the CLUMPP 1.1.2 program (Jakobsson and Rosenberg 2007).
The genetic groups were graphed using the Distruct 1.1 program (Rosenberg 2004) to estimate population size decrease or increase.A bottleneck analysis was employed,taking the excess or def iciency of heterozygosis under the mutation drift balance model into consideration.The probability of def iciency or excess was calculated using a Wilcoxon test under the inf inite allele model (AMI) using the BOTTLENECK program v.1.2.02 (Cornuet and Luikart 1996).The paired Mantel test (Mantel 1967) enabled the relationship between the genetic structure (genetic distances of Nei) and isolation by distance (geographic distances) to be estimated using the TFPGA v.1.3 program (Miller 1997).
Relationship between morphological and genetic variation
A Mantel test was performed to compare morphological and genetic variation based on the Mahalanobis distance matrix of the morphological attributes and the Nei genetic distance matrix using the TFPGA v.1.3 program (Miller 1997) to estimate the variation as a result of the ecological adaptations of the species.
Results
Variation in leaf morphology between populations
A total of 1600 leaves were measured to estimate the morphological differences between the 4 populations ofF.grandifoliasubsp.mexicana.The first 2 discriminant functions explained 99% of the variance (F1 eigenvalue=0.56,cumulative variance 80.9%;F2 eigenvalue=0.133,cumulative variance 19.1%).The attributes that made the greatest contribution to the explained variance between localities were LL,LP,MVD and TLL (p<0.01),so only these four characteristics were included in calculations of the morphological distances between populations.The Medio Monte and Volcán Acatlán populations were morphologically the most heterogeneous,with low allocation percentages,14.25% and 48.25%,respectively (Fig.3 a).The remaining populations had percentages above 50%.
The cluster analysis (Fig.3 b) showed that the populations with the highest leaf morphological similarity were Medio Monte and Volcán Acatlán (MD=0.28).La Mojonera was slightly different than Medio Monte and Volcán Acatlán,whereas El Gosco was the most different population(MD=1.06).The results of the discriminant analysis show that divergence between populations is mainly associated with the attributes MVD (Function 1,r=0.5542),LL (Function 2,r=? 0.9792),and TLL (Function 2,r=? 0.9669)(Fig.3 a).
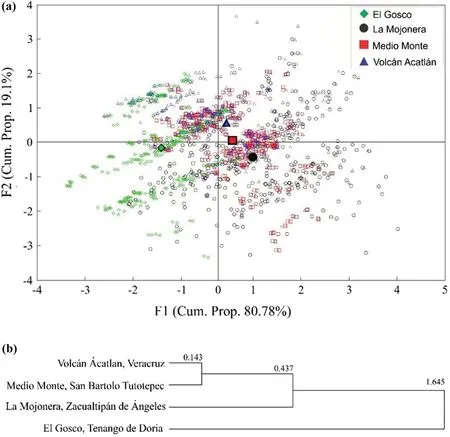
Fig.3 Leaf morphological variation of Fagus grandifolia subsp.mexicana.a GDFA;the solid marks represent the centroids for the morphological attributes by population;the geometric figures of different colors without filling,represent each one of the leaves of the analyzed populations;b UPGMA grouping tree of Mahalanobis foliar distances among localities
Diff erentiation of leaf phenology
Six leaf groups were distinguished by the Ward method based on the Mahalanobis distances between cases,independently of population and ordered in ascending order of overall leaf size (Table 2).In the correspondence analysis,the first 2 axes (dimensions) explained the total variation between phenotypic groups and populations (D1:72.87%,D2:23.3% inertia).Leaf groups 1 and 6 (small and large leaves) were related to the El Gosco site.The Medio Monte and Volcán Acatlán sites were associated with leaf group 3,which comprises leaves 11—12 cm long,petiole 0.6—0.7 cm long and total leaf length 11—13 cm (Table 2).For this reason,the morphological distance between the 2 populations was low.The Mojonera was considered the most heterogeneous site because it contains the groups 2,4,and 5 (Fig.4).The Mantel test indicated that the relationship between morphological distances and geographic distances between locations was not statistically significant (r=? 0.719,p=0.925).
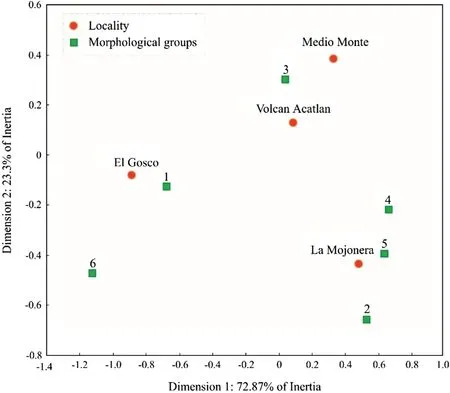
Fig.4 Correspondence analysis of leaf morphological variation of Fagus grandifolia subsp.mexicana.Square:foliar groups;circles:localities.Variance explained by the first 2 axes:96.17%
Genetic variation
The Medio Monte locality had the highest average number of alleles (Na) and effective number of alleles per locus(Ne) (8.83 and 5.04,respectively) and La Mojonera the lowest values in both parameters (Na=6.66 andNe=4.37).All sites are highly polymorphic (100%),and the results of the Shannon index (Table 3) indicate that the localities with the highest genetic variation were Medio Monte(I=1.75) and El Gosco (I=1.63).These values were directly related to the observed values of heterozygosis(Ho) .In the particular case of the Volcán Acatlán site,Ho(0.56) was lower thanHe(0.70),so the value of the fixation index was higher than for the other study populations(F=0.22).El Gosco was the population with the lowest fixation index (Ho.74,He=0.74,f=0.01) (Table 3).
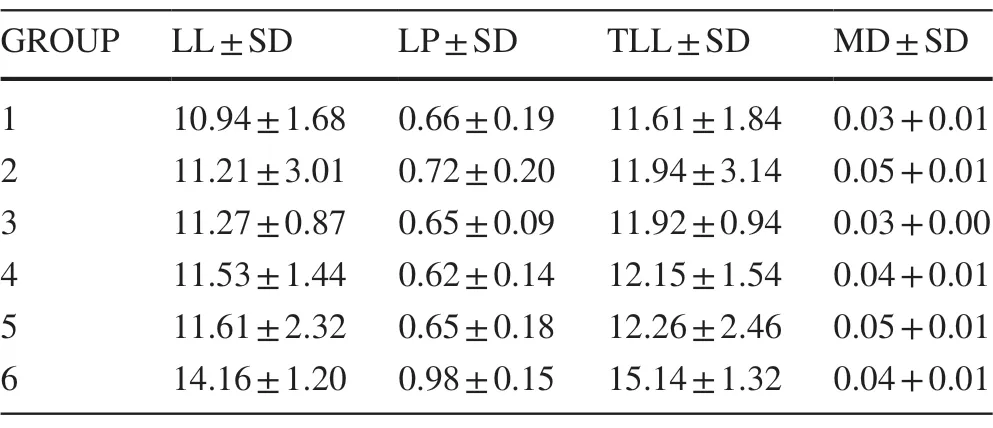
Table 2 Morphological groups obtained by cluster analysis.Mean and standard deviation of principal foliar attributes
Genetic structure
There was significant genetic differentiation (p=0.001),although the variation was greater among individuals (78%)than among localities (22%).Figure 1 b shows that the lowest genetic distance was between the El Gosco and Medio Monte sites (0.15),and the highest distance was between La Mojonera and Volcán Acatlán (0.40),which is related with the geographical distribution of the sites (Table 1,Fig.1 a).The values of the genetic distances are related to the number of migrants per generation (Nm),so genetic exchange(Nm=0.37) between La Mojonera and Volcán Acatlán is zero.The Medio Monte and El Gosco sites show an exchange of at least one migrant per generation (Nm=1.37)(Table 4).Even though the two farthest apart sites showed the highest genetic differentiation,the results of the Mantel test indicate that there is no geographical isolation,given that the correlation between the 2 distance measurements was not significant (r=0.64,p=0.16).

Table 3 Genetic characterization of Fagus grandifolia subsp.mexicana populations
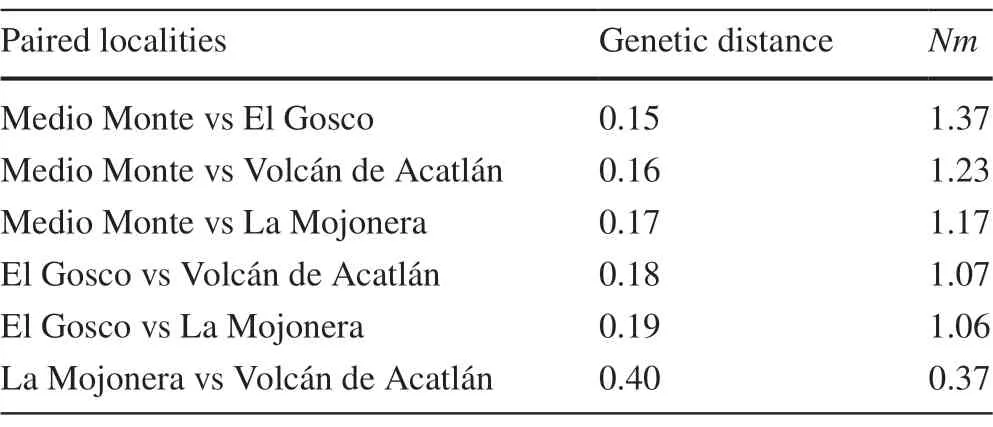
Table 4 Paired Nei’s genetic distances and migrant individuals by generation (Nm) between beech populations
All loci were in Hardy—Weinberg equilibrium,this allowed STRU CTU RE analysis using the ΔKmethod to estimate the number of genetic groups,resulted in a finding ofK=4 as the best model to explain the genetic structure ofFagus grandifoliasubsp.mexicana.In the populations located at the extremes of the geographical distribution(La Mojonera in the north,Volcán Acatlán in the south),there are differences in the frequencies of the genetic groups(Fig.1 c),with at least one group being dominant at each end,this is related to the higher fixation index registered.In the central part of the distribution of the subspecies,the El Gosco and Medio Monte sites were more heterogeneous,individuals with three or four genetic groups are observed,which is consistent with the values of genetic variability obtained (Table 3).
Bottleneck analysis
The results of the bottleneck analysis indicate that there has been a recent reduction in population size at the sites in the state of Hidalgo (El Gosco,La Mojonera and Medio Monte).For all these sites,an excess of heterozygosis was estimated for the 6 analyzed loci (one-tailed Wilcoxon test of heterozygote excess=0.0078,p<0.05).For the Volcán Acatlán (Veracruz) site,f ive excess loci were identified(Hs=0.054,p=0.12) and one locus (FS125) with heterozygote def iciency (Hs=1.146,p=0.048),which is probably related to the occurrence of an older bottleneck.The results of the Mantel test showed that the relationship between the Mahalanobis morphological distances (morphological leaf variation) and the Nei genetic distances was not significant(r=? 0.26,p=0.34).
Discussion
Morphological differentiation
The differences in leaf morphology between theFagus grandifoliasubsp.mexicanapopulations are mainly associated with the size of the leaf (LL,LP,TLL) and the diameter of the middle vein (MVD).In several groups of plants,these attributes have been used to differentiate between species(Carvalho et al.2012);inF.grandifolia,F.orientalis,andF.sylvatica,some characters related to petiole length and leaf length enable discrimination between populations,subspecies,and species (Denk et al.2005;Hatziskakis et al.2011;Cioc?rlan 2014).
Morphological differentiation betweenFagusspecies has been related to fragmentation of its original distribution area during the Miocene and Pliocene periods and the subsequent interruption of horizontal gene flow (Denk et al.2005).This partially explains the morphological and genetic differentiation between Mexican beech populations,given their distribution in isolated fragments and restriction to sites with specific environmental conditions (Rodríguez-Ramírez et al.2018).
No pattern of differentiation in leaf morphology between sites was observed;groups with similar leaf morphological characteristics were identified,but they were independent of origin.The lack of defined patterns in morphological variation inF.grandifoliacorroborates its high phenotypic plasticity in response to local environmental conditions and seasonal changes in forest structure (Dolnicki and Kraj 2001;Pigliucci 2001;Hatziskakis et al.2011;Cioc?rlan 2014;Capdevielle-Vargas et al.2015;Ortíz-Quijano et al.2018).In contrast,continuous morphological variation along a latitudinal gradient has been observed inF.sylvatica(Hatziskakis et al.2011).
Frank et al.(2017) note that the temperature and water regime induce the formation of phenological variants,so they act as selective agents at the local level.InFagus sylvatica,for example,the leaves open at different times as a strategy to compete for light and keep the trees vigorous(Capdevielle-Vargas et al.2015).The environmental conditions that predominate in the beech forests in the SMO are relatively homogeneous,so it is likely that variations in leaf morphology are due to the formation of micro-environments due to natural tree fall (gap dynamics) (Rodríguez-Ramírez et al.2018;Ortiz-Quijano et al.2018).
The high variation in leaf morphology in the La Mojonera population could be due to the high environmental heterogeneity caused by the topography and the size of the forest (about 45 ha).At the other sites,the forest fragments are smaller and more uniform,which could,in addition to the genetic load of the populations,reduce the expression of plasticity (Winn and Gross 1993;Williams-Linera et al.2003;Denk et al.2005;Capdevielle-Vargas et al.2015).
Genetic variation
The results show that there is a reservoir of genetic variability in the middle range of the geographical distribution of the Mexican beech populations (El Gosco and Medio Monte).The estimated values ofHeranged from 0.56 to 0.74,considerably different from those estimated forF.grandifoliapopulations in the USA (He=0.18) based on allozyme systems (Kitamura and Kawano 2001) or estimates made using RAPD markers forF.grandifoliasubsp.mexicanapopulations that included,among other locations,La Mojonera and Volcán Acatlán (He=0.13—0.15) (Rowden et al.2004);however,the broad differences inHevalues could be related to the type of marker used in each study.The dinucleotide markers employed inF.grandifoliaallow the detection of differences between individuals of same population,and markers of more than three nucleotides allow detect variation between populations and species.Microsatellites being codominant,provide twice as much information that AFLP,RFLP and RAPD dominant markers,which do not allow identification of heterozygosity;they are also highly polymorphic markers for size and high mutation rate,and thus are considered more informative (Pejic et al.1998).
The sequence length polymorphism of a microsatellite is commonly detected by amplif ciation with PCR,and PAGE is the most common method for analysis (Cregan and Quigley 1997).However,the identification of specific bands would have some variation by thermal conditions that could generate false alleles or null bands,so the use of specific software for image analysis is necessary.In this study,we employed the GelAnalyzer program (Lazar and Lazar 2010) for band identification.In this software,the brightness of a pixel(color component intensity) is determined by the intensity of red,green,and blue at a given point,which enables the identification of monomorphic and polymorphic bands expected size,calculated using the DNA ladder (Skosyrev et al.2 013).
The same pattern held for values of the other genetic parameters:the percentage of polymorphisms in all the populations analyzed was high (100%),as was Shannon’s (I)with values of 1.53—1.75.In contrast,Rowden et al.(2004)obtained polymorphism percentage estimates <41.9 and Shannon’s index values of 0.19—0.22.The lower genetic variation observed in the populations located at the ends of the latitudinal gradient analyzed is negatively related to higher values of the fixation index (f=0.22 for Volcán Acatlán and La Mojonera).Genetic fixation in the southernFaguspopulations could be due to a natural process of gradual ancestral reduction in population size that runs in a north—south direction along the latitudinal gradient,in contrast to the recent reduction in the population density ofFagusin the north of the state of Hidalgo.It is widely recognized that within the range of elevational or latitudinal distribution of a species,peripheral populations develop under suboptimal environmental conditions (climatic pressure),so they have a lower density of individuals,which promotes greater genetic differentiation (Galván-Hernández et al.2015;Housset et al.2016).
The differentiation index of theFaguspopulations of Mexico is low compared to those of Canada and the USA(FST=0.05 vs.FST=0.16,respectively).The highest differentiation values of the populations located in North America could be associated with more severe climate conditions,their life histories,and expansion or contraction due to ancestral migration events (Kitamura and Kawano 2001),although they could also be attributed to reproductive isolation (inbreeding and/or genetic drift) caused by habitat fragmentation,which is common in widely distributed species with reticulate expansion—contraction patterns (Rowden et al.2004;Denk et al.2005).
The genetic differentiation betweenFagus grandifoliasubsp.mexicanapopulations was more evident between individuals than between populations,so it was not possible to define a clear pattern of geographical variation.It is likely that the existence of four genetic groups in El Gosco and Medio Monte populations,is due to a remnant of genetic flow between them;probably they were a single population with wide distribution,which was fragmented in the past by climatic change and recently by anthropogenic activities (Ortiz-Quijano et al.2016),so that to date,high levels of genetic variation and low differentiation have been maintained.In tree species,a recent reduction in effective population size may imply a decrease in the number of alleles and a sudden but short-lived increase in the number of heterozygotes due to a sampling effect (Piry et al.1999).In the Volcán Acatlán population,a severe reduction of ancestral origin was detected.In contrast,in the El Gosco population the changes in density are recent;the forest is currently distributed over an area of less than 4.5 ha and is at risk of extinction due to logging.Fortunately,a part of the population grows in a ravine with slopes >45°,which has prevented logging (Rodríguez-Ramírez et al.2013;Ortíz-Quijano et al.2016).The Medio Monte population covers an area of approximately 34.25 ha,and to date,there is no indication that it is being affected by human activities,so it constitutes a reservoir of genetic variability.It did,however,show evidence of a bottleneck,likely associated with local factors that potentially include limited pollination,high seedling mortality,or undetected fragmentation processes,among others (Octavio-Aguilar et al.2017;Iglesias-Andreu et al.2017).
In conclusion,the high levels of genetic variation detected inFagus grandifoliasubsp.mexicanasuggest that its structure conforms to the island—continent model,in which populations located at the extremes of the geographical distribution of the species are the result of colonization or island sinks,and those of the middle part are reservoirs of genetic variability.However,the degree of genetic and morphological differentiation is not related to geographical distance in beech populations in Mexico,unlike the beech populations of Canada and USA,where a positive relationship has been found (Houston and Houston 1994;Rowden et al.2004).Nevertheless,the current conditions under whichFaguspopulations grow in Mexico compared to North America are very different in several aspects,including the number of existing populations,the geographic distance between them,the density of individuals per population,the area that they occupy,the forest management,and the degree of disturbance of their habitat,among others (Rodríguez-Ramírez et al.2013),so any comparisons between them should be made with caution.
AcknowledgementsThis study received financial support from the National Council of Science and Technology,Basic Science Project“Effect of climate change on relict tree populations:integrating dendrochronology and population genetics”,CB-2016/ 284484;from Project INFR-252807 for the genetic analysis,and National Council of Science and Technology,postdoctoral grant 316763“Forest genetic stock of the state of Hidalgo:Studies onCedrela odorata,Magnolia dealbataandFagus grandifolia”for D.M.G.-H.
 Journal of Forestry Research2021年5期
- Journal of Forestry Research的其它文章
- Performance and genetic diversity of 23 provenances of northern red oak (Quercus rubra L.) after 25 years of growth in South Korea
- Tree species classification using deep learning and RGB optical images obtained by an unmanned aerial vehicle
- Can small-scale altitudinal gradients predict spatial and temporal patterns in tropical forests?
- The composition and diversity of natural regeneration of tree species in gaps under different intensities of forest disturbance
- Shade and sapling size influence restoration of Araucaria angustifolia
- Genetic diversity and differentiation among populations of the pedunculate oak (Quercus robur) at the eastern margin of its range based on a new set of 95 SNP loci
