
Application of an immobilized microbial consortium for the treatment of pharmaceutical wastewater:Batch-wise and continuous studies
2021-04-13 06:22:14ShabnamMurshidGnanaPrakashDhakshinamoorthy
Shabnam Murshid,Gnana Prakash Dhakshinamoorthy
Department of Chemical Engineering,SSN College of Engineering,Kalavakkam,Tamil Nadu 603110,India
Keywords:Pharmaceutical wastewater Microbial consortium Immobilization Batch study Fixed film bioreactor Kinetic studies
ABSTRACT In the present investigation,a microbial consortium consisting of four bacterial strains was selected for the treatment of pharmaceutical industry wastewater.The consortium was immobilized on a natural support matrix-Luffa and used for the treatment of real-time pharmaceutical wastewater in batch and continuous processes.The batch process was carried out to optimize the culture conditions and monitor the enzymatic activity.An array of enzymes such as alcohol dehydrogenase,aldehyde dehydrogenase,monooxygenase,catechol 2,3-dioxygenase and hydroquinol 1,2-dioxygenase were produced by the consortium.The kinetics of the degradation in the batch process was analyzed and it was noted to be a first-order reaction.For the continuous study,an aerobic fixed-film bioreactor(AFFBR)was utilized for a period of 61 days with variable hydraulic retention time(HRT)and organic loading rate(OLR).The immobilized microbes treated the wastewater by reducing the COD,phenolic contaminants and suspended solids.The OLR ranged between (0.56 ± 0.05) kg COD·m?3 d?1 to 3.35 kg COD·m?3·d?1 and the system achieved an average reduction of 96.8%of COD,92.6%of phenolic compounds and 95.2%of suspended solids.Kinetics of the continuous process was interpreted by three different models,where the modified Stover Kincannon model and the Grau second-order model proved to be best fit for the degradation reaction with the constant for saturation value,KL being 95.12 g·L?1·d?1,the constant for maximum utilization of the substrate Umax being 90.01 g·L?1 d?1 and substrate removal constant KY was 1.074 d?1 for both the models.GC–MS analysis confirmed that most of the organic contaminants were degraded into innocuous metabolites.
1.Introduction
The pharmaceutical industry is one of the most globally developed industries with a total revenue of 1143 billion USD[1].This high revenue comes at a stiff price of increased environmental pollution due to the production of a huge quantity of wastewater.Even though the recent technologies of wastewater treatment have made a lot of advancement,it is not efficient enough to eradicate the immeasurable amount of pollutants present in the wastewater such as sulfates,chlorides,phenols and high levels of Chemical Oxygen Demand(COD),Biological Oxygen Demand (BOD),Total Dissolved Solids (TDS) and Total Suspended Solid (TSS) [2],which are harmful for both human and aquatic life.These industries are widely distributed all over the world and there is a global surge in the use of drugs driven by its need.As a result,pharmaceuticals have been detected in ground and drinking water[3].Owing to the presence of extensive contaminants in the wastewater,our ecosystem gets affected in innumerable ways,the most harmful being genotoxic and mutagenic[4].
The treatment methods differ based on the varying characteristics of pharmaceutical products.Recently advanced oxidation techniques[5]have gained a lot of attention for the treatment of pharmaceutical industry wastewater,yet it has unavoidable drawbacks such as complex nature and formation of toxic by-products[6].Therefore,to reduce the level of pollution created by the wastewater some industries are opting for microbial treatment.Microbes degrade or convert the complex pollutants into simpler forms.In any condition,whether the wastewaters are degraded or converted into a by-product,the resultant product does not create secondary pollution.A considerable amount of research has been carried out around the world for the degradation of pharmaceutical industrial wastewater with the help of fungal strains such as Phanerochaete chrysosporium[7],Trametes sp.[8].
In the present study,a microbial consortium is isolated from the proximity of the pharmaceutical industry unit and immobilized on a cost-effective support i.e.dried Luffa fruits(Luffa cylindrica)and utilized to degrade diluted real-time pharmaceutical wastewater in batch-wise conditions.The kinetics of the degradation reactions and the enzymatic activity of the microbes are analyzed.
To further understand the process and test its efficiency an aerobic fixed-film bioreactor(AFFBR)is used.Luffa is employed as the support material for the microbes.The reduction of Chemical Oxygen Demand(COD),Total Phenolic Components(TPCs) and Suspended Solid(SS)were monitored throughout the process which was stretched over 61 days.The Hydraulic Retention Time(HRT)and the Organic Loading Rate(OLR)were kept as variables to figure out the best possible working conditions for the treatment process.The kinetics of the removal of organic pollutants from the wastewater is analyzed with the help of three different mathematical models namely first-order model,modified Stover Kincannon model and Grau second-order model.Modified Stover Kincannon model and Grau model are proven to be a best fit for the degradation kinetics of pharmaceutical wastewater.GC–MS was utilized to confirm the treatment and assess the pathway in which the pollutants are degraded.
2.Materials and Methods
2.1.Collection of wastewater samples
The pharmaceutical wastewater sample used for this study was procured from a local pharmaceutical manufacturing unit situated near Chennai,Tamil Nadu,India.Samples were stored at 4°C until the experiments were carried out.
2.2.Assessment of the physico-chemical parameters of the real-time pharmaceutical wastewater sample
The physico-chemical characteristics of the wastewater such as BOD,COD,TDS,TSS,sulfates,chlorides,phenolic content were determined for the wastewater sample and indicated in Table S1.These parameters were checked at regular intervals while the degradation was carried out.To quantify the residues,the sample was centrifuged at 10,000 r·min?1for 20 min and the supernatant was used for the analyses.All the analyses were performed as per standard methods[9].
2.3.Isolation and screening of the microorganisms
A bacterial consortium was isolated from the soil collected from the vicinity of the pharmaceutical industrial unit.Samples were serially diluted and streaked on Luria Bertani(LB)agar plates and were incubated for 24 h at room temperature.Screening of microorganisms was carried out on a Mineral Salt Medium containing(MSM)-KH2PO4—1 g·L?1,MgSO4·7H2O—0.25 g·L?1,NH4SO4—0.5 g·L?1,NaCl—0.5 g·L?1,K2HPO4—2 g·L?1,CuSO4·5H2O—0.1 g·L?1,MnSO4·4H2O—0.1 g·L?1and FeSO4·7H2O—0.05 g·L?1[10]and 0.5%of pharmaceutical wastewater.The pure cultures of different bacterial isolates,which survived in the wastewater,were maintained on LB agar medium and utilized for the study.
2.4.16S rRNA sequencing for the identification of the isolates present in the bacterial consortium
The identification of the isolates present in the microbial consortium was carried out by 16S rRNA sequencing.At first,the DNA of the microbial cells was extracted by lysis and centrifugation and stored at ?20°C[11].The partial sequence of 16S rRNA was amplified from the DNA of the microbes extracted previously with the help of PCR and Universal primers 27F (5′AGAGTTTGATCMTGGCTCAG3′),1429R (5′TACG GYTACCTTGTTACGACTT 3′),8F(5′AGAGTTTGATCCTGGCTCAG3′)and 1541R(5′AAGGAGGTGATCCAGCCGCA3′).
PCR(Polymerase Chain Reaction)was performed with the reaction mixture containing 5 μl of isolated DNA in 25 μl of PCR reaction solution(1.5 μl of Forward and Reverse Primer,5 μl of deionized water and 12 μl of Taq Master mix containing Taq DNA polymerase,0.4 mmol·L?1dNTPs,3.2 mmol·L?1of MgCl2and 0.02% Bromophenol blue).The three stages of PCR i.e.Denaturation,Annealing and Extension was completed using the target DNA(s)as template.The PCR primers and dNTPs which did not get joined were evacuated with the assistance of MONTAGE PCR Clean up unit.27F/1429R,8F/1541R primers were utilized to sequence the PCR items and ABI PRISM?BigDyeTM Terminator Cycle Sequencing Kit with AmpliTaq?DNA polymerase enzyme from Applied Biosystems were utilized to continue with the sequencing reaction.Each template was sequenced using 16S rRNA primers.The fragments were then sterilized with ethanol,suspended in doubledistilled water and electrophoresis was performed with the purified fragments[12].The numerous alignments of sequences were carried out by MUSCLE 3.7 and Gblocks software was used to cast the noises away [13]PHYML 3.0 was utilized for phylogenetic investigation for its quick and exact approach and TREE DYN 198.3 was used for tree rendering[14].
2.5.Immobilization of the microbial consortium
Dried fiber based material derived from L.cylindrica was used as a support for the consortium.1 cm×1 cm×1 cm pieces of Luffa were cut and washed in boiling water.For further sterilization,the pieces were autoclaved at 121 °C and dried in a hot air oven at 60 °C [15].24 h bacterial consortium culture(OD600=0.52)was inoculated in an Erlenmeyer flask containing 2 g of Luffa cubes and a medium consisting of MSM with 1%of the wastewater sample.The flasks were kept in a shaking condition(100 r·min?1)at 30°C and after 48 h some of the Luffa cubes were removed for analysis.Dry weight of the immobilized microbes was analyzed by measuring the difference in weight between the immobilized Luffa cube(drying at 100°C for 2 h)and sterile unimmobilized Luffa cube.These cubes were washed for the removal of unattached cells and then analyzed with the help of SEM to study the structural morphology.
For the SEM analysis,the cubes were fixed with 4%glutaraldehyde for 24 h and 1%osmium tetroxide for 2 h.Next,the cubes were washed three to five times in 0.1 mol·L?1phosphate buffer (pH 7) and dehydrated with the help of various concentrations of ethanol(30%,40%,60%,75%,and 95%)and then stored overnight.The samples were then gold-coated and photo attached to the SEM apparatus.A fresh Luffa cube(without microbial attachments)was used as a control and SEM images were captured at 10KV.
2.6.Batch degradation of wastewater by bacterial consortium
2.6.1.Optimization of culture conditions for the degradation of raw pharmaceutical wastewater
All the optimization and batch biodegradation studies were carried out in 250 ml Erlenmeyer flasks.The immobilized microbes were inoculated in a medium consisting of mineral salts and 5%diluted wastewater for the optimization studies.Two parameters,pH and temperature,were optimized for the perfect growth of the microorganisms to attain maximum levels of pollutant removal from the wastewater sample.The effect of pH was determined by inoculating the microbes in the diluted wastewater with adjusted pH values ranging from pH 4 to pH 9.
Similarly,the optimum temperature required for biodegradation was determined by incubating the experiments from 20°C to 45 °C.Samples were monitored regularly for the degradation of COD to evaluate the optimum culture conditions.
2.6.2.Kinetics of batch biodegradation of the pharmaceutical industry wastewater
The determination of batch biodegradation kinetics was carried out to observe the rate at which the microorganisms can degrade the pollutants by using the wastewater constituents as a source of nutrition.In this study 10%,15%,20%and 25%of wastewater(diluted with MSM)were used to evaluate the rate of batch biodegradation of wastewater,with the help of a substrate utilization kinetic model following the equation(Doc.S1)[16].

where kxis the constant of degradation and S0is the initial concentration of the substrate.
2.6.3.Analysis of the enzymatic activity
Cell-free extract(CFE)used as the source for enzymes was prepared with the help of grown microbial culture(for control)and residues after 18 h and 36 h of treatment(for 25%wastewater diluted with MSM).These samples are centrifuged at the rate 3500 r·min?1for 20 min and the cells are harvested from the remnants,washed with phosphate buffer(pH 7)and sonicated at 30 A(5 strokes of 20 s at an interval of 2 min).The extract was again centrifuged at 3500 r·min?1for 20 min and the supernatant was used as the source of enzyme [15].There were majorly 4 types of enzymes produced by the consortium comprising of dehydrogenases and oxygenases.
The aldehyde dehydrogenase(ALD)activity assay was carried out by formulating a mixture of phosphate buffer(pH 8),1 mmol·L?1NAD+,1 mM of acetaldehyde and enzyme.The assay was performed at 60°C for 15 min.Change in absorbance caused by the formation of NADH due to oxidization of ALD was determined at 340 nm.One unit of enzyme denotes the amount of enzyme utilized for the production of 1 μmol of NADH in 1 min[17].
The monooxygenase activity was accomplished by the formulation of a mixture containing MOPS buffer(pH 7.4),1.65 mmol·L?1NADH and an adequate amount of enzyme and the assay was performed at 24°C at 340 nm.One unit of enzyme is defined as the amount of enzyme exploited for the oxidation of 1 μmol NAD per minute[18].
Catechol 2,3-dioxygenase activity was monitored by the formation of 2-hydroxymuconic semialdehyde at 375 nm with the help of a mixture containing potassium phosphate buffer (pH 7) and 1 mmol·L?1catechol and appropriate amount of enzyme.One unit of enzyme corresponds to the amount of enzyme required to produce 1 μmol of 2-hydroxymuconic semialdehyde in 1 min[19].
Hydroxyquinol 1,2-dioxygenase activity was carried out with a mixture of 0.06 mol·L?1potassium phosphate buffer(pH 6.5),1 mmol·L?1of hyroxyquinol and enzyme solution.Enzyme activity was monitored at 243 nm and one unit of enzyme is defined as the amount of enzyme used to catalyze the production of 1 μmol·L?1of maleylacetate in 1 min[20].
All the enzymatic activity experiments were carried out in triplicates and the average value was estimated as the total activity of the enzymes for a certain period.
2.7.Continuous treatment of wastewater in an Aerobic Fixed Film Bioreactor(AFFBR)
2.7.1.Set-up of AFFBR
The continuous treatment of the wastewater was carried out in a plexi-glass reactor with a height of 61 cm and an internal diameter of 12.5 cm.The total volume of the reactor was 15.5 L,whereas the working volume was kept at 14 L.Numerous Luffa pieces were fixed inside the reactor column,which worked as a support material for the microbial consortium.The air was supplied from the bottom of the reactor with the help of a bubble-diffusing aerator.The pH and temperature were adjusted to 7 and(35±0.5)°C for the entire procedure as per the culture condition optimization studies conducted during the batch treatment process.
2.7.2.Start-up of the reactor
To start the continuous process,the first step involved the growth of the biofilm on the Luffa support,hence the microbial consortium was inoculated along with MSM and passed through the reactor for a duration of 80 h(till the biofilm covered the support media).After considerable growth of microbes on the support,the treatment of the wastewater was initiated.
2.7.3.Operation of the AFFBR
The first load of wastewater had an OLR of (0.56 ±0.002)kg COD·m?3·d?1with the HRT of 24 h(or 1 day).Both the OLR and HRT were varied as the reactor ran for 61 days.There were 3 different HRTs — 24 h (1 day),16 h (0.67 days approximately)and 10 h(0.41 days approximately).The whole reaction was divided into 3 phases,and the duration of each phase ranged from 15 to 21 days.The OLR ranged from (0.56± 0.002) kg COD·m?3·d?1to(3.35 ± 0.004) kg COD·m?3·d?1.The dissolved oxygen was kept constant for the whole operation at 3 mg·L?1.Samples were obtained every single day to determine the COD,TSS and Total Phenolic Content (TPC) in the influent and the effluent wastewater.All the analyses were carried out according to the standard methods[9].
2.7.4.Kinetics depicting the performance of the reactor
Since the reactor functions differently in continuous operations than a batch process,three different models were selected to analyze the kinetics involved in the mechanism of treating the wastewater.
2.7.4.1.First-order substrate removal.In the reactor,the change in the substrate(contaminants acting as a nutrient source for the microbes)follows the kinetic equation[21]
where,QI(g·L?1)is the influent,and QE(g·L?1)is the effluent.KR(d?1)is the substrate removal constant,V(L)is the volume of AFFBR and F(L·d?1)is the rate of flow of the influent.
Now the value of KRcan be obtained by plotting a graph QEversus[(QI?QE)/HRT]where the value of KRis obtained by estimating the slope of the line.
2.7.4.2.Modified Stover Kincannon model.Modified Stover Kincannon is a model that analyzes substrate removal in a continuous process(in a reactor) with the help of immobilized systems [22].The equation supporting the model is

Linearizing the equation,
Here Umax(g·L?1·d?1)is the rate constant for maximum utilization of substrate and KL(g·L?1·d?1)is the constant for saturation value,and to calculate these factors a graph of(V/FQI)versus[V/{F(QI?QE)}]was plotted.
2.7.4.3.Second-order substrate removal by Grau Model.Another model utilized for this study is the Grau model.This model was coined for the removal of multi-component substrates in a system [23].It is expressed as
Integrating&Linearizing Eq.(10)
Simplifying the equation consideringa constant‘a(chǎn)’&putting

where‘b’is a dimensionless Grau constant.
The graph plotted for this model was HRT versus[(QI×HRT)/(QI?QE)]to estimate the values of‘a(chǎn)',‘b’and KY.
2.8.Analysis of degradation by GC–MS
The purpose of the bacterial consortium is to degrade the contaminants present in the wastewaters and use it as a nutrient substrate.The treated(cell-free supernatant after centrifugation at 10,000×for 20 min)and untreated samples were extracted,derivatized and analyzed using GC–MS.The instrument used for GC–MS was an Agilent 7890B GC along with a 5977MSD for Mass Spectroscopy.Helium was used as a carrier gas with a flow rate of 1 ml·min?1.The column temperature was programmed at 50 °C for 5 min and then raised at the rate of 10°C·min?1and then held at 250°C for 8 min.The scan mode was full and the mass spectra were recorded in the range of 30–550(m/z).The identification of the compounds and the degradation was analyzed by the NIST library[24].
3.Results and Discussion
3.1.Characterization of the wastewater
The characteristics of the wastewater collected from the pharmaceutical manufacturing industry are documented in Table S1.It was noted that the level of pollutants such as COD,phenolic substances and suspended solids were quite high.
3.2.Identification of the microbial isolates
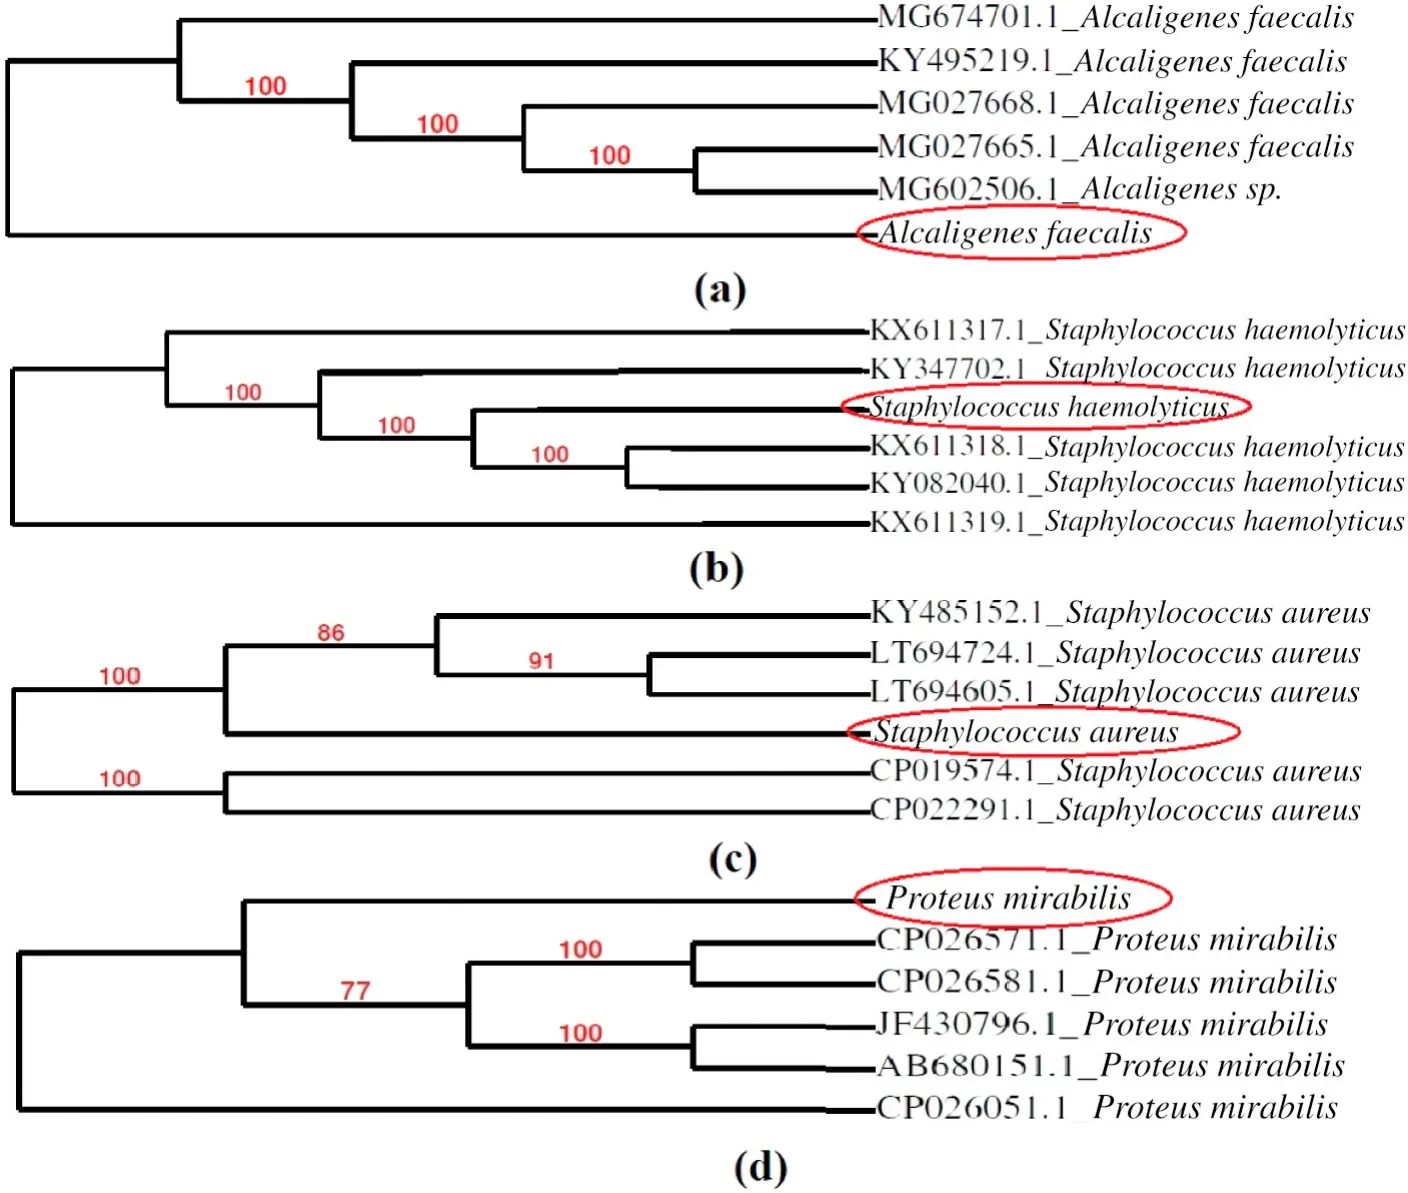
Fig.1.The isolated bacterial strains(a)Alcaligenes faecalis(PE I);(b)Staphylococcus haemolyticus(PE II);(c)Staphyloccus aureus(PE III);(d)Proteus mirabilis(PE IV).
A mixed bacterial consortium was isolated from the soil collected from the vicinity of the pharmaceutical manufacturing unit,consisting of several strains.Out of them,4 isolates were selected according to their survival capacities and were preserved on L.B.plates.These strains were efficient and showed ample growth in pharmaceutical wastewater.As it was isolated from the proximity of the pharmaceutical industry,it was not difficult for the microorganisms to survive in the toxic environment.Biochemical tests were performed to identify the microbes and their characteristics(Table S2).Identification was confirmed by 16S rRNA sequencing and the BLAST search.The microorganisms were revealed to be Alcaligenes faecalis(PE I),Staphylococcus haemolyticus(PE II),Staphyloccus aureus(PE III)and Proteus mirabilis(PE IV)(Fig.1).The sequences were submitted to NCBI GenBank and the Accession numbers were assigned to each of the strains respectively,A.faecalis -MG995024,S.haemolyticus-MG995021,S.aureus-MG576208 and P.mirabilis-MH021605.Thus being from the same environment,these microbes readily adapted into the polluted wastewater environment and utilized the organic contaminants as a source of nutrition.The microbes present in the consortium have been previously reported for degrading various kinds of wastewater.A.faecalis has been reported to treat ammonia based wastewater[25]and also for the degradation of pharmaceuticals such as Sulfamethoxazole[26],while S.aureus and P.mirabilis has been used to treat tannery wastewater [27]and azo dyes [28]respectively.
3.3.Immobilization of the microbial consortium of Luffa
Initially,when the cells attach to Luffa,the process is reversible,but as the cells adapt onto it and produce Extra Polymeric Substance(EPS)layer,the bind is quite strong.When the pre-grown microbial consortium was made to attach and form a biofilm on Luffa,it was quite effective.The dry weight of the microbes on Luffa was analyzed to be(0.062± 0.002) g confirming that the microbes were indeed capable of forming a biofilm.
For further confirmation,the SEM analysis was performed.The SEM images confirmed that the microbes did produce a biofilm and gave an idea about its structure.The unimmobilized Luffa(control)showed the presence of fibrous networks,an uneven structure which looked ideal for the growth of the microbes.On the immobilized Luffa,the accumulation of the microbes was quite visible.Fig.2 indicates the formation of an extra-cellular matrix(uneven film-like structure)which confirms the formation of biofilm.There are several studies that depict that all the four strains present in the consortium are capable of producing biofilm,but the growth of these microbes on Luffa has not been reported yet.
3.4.Batch biodegradation studies
3.4.1.Optimization of culture conditions
The optimization procedure was carried out to give the microbes a proper environment to grow and degrade the wastewater contaminants.pH and temperature are the two parameters optimized for the wastewater degradation study.Most of the bacterial species thrive at pH 6.5 to 7,thus for optimization purposes,the pH of the wastewater was varied from 4 to 9 The effect of pH on the microbes for the reduction of the contaminants is demonstrated in Fig.S1a.It is noted that COD and phenol reduction efficiency are highest at pH 7–8.However,pH of 4 to 6 shows very low efficiency,thus establishing that the consortium grows well at neutral pH and displays poor activity at lower and higher pH.
As for the optimization of the temperature,it was varied from 20°C to 45°C(20°C,25°C,30°C,35°C,40°C,45°C).It was observed that the reduction in COD and phenols were quite high at 30°C and 35°C,while the lower and higher temperatures showed lesser reductions of pollutants.Thus the temperature of the reaction was maintained at a range of 30°C to 35°C(Fig.S1b).All the experiments were performed simultaneously.It must be noted that these culture conditions were constant for the batch as well as the continuous treatment of the wastewater.
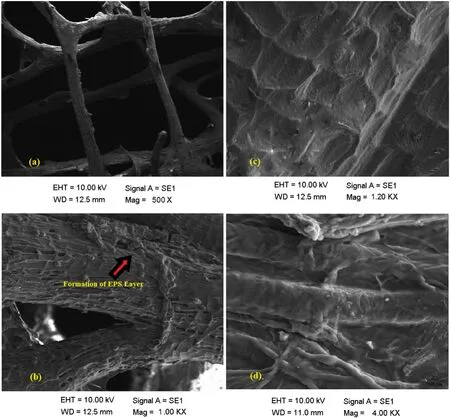
Fig.2.SEM images of(a)unimmobilized Luffa(b)unimmobilized Luffa at a higher magnification(c)immobilized microbes on Luffa and formation of EPS layer(d)magnified look of the biofilm formed on Luffa.
3.4.2.Kinetics of biodegradation
The kinetic studies for the degradation of the contaminants by the microbial consortium in a batch process were determined for diluted wastewater.Four different concentrations of wastewater (10%,15%,20%,and 25%)was considered.It was noted that the immobilized microbes degraded each of the samples quite commendably and the maximum time taken for degradation was 36 h.The kinetic parameters were calculated for each dilution and it was revealed that the pattern of degradation followed first-order kinetics(Table S3).The consortium successfully degraded contaminated wastewater without any external nutrient source.The biodegradation kinetics gives a clear idea about the rate at which pollutants are degraded.The microbes work as a consortium producing various enzymes and degrade the pollutants.It was noted that in the lower concentrations(10%to 20%)the half-life of the pollutants was 20 h,but when the concentration was increased to 25%of wastewater,the half-life was reduced to 18 h,and by the end of 36 h the pollutants of the wastewater was totally mineralized.Thus it could be observed that the increase in concentration increases the nutrients in the treatment process,giving a chance to the consortium to act upon it,thus increasing the rate of biodegradation and lowering the half-life.Analogous to our study,an attempt to degrade oily wastewater was reported where a group of microbes consisting of Pseudomonas sp and Bacillus sp degraded oil content following the first-order biodegradation kinetics[29].
3.4.3.Enzymatic activity
The bacterial strains were indeed capable of degrading the contaminants present in the wastewater and the enzymatic activity provided the idea of the degradation mechanism.Five different enzymes were identified during the enzymatic activity study(Table 1).Aldehyde dehydrogenase activity exhibited quite a significant increment in its performance in the 36 h treated samples when compared to the controls and the 18-h samples.Similarly,the oxygenase based enzymes were quite active too.The average activity exhibited by monooxygenase in the 36 h period was (19 ± 0.7) units whereas the catechol 2,3-dioxygenase activity was estimated to be(21±0.6)units,which was the highest noted among the enzymes assayed.Two more enzymes namely alcohol dehydrogenase and hydroxyquinol 1,2-dioxygenase showed activities of(16±0.5)units and(13±0.8)units respectively.The function of these enzymes is dynamic and each of them help in the metabolism of the polluting components.Further details about the effect of enzymes on the pollutants are discussed in the later part of this article.
3.5.Performance of AFFBR
After the batch treatment of the pharmaceutical wastewater,the continuous treatment was initiated (Fig.3).Before introducing thewastewater,the inoculum was fed to the reactor and the microbes were made to grow on the support matrix for about 80 h till the formation of the biofilm,which was confirmed visually.After 80 h the wastewater was introduced into the system,starting the treatment process which continued for 61 days.At the initial phase the OLR was kept minimum(0.56 ± 0.05) kg COD·m?3·d?1and at high HRT of 24 h to achieve steady-state.As the experiments progressed the OLR was increased and the HRT was decreased.Details of the experiments are provided in Table 2.
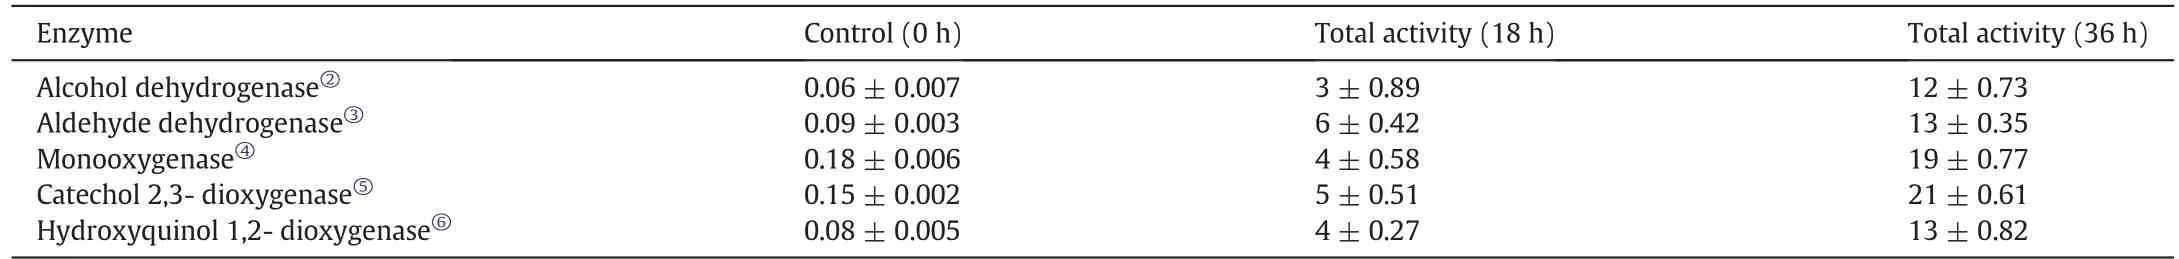
Table 1 Enzymatic activity during the batch-wise treatment of pharmaceutical wastewater①
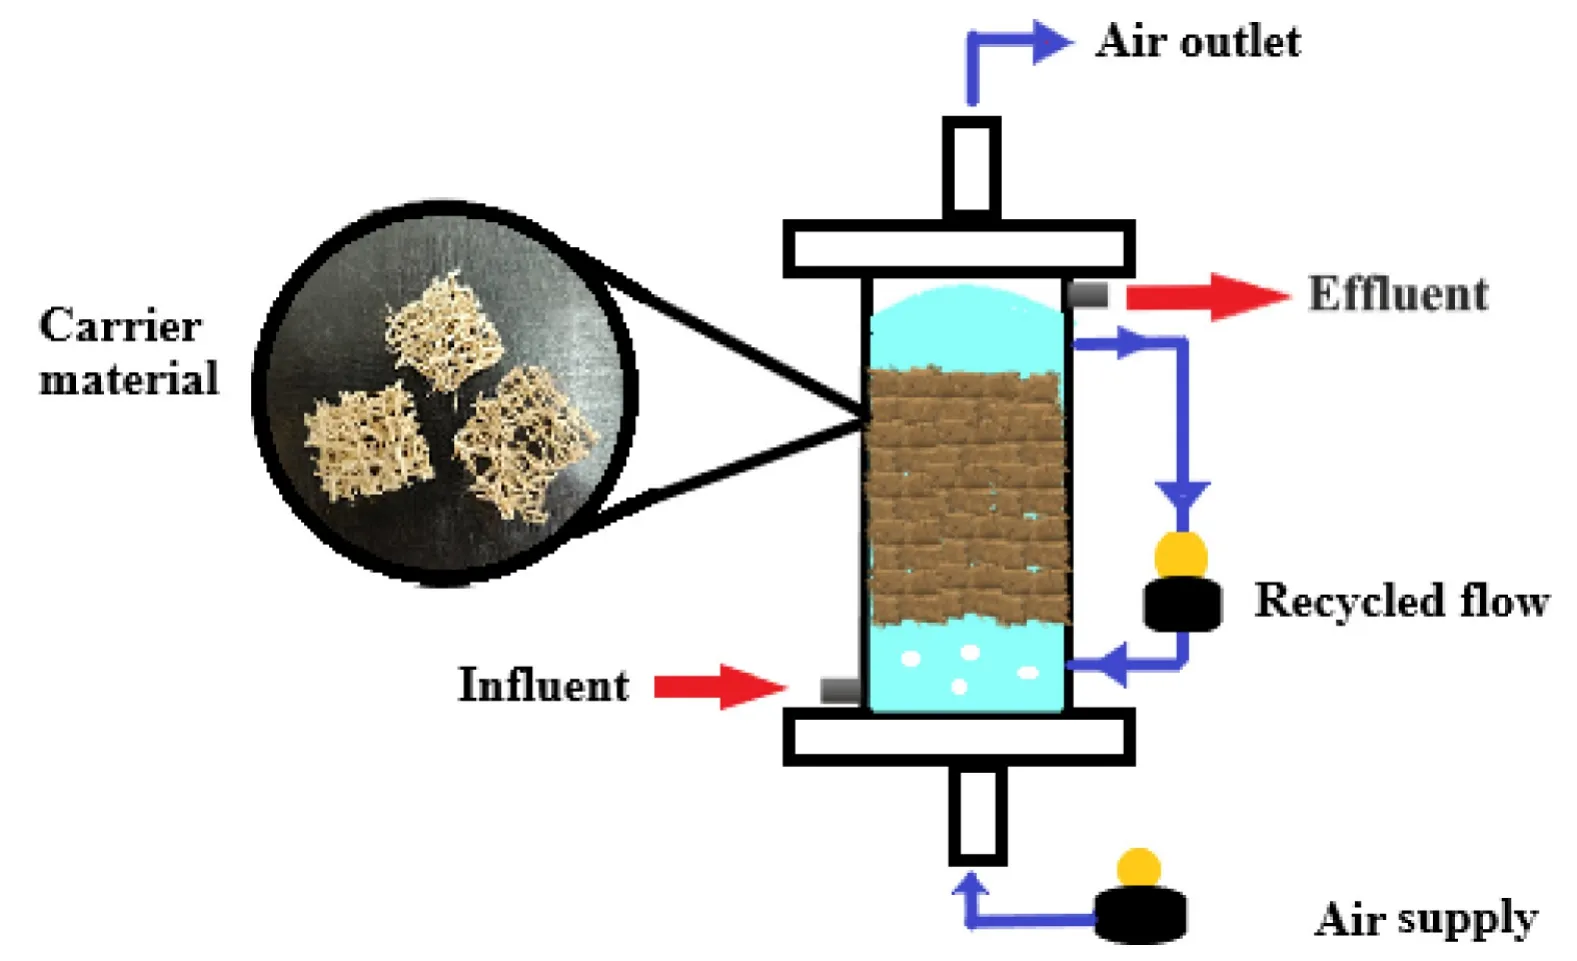
Fig.3.The experimental set-up of the AFFBR.
3.5.1.Removal of COD
After the start-up of the reactor,the initial loading of (0.56 ±0.05) kg COD·m?3·d?1was introduced into AFFBR.Slowly the OLR was increased while maintaining the steady-state and finally the OLR reached(3.35±0.04)kg COD·m?3·d?1by the end of the treatment process.There were majorly 3 phases in the experiment due to the change of HRT.The influent COD ranged between 556.62 mg·L?1to 3360 mg·L?1while the effluent ranged between 32.61 mg·L?1to 236.57 mg·L?1.Although the influent range was quite broad the effluent did not cross 250 mg·L?1,which is the Indian standard COD effluent discharge limit.The treatment was quite effective which was indicated by the removal percentages ranging from 86.8%to 96.83%.The maximum pollutant removal efficiency ranged between 93%and 96.8%,the efficiency decreases as the HRT decreases.This could be due to the shorter contact time between the wastewater and the biofilm.The other change which was noticed was the sharp dip in the degradation efficiency when the HRT changes,which was caused by shock due to the change in contact time and the simultaneous increase in OLR[30].The whole process is illustrated in Fig.S2.In a similar study 80% of COD content was reduced by an HRT of 7 h and 95% of COD was removed at an HRT of 14 h from a high strength industrial wastewater treated by a Glycogen Accumulating Organism(GAO)Biofilm based reactor,thus signifying the importance of a higher HRT[31].
3.5.2.Removal of Total Phenolic Components(TPCs)
TPC removal efficiency in AFFBR was determined in 3 phases(according to the change in HRT),similar to the COD removal strategy.TPC influent ranged from 501.36 mg·L?1to 1532.81 mg·L?1along with the increase in OLR.Fig.S3 shows the performance of the reactor towards TPC removal.It was noted that as the concentrations of phenol increased from 500 mg·L?1to 1200 mg·L?1,the removal efficiency increased exponentially ranging from 78.5%to 92.6%,but when the concentration of TPCs were further increased till 1532 mg·L?1,the reduction rates were quite stagnant.This can be explained by the fact that the microbes were not supplied with an external nutrient source.The only way the microbes could survive was by extracting nutrient from the wastewater.Phenol was one such component which could provide the required nutrients [32].The stagnancy of the removal rates is due to the fact that the microbes can only tolerate up to a certain level of TPC i.e.as the concentrations are increased till 1200 mg·L?1there is an increase in the metabolic activity,thus the appearance of growth and high removal efficiency.But from 1200 mg·L?1to 1532 mg·L?1there is an excess of TPCs,so the metabolism is passive which leads to a stagnant rate of degradation.HRTs of 24 h (1 day)and 16 h (0.67 days) was quite effective,due to the longer contact time between the biofilm and the wastewater,but 10 h wasn't as effective thus concluding that HRTs of 24 h and 16 h are optimum for the pollutant removal.
The samples were monitored every day and it was noted that there were several organic metabolites of phenol produced in the degradation process.At the beginning of the experiment with higher HRTs,the treatment was quite fast and phenol and its metabolites were mineralized readily and difficult to detect.But by the end of the experiment the metabolism of the microbes was slow,thus the intermediates were easily detectable.In a similar study phenols were removed from a coal pyrolysis wastewater with the help of a moving bed biofilm reactor.The TPC ranged from 230 to 550 mg·L?1and the removal efficiency was around 90%[33],thus establishing that the performance of the AFFBR in our study is exceptional.Details of the intermediates and the degradation pathway are provided in Section 3.7.
3.5.3.Removal of Suspended Solids
The Total Suspended Solids(TSS)increased simultaneously with the variations in OLR and ranged from 87.4 mg·L?1to 286.35 mg·L?1.The other parameter which was measured along with TSS was Volatile Suspended Solids(VSS).The initial ratio of VSS:TSS was 0.68 which indicates the presence of organic components in the wastewater.During the treatment process the VSS:TSS ratio increased to 0.85 and the removal efficiency decreased(Fig.S4).This could be due to the shock on the biofilm for the change in OLR and decrease in HRT.The shear stress provided by these two parameters results in detachment of microbial cells from the biofilm thus increasing the TSS[34].The loading shock increases the TSS output which washes out of the system with the effluent.This phenomenon increases the amount of suspended solids and the VSS:TSS ratio in the system but decreases the removal efficiency[35].
3.6.Kinetics of pollutant removal in the reactor
The following models give an idea about the performance of AFFBR for the degradation of the pollutants(Fig.4).
3.6.1.First-order model
The experimental data of the AFFBR model was applied to the firstorder kinetics.As shown in Eq.(4),the substrate removal constant KRwas calculated by plotting a graph QEversus[(QI?QE)/HRT](Fig.4a),where QIand QEare the influent and effluent levels.KRwas found to be 26.61 d?1while the correlation coefficient (R2) was 0.71.The R2being low,it could be suggested that the first-order model is not the best fit for the kinetics of AFFBR.The value of the constant KRis almost similar to the substrate removal constant which reported in a similar study where phthalate components were removed from a synthetic wastewater with the help of a moving bed biofilm reactor[36].It is suggested that the higher the KRvalue,higher is the degradation capacity of the microbes[37].
3.6.2.Modified Stover Kincannon model
Modified Stover Kincannon model data is provided by plotting the reciprocal of the total OLR(V/F*QI)versus the reciprocal of the total Organic Loading Removal Rate[V/{F(QI?QE)}](Fig.4b).The coefficient of correlation(R2)was 0.99 thus implying that this model can aptly demonstrate the kinetics of AFFBR.Since the graph was linear,thus leastsquare method was used to determine the constant for saturation value,KL,and the constant for maximum utilization of the substrate Umax.On the graph,the straight-line intercept is‘1/Umax’while the slope corresponds to‘KL/Umax’.The values were evaluated to be 90.01 g·L?1·d?1,and 95.12 g·L?1·d?1for Umaxand KLrespectively.
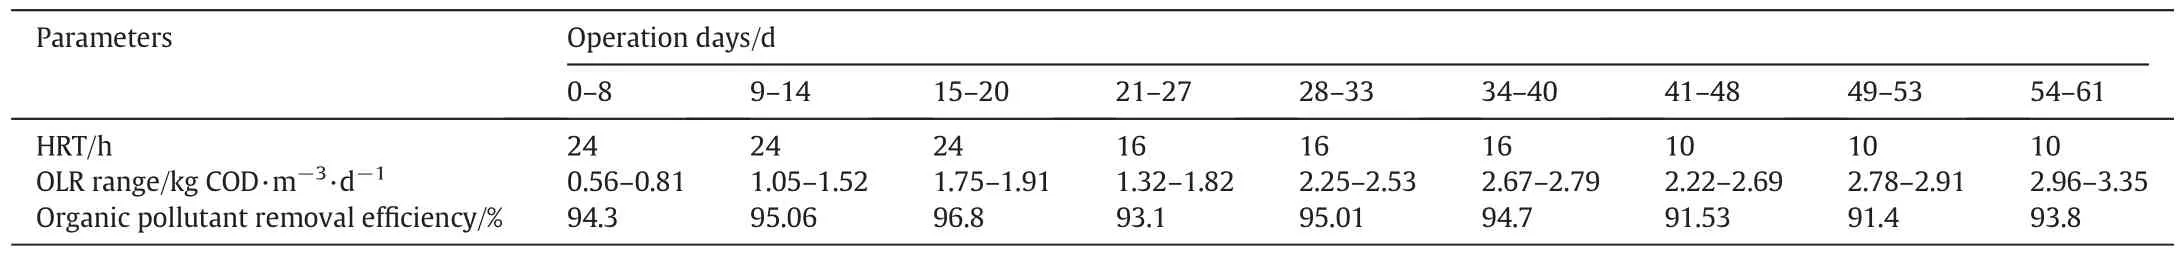
Table 2 Operational details of the bioreactor
3.6.3.Grau second-order model
The final model which was utilized to determine the kinetic pattern for the treatment of wastewater in the reactor was Grau second-order model.R2in the Grau model was analyzed to be 0.98,almost similar to the modified Stover Kincannon model,indicating that both the models could be applied for the kinetic studies.The graph plotted for this model was HRT versus[(QI×HRT)/(QI?QE)](Fig.4c).The values for‘a(chǎn)’and‘b’(refer Eq.(12))estimated from the intercept and slope of the straight line present in the graph were determined to be 0.012 d?1and 1.062 respectively.The substrate removal constant‘KY’,was derived from the calculation of“a=(QI/KYXI)”.The value of KYwas determined to be 1.074 d?1for the influent COD of 556.62 mg·L?1at the HRT of 24 h.
3.6.4.Assessment of the modified Stover Kincannon and Grau models
The data obtained for the determination of the kinetic performance in AFFBR depicts that the modified Stover Kincannon model and the Grau model are the best fit.Table 3 gives a summary of the constants achieved in the present study and compares it with similar studies that were carried out previously.For the modified Stover Kincannon model,it is noted that our values of saturation constant KLand the rate of maximum utilization of substrate Umaxare quite high in comparison to other studies[38].This could be due to the higher OLR values,which provides enough substrates for the microbes thus increasing the removal rate.For the Grau model,the value of the substrate removal constant KYis at par with other studies,proving that our system is indeed capable of removing the pollutants.
3.7.GC–MS analysis for the confirmation of the degradation
The GC–MS analysis was carried out for the untreated,intermediate and treated pharmaceutical wastewater samples to understand the pathway in which the pollutants are mineralized and to determine the capability of the consortium for the treatment of the wastewater(Fig.S5).It was observed that the consortium degraded the organic contaminants present in the wastewater excellently.GC–MS analysis gave an idea about the contaminants present in the wastewater,the intermediates formed during the process and the end-products of the degradation study(Table S4).
The untreated sample showed 8 main peaks mainly comprising of phenolic and hydrocarbon based organic pollutants.In the intermediate sample,it was noted that most of the compounds were degraded to a certain extent.The capability of the consortium to degrade the pollutants was reflected in the GC–MS data,and degradation is mainly due to enzymatic activity.The monooxygenase and dioxygenase enzymes specifically targeted the major organic compounds such as alcohols,phenols,and aromatics,transforming them into simpler substances.Phenol was degraded into catechol by the action of monooxygenase.Catechol happened to be an intermediate and was further degraded by the action of catechol 2,3-dioxygenase producing a 2-hydroxymuconic semialdehyde residue which can be further degraded in the TCA cycle [43].Another phenolic compound degraded by the microbes is 2,4,6-trichlorophenol,which is a derivative of the pharmaceutical industry products.This compound was degraded by the action of monooxygenase forming the intermediate product 6-cholorohydroxyquinol.The intermediate was finally degraded and a 2-choloromaleylacetate remnant was formed,which again can be degraded in the TCA cycle by the microbes [20].Similarly,1-chlorobenzene was another compound observed in the untreated samples.This compound was degraded by monooxygenase and catechol 2,3-dioxygenase enzyme reaction producing intermediates such as 3-chlorocatechol and 3-chloro-2-hydroxy semialdehyde,which by the action of aldehyde dehydrogenase was further converted to a 2-hydroxy muconate residue[44].Fig.5 gives a consolidated detail about the entire metabolic process.
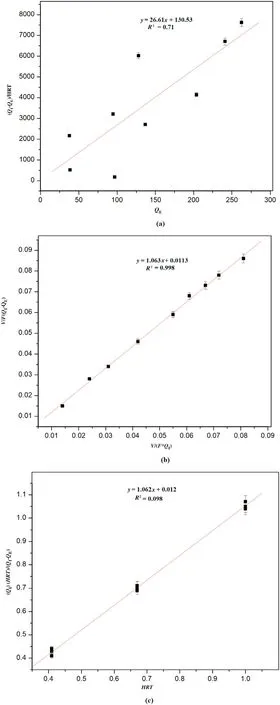
Fig.4.The kinetic details of the continuous treatment process(a)first-order model and(b)modified Stover Kincannon Model(c)Grau Second order model.
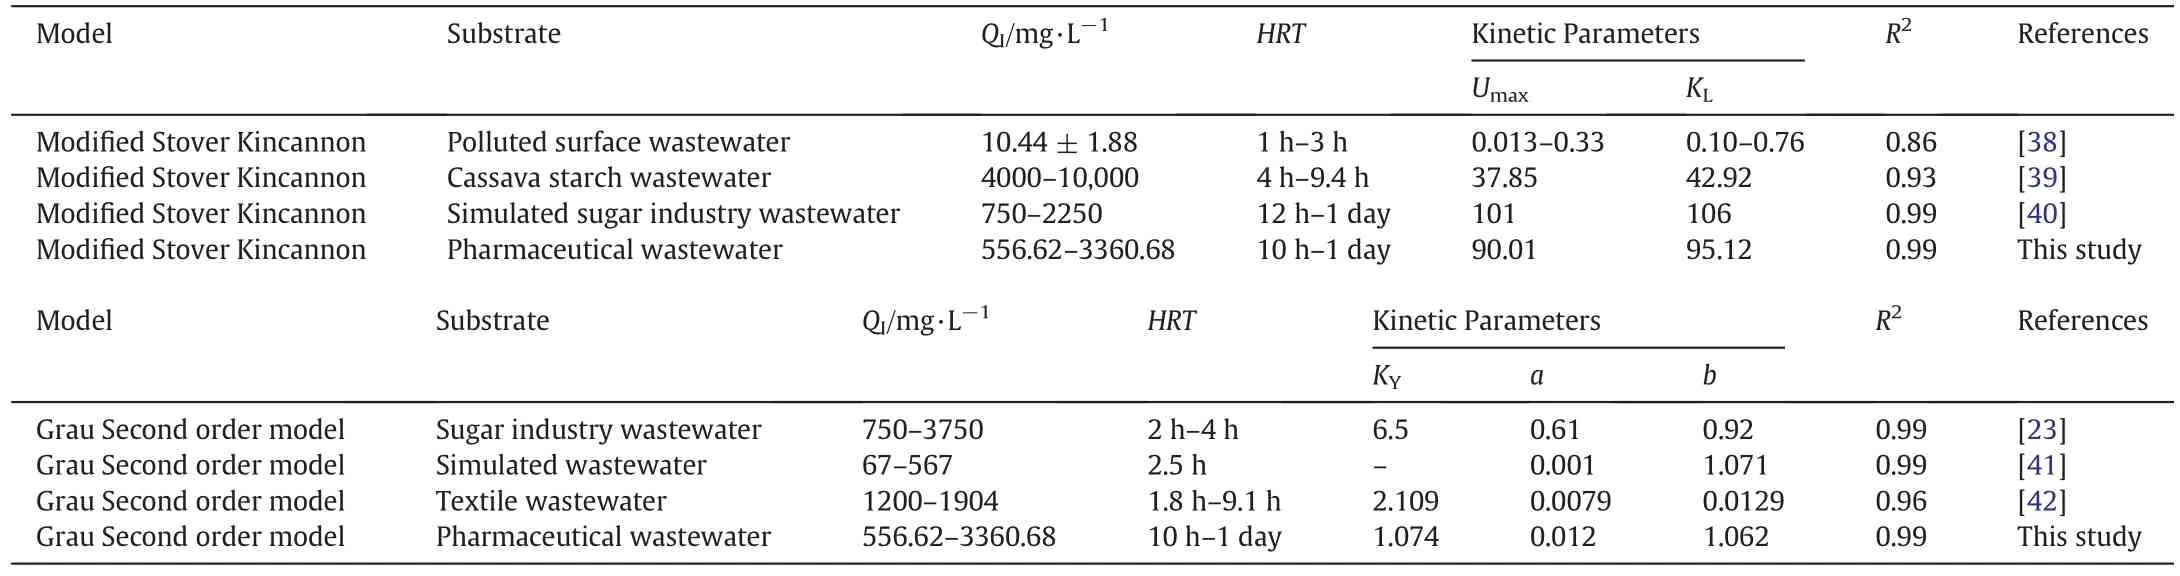
Table 3 Assessment of the Modified Stover Kincannon and Grau Second order models and Comparison with previous studies
4.Conclusions
The pharmaceutical wastewater samples were toxic and contained huge amount of contaminants but the immobilized consortium was able to mineralize most of it.The batch degradation confirmed the biodegradability of the immobilized microbes.One of the main reasons for degradation was the enzymes,alcohol dehydrogenase,aldehyde dehydrogenase,monooxygenase,catechol 2,3-dioxygenase,and hydroquinol 1,2-dioxygenase produced by the microbes.The continuous study carried out in the AFFBR predicted the degradation kinetics and the possible pathway followed by the organic pollutants.This consortium can be further used for the large scale studies in industrial level.Investigations can also be carried out to understand the biodegradation potentiality of the consortium to treat other kinds of wastewater.
Acknowledgements
The authors wish to express their gratitude for the support extended by SSN College of Engineering,Chennai,Tamil Nadu,India.
Supplementary Material
Supplementary data to this article can be found online at https://doi.org/10.1016/j.cjche.2020.04.008.
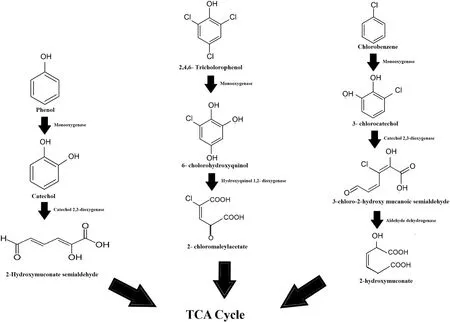
Fig.5.The degradation pathway followed by the organic contaminants present in the wastewater.
 Chinese Journal of Chemical Engineering2021年1期
- Chinese Journal of Chemical Engineering的其它文章
- Highly interconnected macroporous MBG/PLGA scaffolds with enhanced mechanical and biological properties via green foaming strategy
- Preparation and properties of a low-cost porous ceramic support from low-grade palygorskite clay and silicon-carbide with vanadium pentoxide additives
- An efficient preparation of porous polymeric microspheres by solvent evaporation in foam phase
- Engineering practice and economic analysis of ozone oxidation wet denitrification technology
- A polypropylene melt-blown strategy for the facile and efficient membrane separation of oil–water mixtures
- Pyrolysis of single large biomass particle:Simulation and experiments