Image texture indices and trend analysis for forest disturbance assessment under wood harvest regimes
Abdolrassoul Salmanmahiny · Malihe Erfani · Afshin Danehkar · Vahid Etemad
Abstract Effective disturbance indices for Hyrcanian forests in Kheyroud, Nowshahr, Iran were determined. The study area was divided into landscape mosaics based on ecosystem parameters including profile type, slope and elevation. Co-occurrence texture indices were derived as forest disturbance factors on the first five bands of Landsat TM, ETM+ and OLI images for the prevailing wood harvest disturbance regimes. These indices were screened using ten types of trend analyses and used for modeling disturbance of the harvesting regime through artificial neural networks. The results show that the selected indices can be useful in distinguishing areas with different disturbance intensities and as such, used in the context of health assessment through the health distance method. The accuracy of the health maps derived from the indices [increasing disturbance] led to give rise higher disturbance classification accuracy.
Keywords Ecosystem health · Disturbance · Trend analysis · Co-occurrence texture indices · Landscape mosaics
Introduction
Forest health definitions include utilitarian-centered and ecosystem-centered approaches. While healthy forests satisfy human needs and management objectives in the utilitarian approach, in the ecosystem-centered approach, resistance and resilience to disturbance and biophysical processes defines forest health (Kolb et al. 1994; Lausch et al. 2016). Forest health can be investigated at a scale of an individual tree up to landscape levels (Kolb et al. 1994), and by increasing the scale, the assessment of forest health becomes more diffi cult (Lausch et al. 2016). It may address patterns and extent of disturbances caused by human changes in ecosystem services (Kremen and Ostfeld 2005). In forest ecosystems, disturbance means both natural and anthropogenic events that affect biomass and species (Grime 1977) and gradual processes that may include canopy openings through exploitation of trees (Su Mon et al. 2012), selection cutting (Hirschmug et al. 2014; Erfani et al. 2017a, 2018); vertical structure changes, and various other actions (Panta et al. 2008). To evaluate the forest health status, structural, functional and resilience indices are needed (Costanza et al. 1992).
Remote sensing records spectral traits that can be used for forest health assessment. There are numerous types of indicators to quantify forest health based on remote sensing data (Lausch et al. 2016). Franklin et al. ( 2001), Clausi ( 2002), Narasimha Rao et al. ( 2002), Podest and Saatchi ( 2002), Butusov ( 2003), Ravikumar ( 2008), Tassetti et al. ( 2010) and Czerwinski et al. ( 2014) used texture indices from satellite images to survey forest structure, species diversity and forest degradation. Occurrence, co-occurrence, diversity and richness are some of the indices for texture analysis derived from remotely-sensed images (Angelo and Haertel 2003).
To model ecosystem heath using remote sensing data, various methods can be used, of which artificial neural networks (ANN) have been employed (Chen et al. 1995; Dal and Khorram 1999; Bruzzone and Fernandez Prieto 2000; Clifton 2003; Yuan et al. 2009; Cracknell and Reading 2014). To increase the accuracy of image classification, texture indices can be used (Butusov 2003; Tassetti et al. 2010). Trend analyses are also useful in showing growth and decline of forests, as carried out by Czerwinski et al. ( 2014) for temperate forests.
In this study, the health of Hyrcanian forests of Iran was examined in relation to timber harvesting using texture indices of Landsat satellite imagery. As such, in this study, disturbance or absence of disturbance has been used interchangeably to denote lack of health or health of the forest, respectively. During the last several decades, these forests experienced a sharp decrease in area and quality in terms of species diversity and composition (Marvie Mohadjer 2012). Areas without wood harvest were considered as a reference and other areas used as treatments. Extensive field work and past records of the conditions (number of management plans and harvesting years) provided the necessary data.
Materials and methods
Study area
Kheyrud Forest has an area of approximately 8000 ha 7-km east of Nowshahr City, northern Iran, between latitudes 36° 28′ and 36° 36′ N and longitudes 51° 33′ and 51° 41′ E (Fig.1).
Minimum and maximum elevations are 10 and 2,200 m a.s.l. The most common soil type is calsisols (Sarmadiyan and Jafari 2001) and average rainfall ranges from 1313 to 1484 mm/year. The typical disturbance driver in the region is timber harvesting with selective cutting regimes. Grazing by cattle and use of forest products by local people are other impacts in this area. The forest types are hardwoods and the commercially important species are Fagus orientalis Lipsky, Quercus macranthera Fisch and C. A. Mey ex Hohen., and Quercus castaneifolia C. A. Mey that appear in climax communities, and Carpinus betulus L., Acer cappadocicum Gled, and Alnus subcordata C. A. Mey that appear in subclimax communities (Erfani et al. 2017b).
Changes in species composition of stands to early successional species and a reduction of tree volume per hectare were reported in studies in Kheyrud Forest by Erfani et al. ( 2017a, 2018). These changes relate to both utilitarian-centered and ecosystem-centered approaches to forest health assessment which were followed in our study in the three districts (Table 1, Fig.1).
Methodology
Different stages of this research are shown in Fig.2 and are described below.
Defining homogeneous zones
Homogeneous zones are areas expected to show the same response to a specific disturbance. The study area was divided into homogeneous zones using profile type, slope and elevation layers at a medium scale (1: 250,000 to 1:1,000,000) (Bailey 2009). The class boundaries in these layers were determined according to Hammond’s plan (Hammond 1954, 1964) (Table 2). The profile type layer was derived from the upland-lowland and the classified slope layers extracted from the digital elevation model (DEM) with 30 m pixel size. For this layer, we averaged elevationin each map unit (watersheds or districts), and then determined the percentage of gentle slopes (up to 8%) occurring in highlands and lowlands. In each watershed or district, the average elevation was considered as the boundary between highlands and lowlands and the slope layer was classified into slopes up to 8% and8% (Table 2).
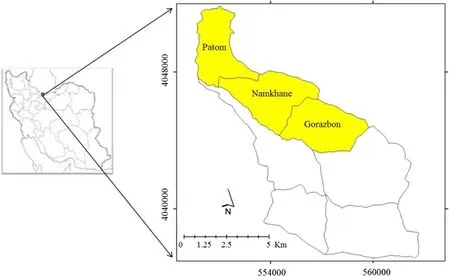
Fig.1 The study area and its districts (Patom, Namkhane, and Gorazbon)

Table 1 Three districts of forest harvesting in the area
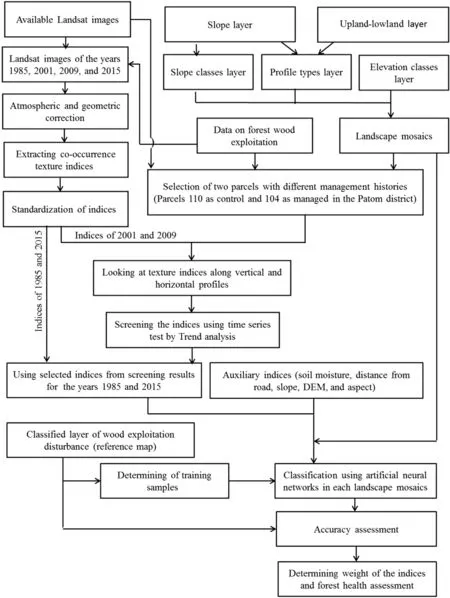
Fig.2 Conceptual model of the research

Table 2 Profile type, elevation and slope classes
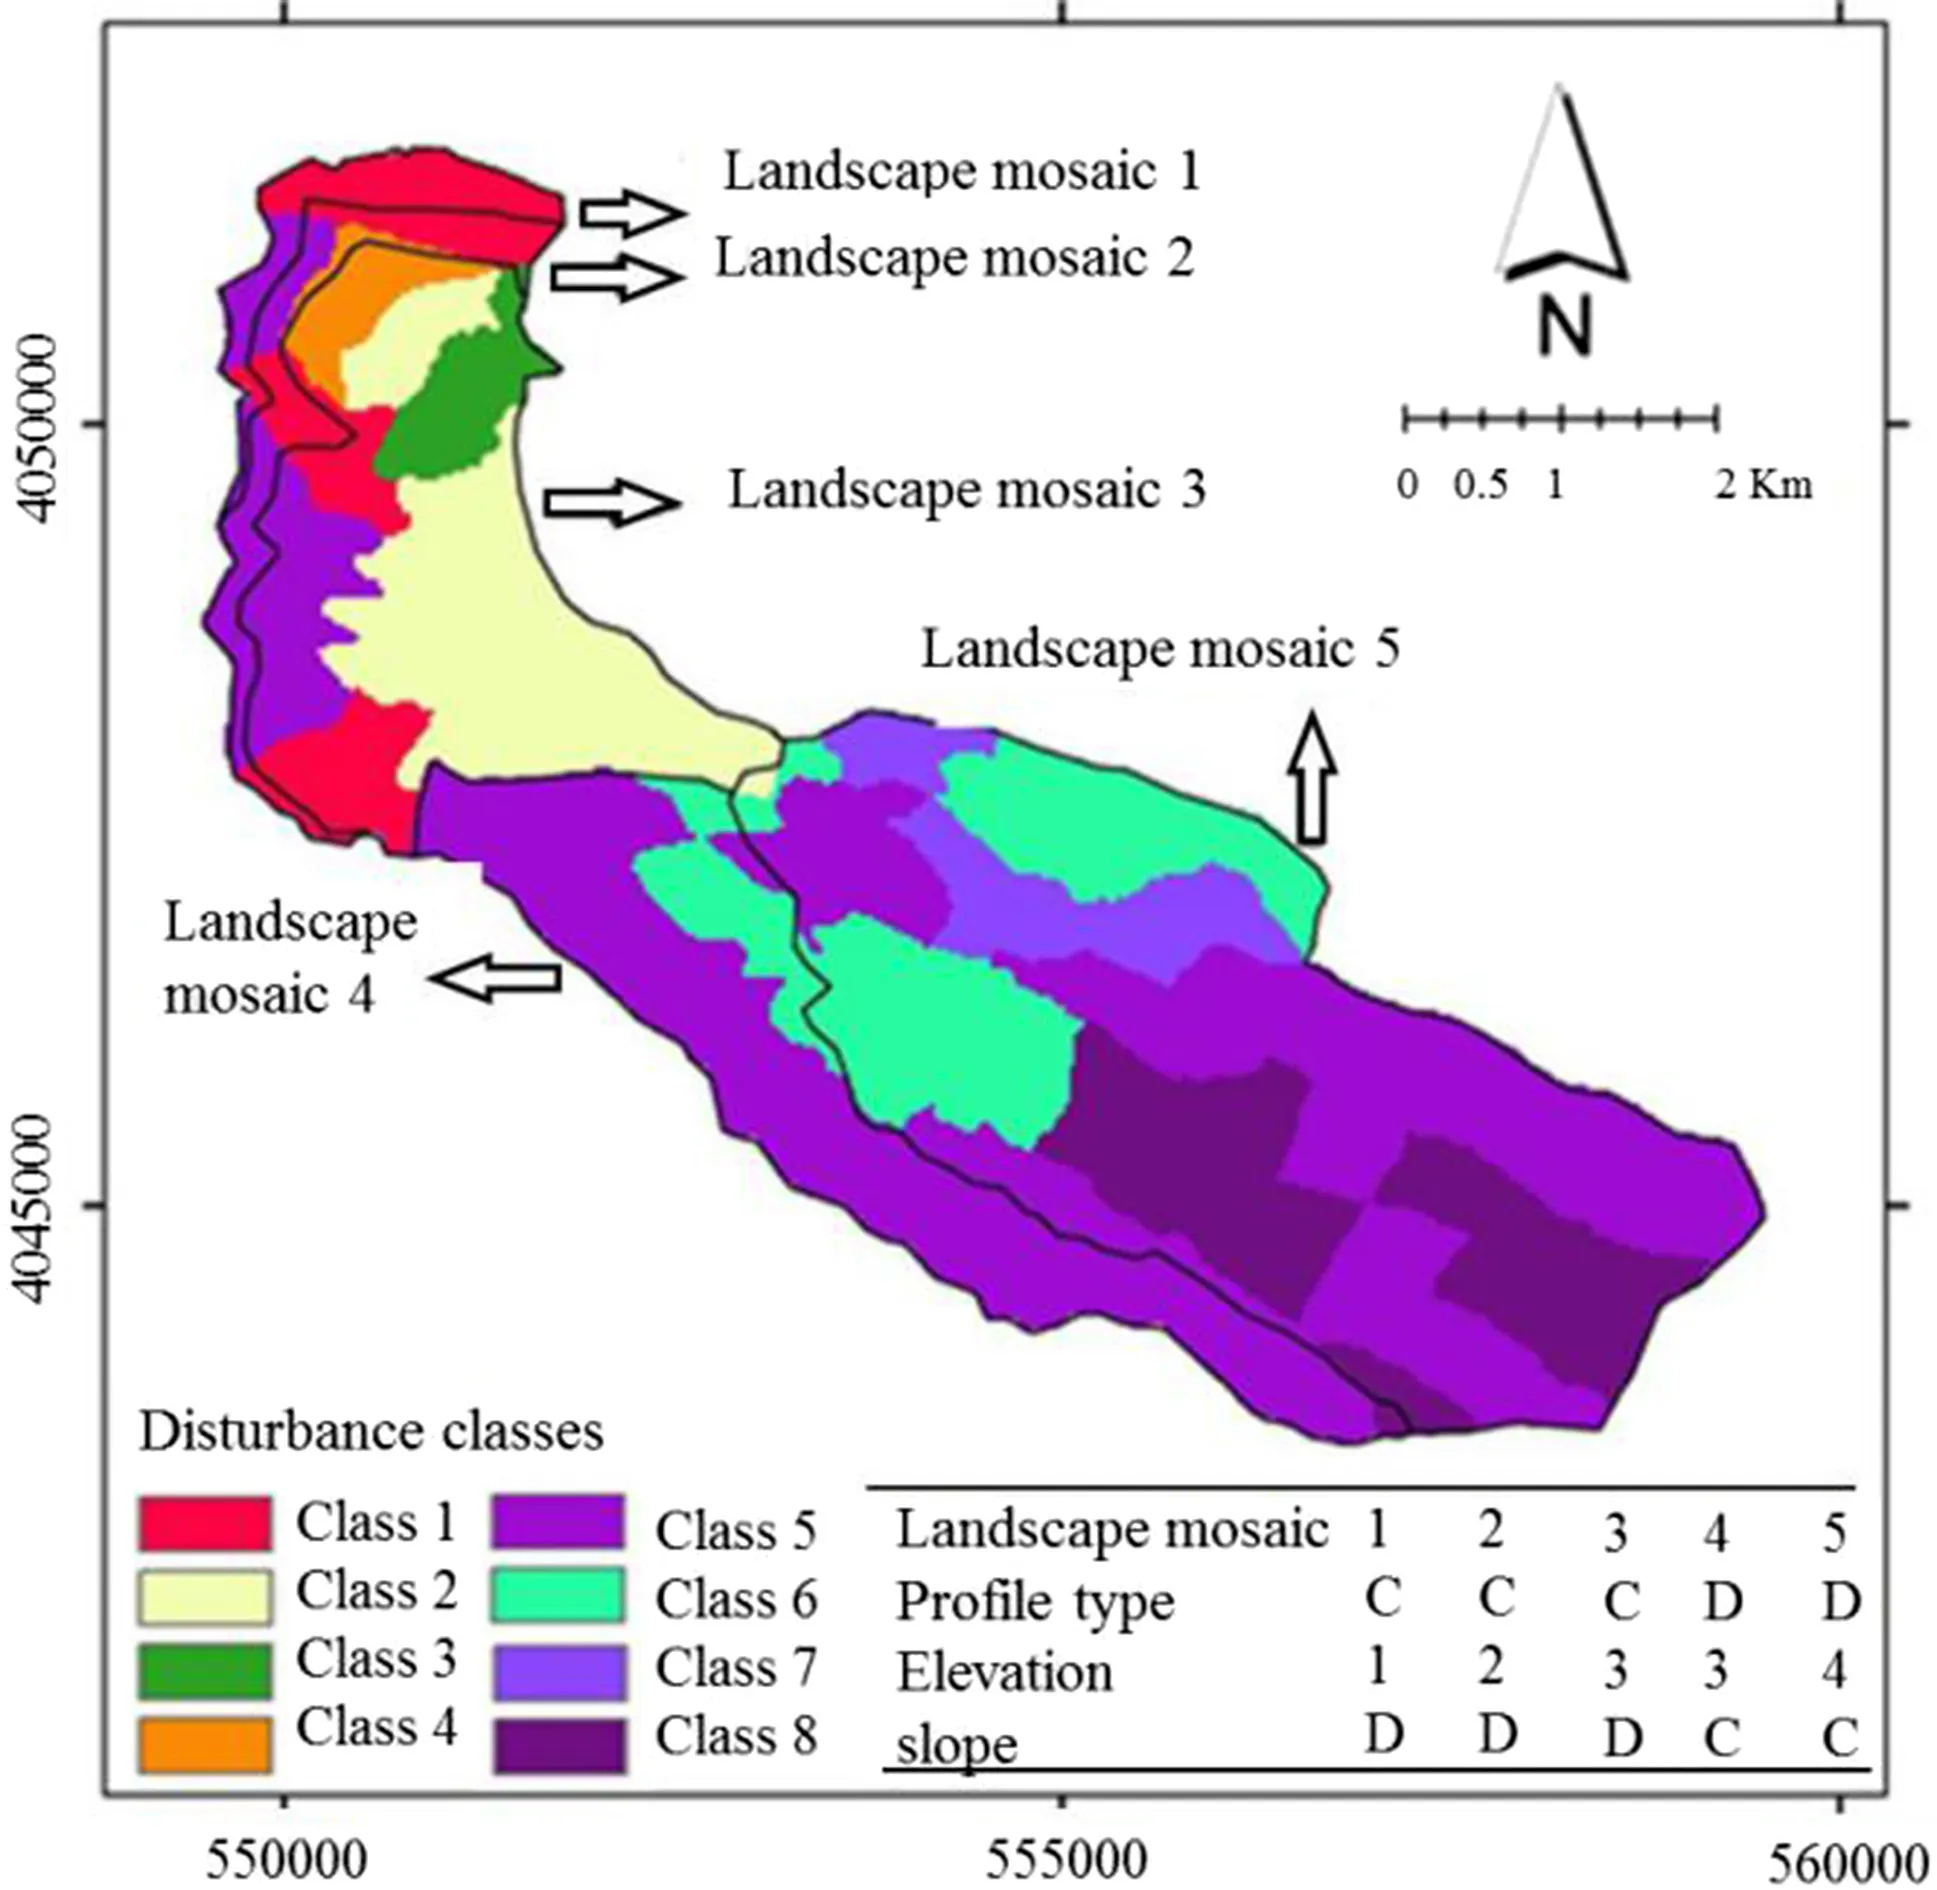
Fig.3 Landscape mosaics and disturbance classes (reference map)
Units smaller than one square kilometer were merged into similar neighboring units and five homogeneous zones (landscape mosaics) were obtained (Fig.3).
Wood exploitation disturbance assessment
Since forest harvesting has the greatest impact on the tree canopy compared to other sources of disturbance, canopy cover may be linked to forest health indices (texture indices). Wood exploitation as a disturbance was considered in eightclasses based on the number of management periods and years of harvest. For this, the exploitation history ofeach parcel of Kheyroud forest was investigated according to the management plans of Patom, Namkhaneh and Ghorazbon districts. Accordingly, a classified parcels or reference map was developed for extracting training samples and accuracy assessment of the classified maps (Fig.3). The parcels map was prepared by the Department of Forestry and Forest Economics of the University of Tehran. The description of the reference map classes is given in Table 3.
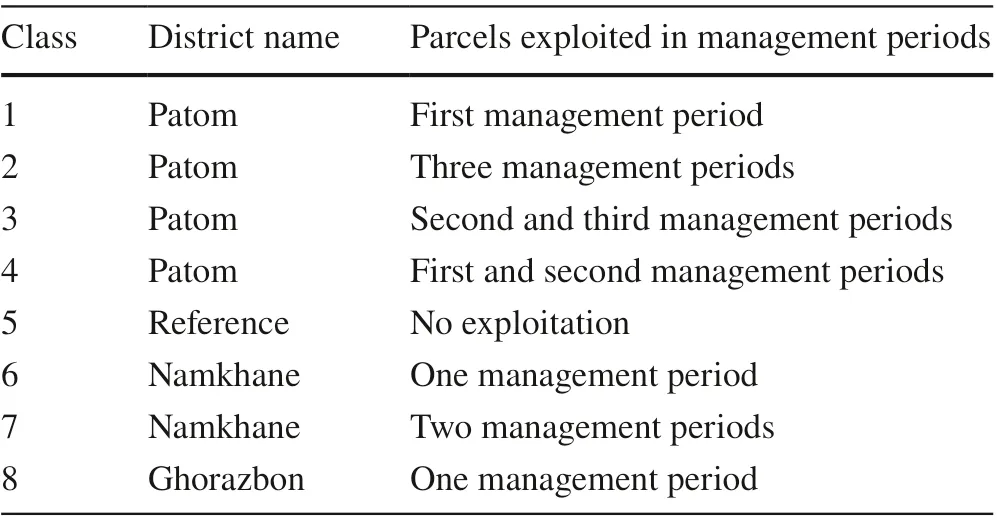
Table 3 Classes and their exploitation
Landsat satellite images for health indices
Landsat satellite images were used to provide health indices, and since they have medium spatial resolution, they are appropriate for regional-scale studies (Smith et al. 2003). The satellite data were acquired from the USGS website for the period May to September, the peak of vegetation cover.
The satellite data spanned the years 1984–2016 and were controlled for cloud and data gap. Since forest harvest data were available at the parcel level, we used variation in pixel values across horizontal and vertical lines (Fig.2). The satellite data was chosen to represent likely differences between harvested and non-harvested parcels on two dates and used for screening health indicators and disturbance classification. These data included Landsat 7 ETM+ sensor images dated 3/06/2001, Landsat 5 TM sensor images dated 21/09/2009 and 30/05/1985 and Landsat 8 OLI sensor images dated 5/08/2015. All of the data refer to path 164 and row 35, and their spatial resolution is 30 m. The first five bands of all the satellite images were used in the analyses.
The Fast Line-of-Sight Atmospheric Analysis of Spectral Hypercubes (FLAASH) atmospheric correction method was used (López-Serrano et al. 2016). Geometric corrections were made using the 1:25,000-scale topographic map as the reference and poynomial geo-referencing and nearest neighbor resampling technique was applied. All satellite images were corrected with a residual error of less than half a pixel. The coordinate system was UTM, the datum was WGS84, and all images were in Zone 39.
Extracting forest health indices from Landsat satellite images
We used image co-occurrence image texture indices for health assessment (Rahimi et al. 2016).
The texture window dimensions were set at the range (3 × 3) to avoid over- smoothening and for the elimination of minor differences. The output of the filter is mean, variance, homogeneity, entropy, second moment, contrast, dissimilarity, and correlation indices (Arekhi and Momeni Taramsari 2015). The mean, homogeneity and second moment indices show similarity in pixel values to neighboring pixels in one window. The contrast value indicates the local variability appearing in the image. Correlation is the ability to predict pixel values in vertical and horizontal ranges as well as linear dependencies, and entropy is the complexity or information amount of an image (Clausi 2002). The listed texture indices were extracted from blue to short-wave infrared bands of the Landsat satellite images.
Time series analyses for screening indices
For time series tests, texture indices were extracted and analyzed for the years 2001 and 2009 along four horizontal and vertical lines with a minimum and a maximum length of 17 and 19 pixels in parcels (Fig.4) with different management histories (Parcels 110 and 104 in the Patom district). Parcel 110 has been exploited in two management periods, the last being in 2006, and Parcel 104 once in 1983 with a small harvest (17.2 m 3 /ha), considered as the control.
For trend analysis, we used Mann–Kendall and nine other tests (Chiew and Siriwardena 2005). A total of 40 health indices (eight for each band) were extracted along four vertical and horizontal lines (Fig.4). In total, for the four lines, 160 by ten types of trend analyses amounted to 1600 indices tests performed.
To screen the indices tests, unchanged areas at a 5% level in the control Parcel 104 were selected over the horizontal and vertical lines before and after the harvest year 2006. From the remaining indices tests, those that changed significantly in the managed parcel (Parcel 110) were selected. The indices were then assessed for normality by Kolmogorov–Smirnov, Shapiro and Wilk tests, and in the case of non-normality, they were removed from the list of indices. Finally, the correlation between the remaining indices tests was analyzed to delete ones with significant correlation ( p < 0.05).
Modeling wood exploitation disturbance classes using an artificial neural network (ANN)
Multi-layer perceptron (MLP) backpropagation ANN in a direct multidate classification (Dal and Khorram 1999) determined classes of wood exploitation intensity. Direct multidate classification is one of the methods for monitoring changes, in which the same training samples are taken from images of different time periods.
All selected indices were standardized in the range 0 to 255 before classification. Training samples were then introduced for the two parcels 110 and 104. In the implementation of the ANN, 70% of the pixels per class was used for training and the remaining for testing the results. Auxiliary indices were also used, including soil moisture classes (Sarmadiyan and Jafari 2001), distance from roads, slope, DEM and aspect. In the neural network application, indices were re-screened and those which did not improve the accuracy of the neural network were excluded. The classification was then applied to the three districts. In order to improve the accuracy of classification results, a separate classification was applied to each of the landscape mosaics. The overall accuracy, Kappa coeffi cient (Olofsson et al. 2014), producer’s and user’s accuracies (Shao et al. 2019) were used for accuracy assessment.
Application of the health distance method
The Health Distance Method (Chen and Li 2010) assessed the health of the landscape mosaics. For this, the weight of each of the indices was determined and applied in the complex index of health distance. To weigh the indices in each of the landscape mosaics, the homogeneity between the indices was examined and the most similar index to other indices received the lowest weight and vice versa. To calculate the distance between indices the Euclidean distance was used (Eq. 1):

To get a complex index of health distance for each of the landscape mosaics, we calculated the mean ofeach index in unexploited (as reference) and exploited areas. The absolute difference between the mean ofeach of the indices in the exploited areas from those in the reference area were then evaluated (distance from health), and finally, integrated indices were developed based on Eq. ( 2):

where CHD is the complex index of health distance in each landscape mosaic, Withe weight of index i, and HD the distance from health.
Results
Screening of the indices
The remaining indices tests in Table 4 were obtained after various screening attempts, including trend analyses on indices extracted from co-occurrence filter on images of the years 2001 and 2009, Kolmogorov–Smirnov and Shapiro and Wilk tests for examination of normality, and correlation assessment to remove significant correlated indices ( p < 0.05).
Application of ANN to classify areas for exploitation disturbance
Implementation of the ANN classification was reiterated more than 100 times and indicated that seven cooccurrence indices were enough for classification. Theseincluded the second moment and correlation of the first band, mean of the second band, homogeneity of the third band, correlation of the fourth band, and correlation and dissimilarity of the fifth band.
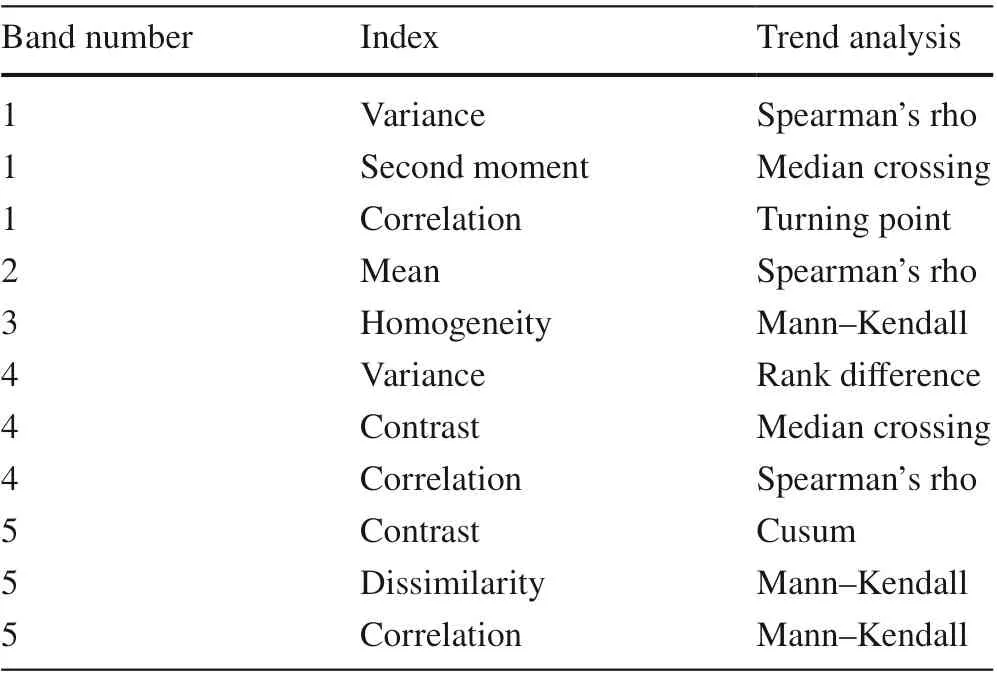
Table 4 Remaining co- occurrence indices after screening
Use of auxiliary data, including slope, DEM, aspect, and distance to road and soil moisture classes, increased classification accuracy. The classification results in the two parcels, with help of seven indices and auxiliary data, are presented in Fig.4. The error value in this map was 0.0653. The overall Kappa and overall accuracy were 0.87 and 93.47, respectively. Kappa coeffi cients were 0.85 and 0.89 for parcels 110 and 104, respectively. Producer’s and User’s accuracy were 91.58 and 94.17 for Parcel 110, and 95.11 and 92.90 for Parcel 104, respectively.
Implementing ANN for the entire landscape mosaics
For each landscape mosaic, ANN classification based on different disturbance classes was performed using the texture indices extracted from the Landsat satellite images. The accuracy of the landscape mosaics classification are shown in Table 5, and Fig.5 shows the classification result. The landscape mosaic five was further classified into two parts (Namkhaneh in the north and Ghorazbon in the south) because of its large area and variety of disturbance classes.
To determine the weight of the indices, the mean of seven selected indices for the 2 years 1985 and 2015 were selected. In areas of the three districts which were correctly classified by comparison with the reference map, 5651 random points were then taken and the mean of the seven indices were extracted. The proximity matrices were calculated using Euclidean distance for indices’ mean in the landscape mosaics separately and the weights of indices were obtained (Table 6).
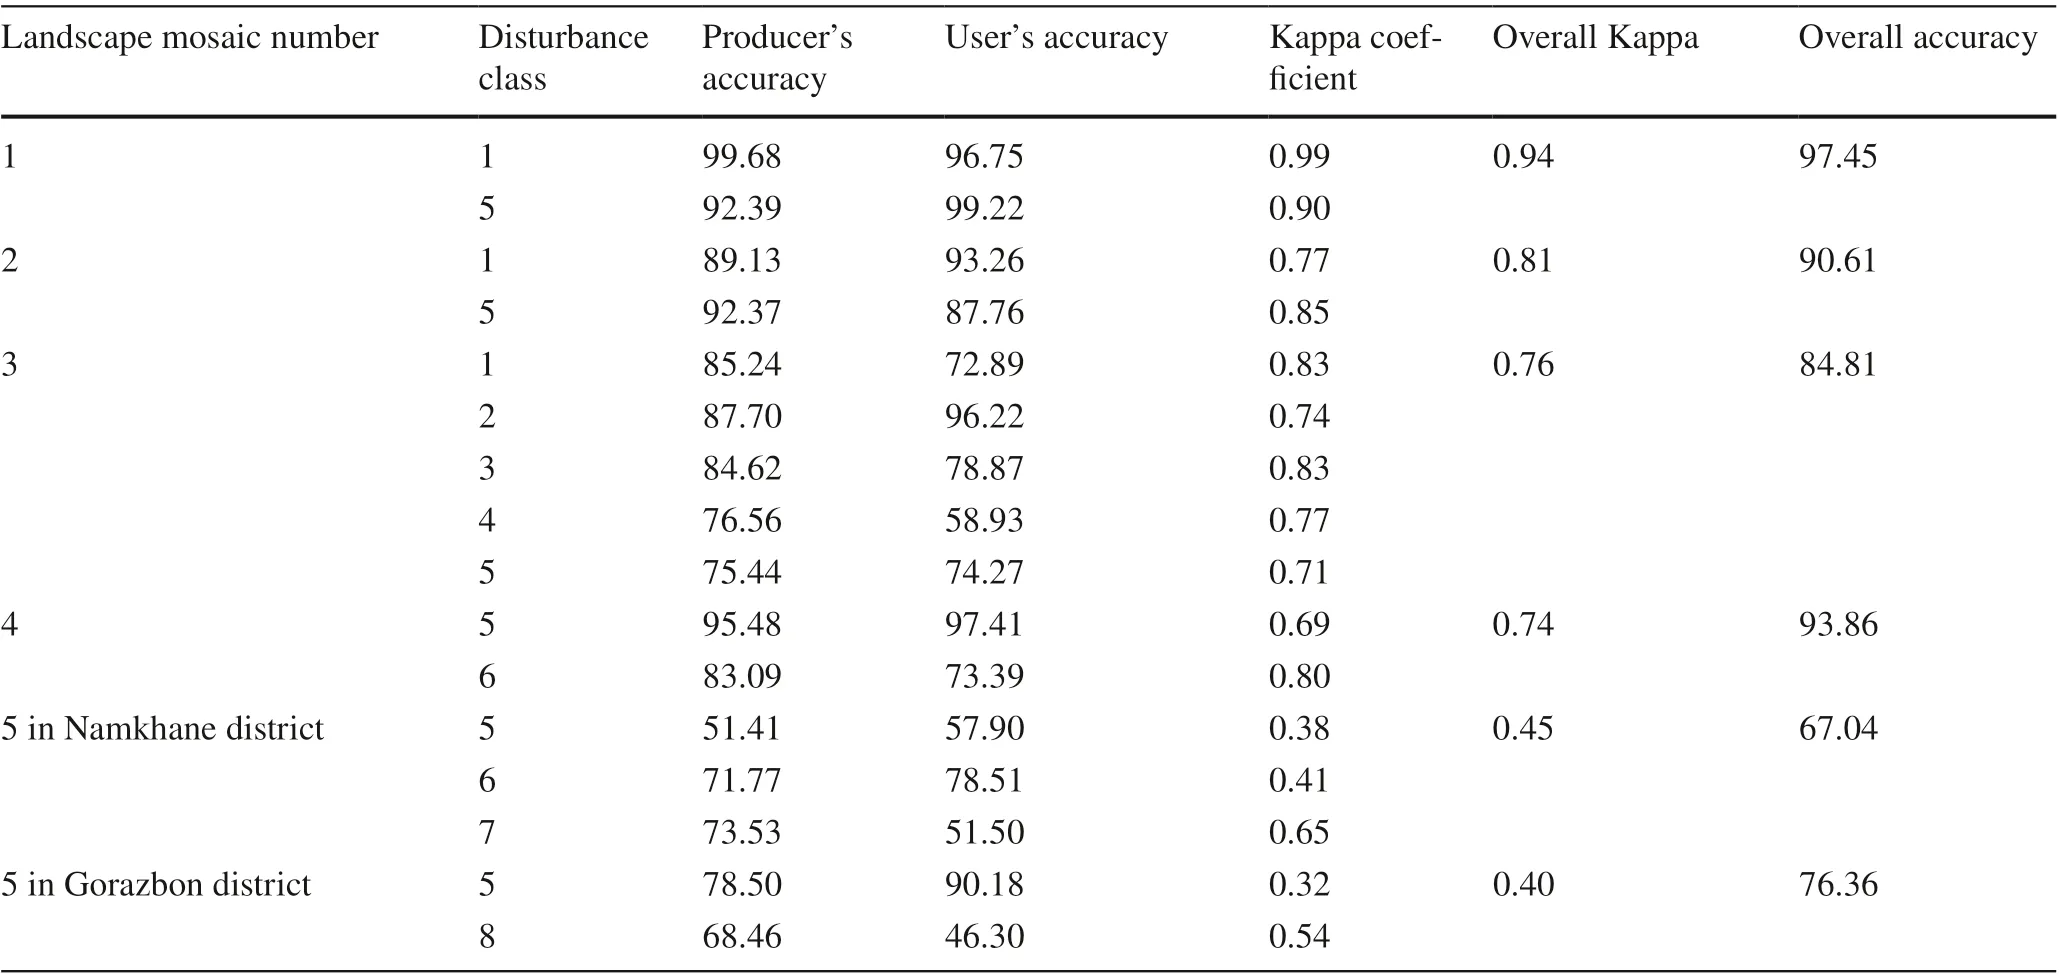
Table 5 Assessment of classification accuracy in landscape mosaics
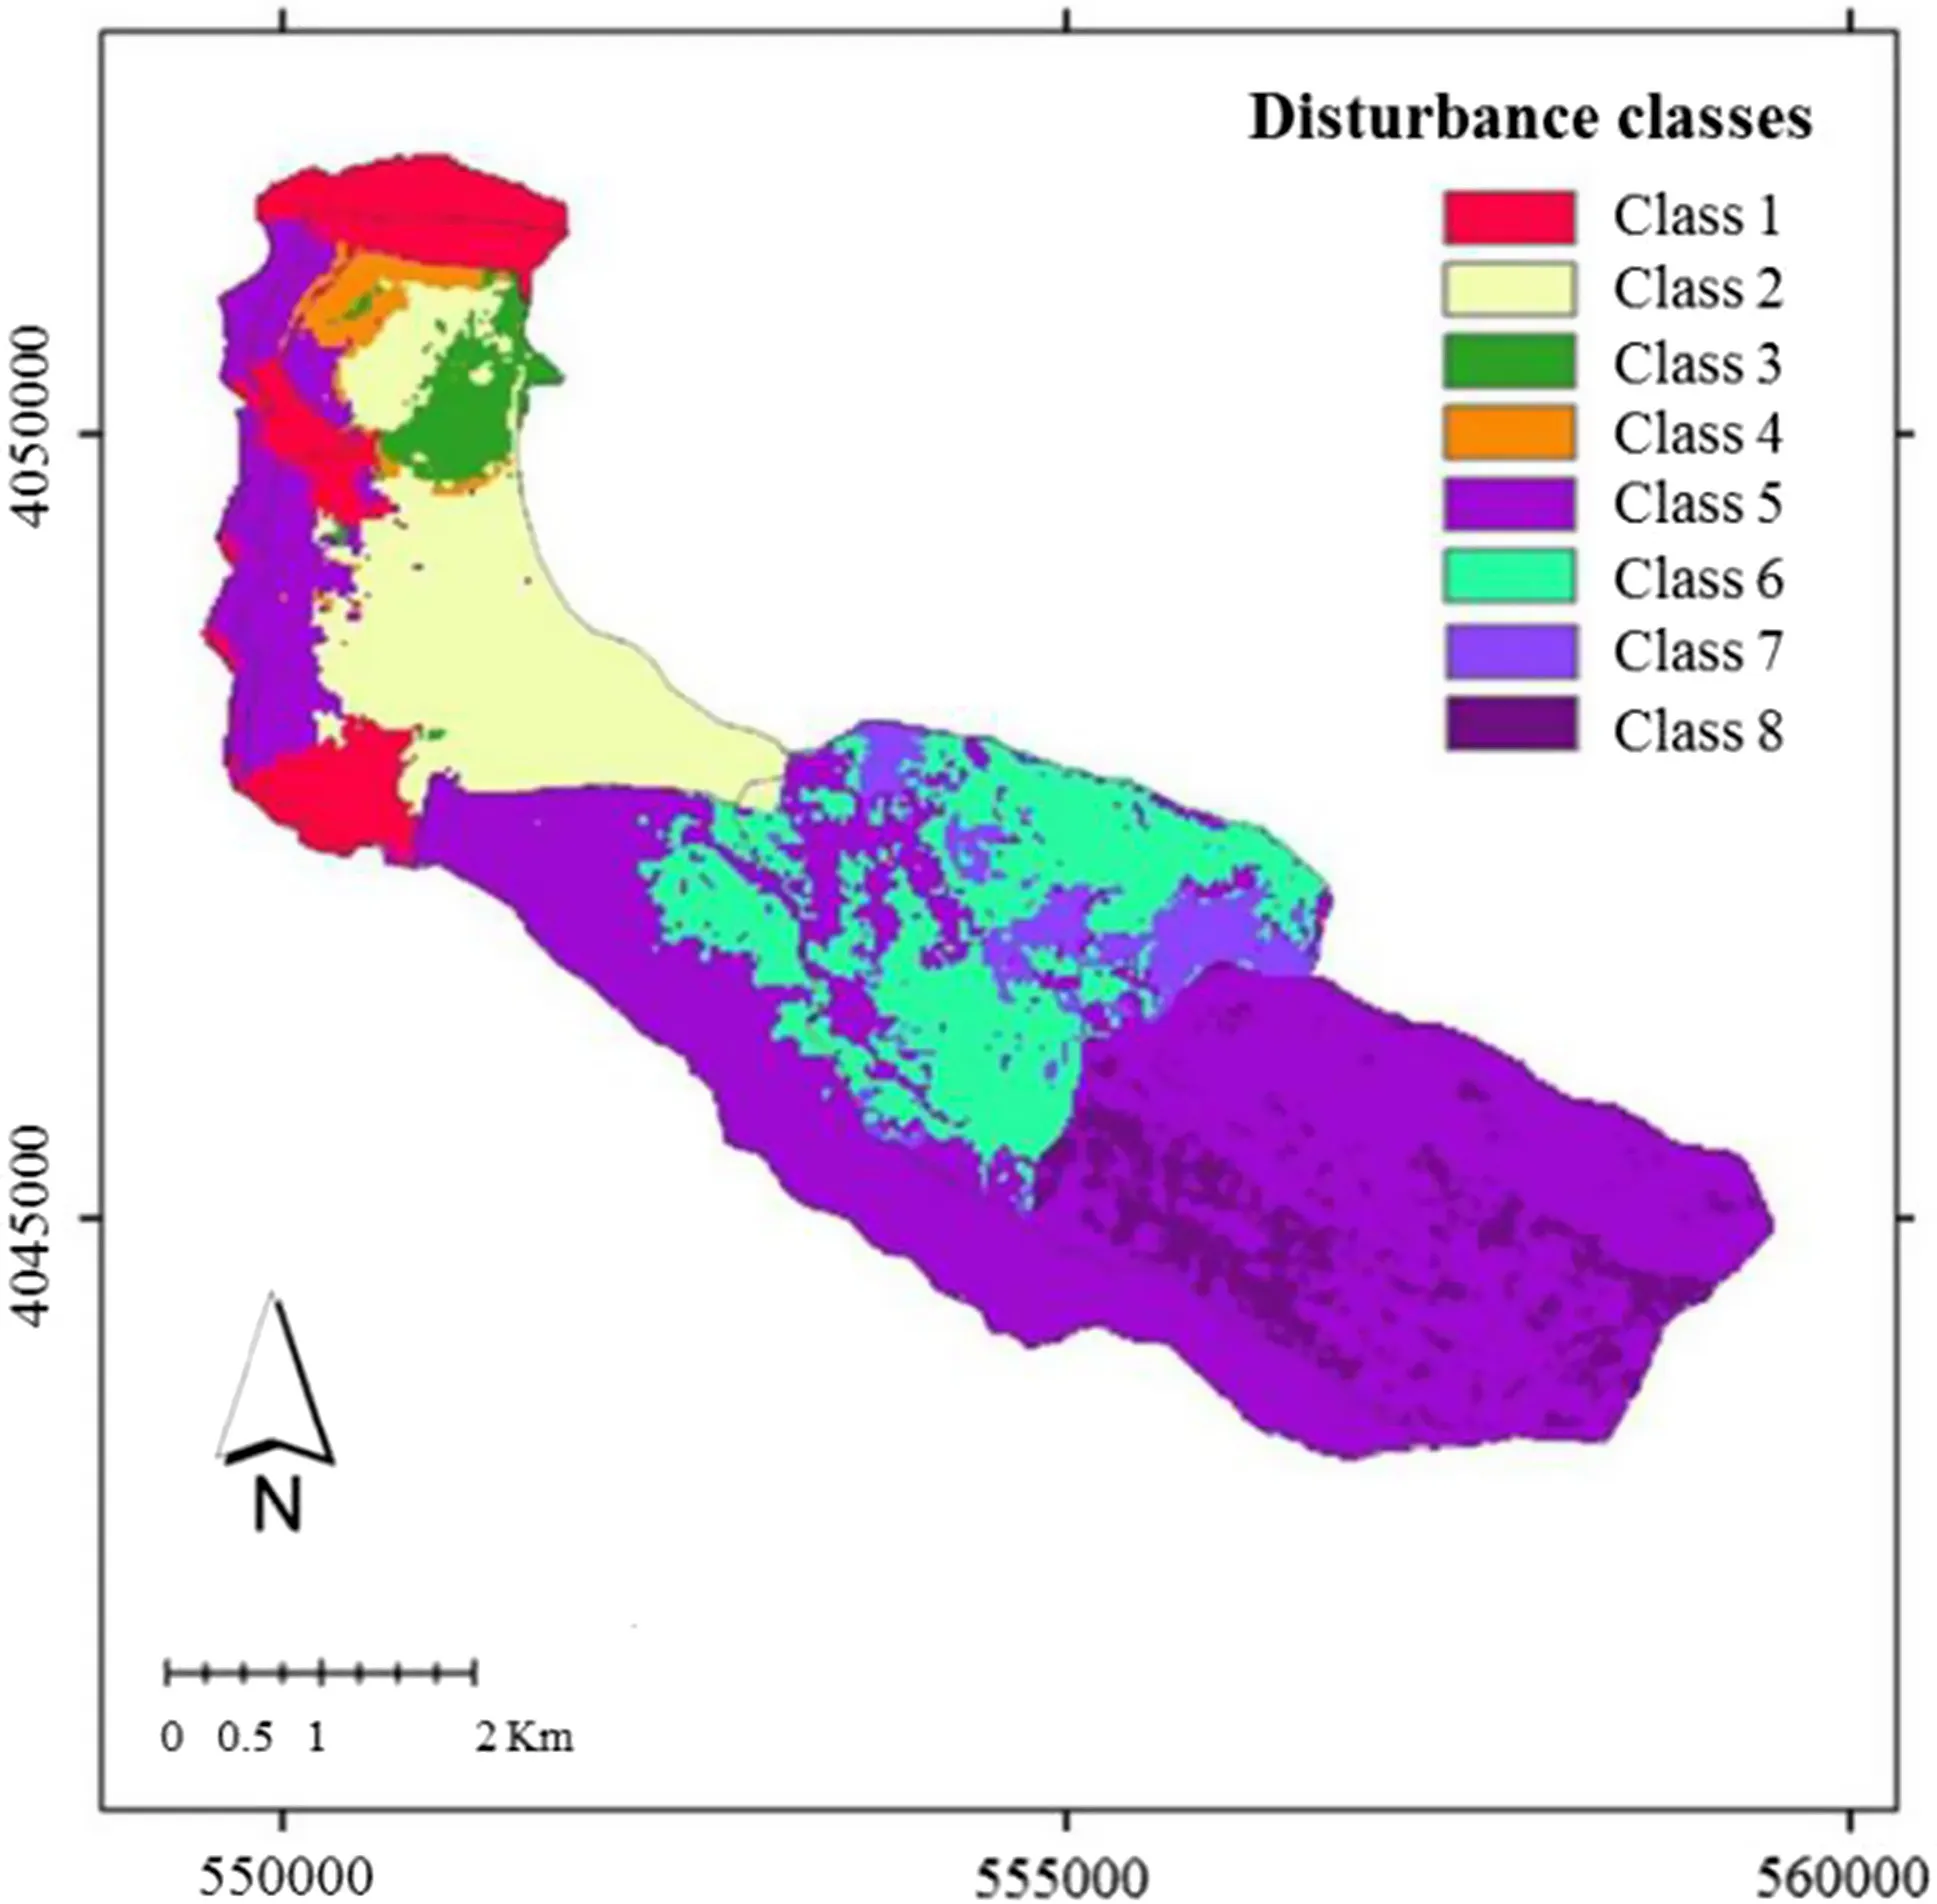
Fig.5 Classified map of different disturbance classes using texture indices in three districts
The complex index of health distance
The value from the combination of the indices in the landscape mosaic with the greatest distances from health was assigned the lowest health grade and vice versa (Table 7).
Discussion
The major disturbance affecting Kheyrud Forest is timber harvesting which reduces mature crown trees. Therefore, this indicator was considered for the classification of forest health through remote sensing techniques.
The usefulness of the selected texture indices as forest health indices was assessed for various forest exploitation disturbance classes. Direct multidate classification method (Dal and Khorram 1999) of satellite data was used. Classification accuracy improved using synthetic bands obtained through math operations on co-occurrence texture (Narasimha Rao et al. 2002; Podest and Saatchi 2002; Butusov 2003; Ravikumar 2008; Tassetti et al. 2010).
The screening of indices retained the most effective ones for image classification through the ANN method (Table 4, Fig.4). Trend analyses further helped to remove unnecessary data.
Health was surveyed at the medium scale (Bailey 2009) over homogenous units or landscape mosaics. The selected co-occurrence texture indices had different weights in different landscape mosaics (Table 6), which show the importance of zoning in forest health surveys and for assessing each homogenous area as a functional unit separately. Previously in the same area the moderating effect ofenvironmental conditions in landscape mosaics on tree species composition disturbance had been confirmed (Erfani et al. 2018).
The ANN modeling approach is considered appropriate as it is resistant to non-normality in the data (Dal and Khorram 1999; Yuan et al. 2009), which was the case for some of the indices in this study. The accuracy ofclassification by the ANN decreased with increasing area of the landscape mosaic (Table 5). As the area grows, so does variability that makes the classification less accurate. For more homogeneous areas, in terms of spatial factors, a separate classification was also attempted for each landscape mosaic. In the largest landscape mosaic, the classification accuracy was the lowest. In addition to the vastness of the area, other factors contributed to the reduced accuracy, including varying disturbance levels, exploitation intensity and history, and removal of dry, broken and diseased trees.

Table 6 Weight of the forest health indices
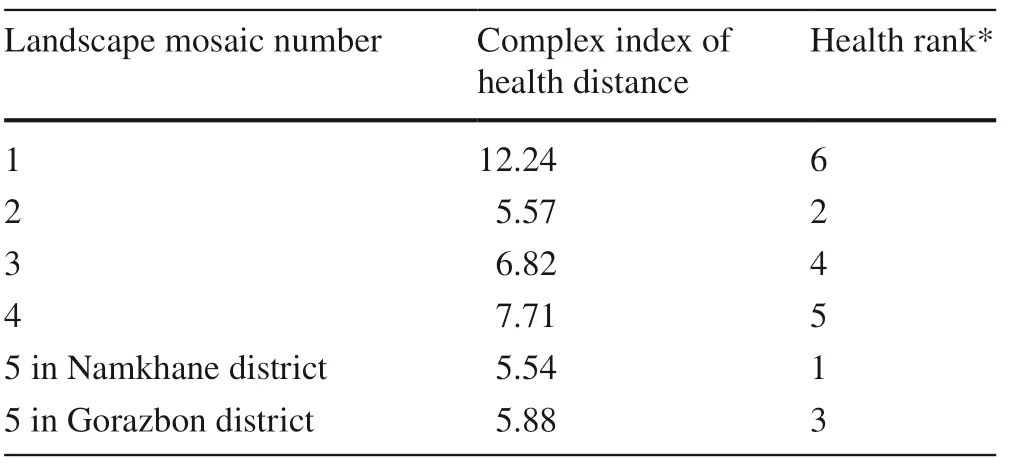
Table 7 Ranking of the landscape mosaics based on the complex index of health distance
The trained ANN using forest exploitation statistics identified different classes ofexploitation. The health rating of the landscape mosaics showed that areas with more management periods and longer harvest histories are least healthy (Table 7). Landscape mosaics two and five are the healthiest and have shorter histories ofexploitation intensity or have been harvested at least 33 years ago. The least healthiest was landscape mosaic one which had the highest level of access and the greatest disturbance, followed by landscape mosaic four with two management periods, and landscape mosaic three with three management periods. Landscape mosaics three and four were moderately health (Table 7).
The results of the utilitarian-centered and ecosystem-centered approaches showed a notable reduction in health status. The debate over forest rest is topical in Iran, especially for utilitarian-centered, unhealthy commercial forests and the results of this study may contribute to the discussion.
An ecosystem-centered forest health assessment approach, the timespan of succession and the capacity for forest recovery in terms of structural patterns and composition should be considered. This is in agreement with Kolb et al. ( 1994) and Lausch et al. ( 2016). However, the reduction of parcel productivity after previous harvests (Erfani et al. 2017a) has been so high that even resting of some parcels showed no improvement in forest health. These may illustrate exploitation over and above the capability of the forest ecosystem to recover, hence the low health index. For example, landscape mosaic one, the least healthy and landscape mosaic two, the healthiest, had been harvested in the first management period in Patom, but with different volumes harvested (1389 and 300 m 3 /ha, respectively, between 1972 and 1983). This illustrates the effect of harvesting on forest recovery and health (Tables 3, 7). Field surveys in different landscapes demonstrated that, with increase in timber harvesting, more early successional species such as Diospyros lotus L. appear and tree volume/ha decreases. Changes in forest stand structure along an exploitation disturbance gradient are reflected in texture indices obtained from remote sensing methods performed in this study. Erfani et al. ( 2018) showed that harvesting (may be addressed by two indicators, disturbance, including the number of management periods and the time from the last exploitation) changed species composition to early successional ones. Erfani et al. ( 2017a) reported a decreasing trend in tree number and volume per hectare in some of the harvested parcels in Kheyrud Forest, which confirms our results.
This study estimates the distance from health based on differences in textural indices between stands with different disturbance regimes. This method focused on structural attributes of the forest using reflectance identified by Landsat imagery. It was not the intention to determine the unhealthy threshold, but the results may be used as a sign of unhealthy forest conditions. In order to determine the threshold for unhealthy conditions and to define forest health using other indices, further field studies are recommended. The method in this study may be used for the rapid assessment of forest health in similar forests in the north of Iran.
References
Angelo NP, Haertel V (2003) On the application of Gabor filtering in supervised image classification. Int J Remote Sens 24(10):2167–2189
Arekhi S, Momeni Taramsari M (2015) A virtual learning to ENVI classic 5.0. Golestan University Press, Gorgan
Bailey RG (2009) Ecosystem geography. Springer, New York, p 256
Bruzzone L, Fernandez Prieto D (2000) An adaptive parcel-based technique for unsupervised change detection. Int J Remote Sens 21(4):817–822
Butusov OB (2003) Textural classification of forest types from Landsat 7 imagery. Mapp Sci Remote Sens 40(2):91–104
Chen XW, Li BL (2010) Quantitative classification of plant functional types based on photosynthesis. J Sustain For 29(1):1–14
Chen CF, Chen KS, Chang JS (1995) Neural network for change detection of remotely sensed imagery. In: Proceedings of SPIE, image and signal processing for remote sensing II, Paris, pp 210–215
Chiew F, Siriwardena L (2005) Trend, change detection software. CRC for Catchment Hydrology. eWater, Canberra
Clausi DA (2002) An analysis of co-occurrence texture statistics as a function of grey level quantization. Can J Remote Sens 28(1):45–62
Clifton C (2003) Change detection in overhead imagery using neural networks. Appl Intell 18(2):215–234
Costanza R, Norton BG, Haskell BD (1992) Ecosystem health new goals for environmental management. Island Press, Washington
Cracknell MJ, Reading AM (2014) Geological mapping using remote sensing data: a comparison of five machine learning algorithms, their response to variations in the spatial distribution of training data and the use ofexplicit spatial information. Comput Geosci 63:22–33
Czerwinski CJ, King DJ, Mitchell SW (2014) Mapping forest growth and decline in a temperate mixed forest using temporal trend analysis of Landsat imagery. Remote Sens Environ 141:188–200
Dal X, Khorram S (1999) Remotely sensed change detection based on artificial neural networks. Photogramm Eng Remote Sens 65(10):1187–1194
Erfani M, Danehkar A, Salmanmahin A, Etemad V (2017a) Marked trees as indices of forest sustainability-case study: Kheyrud Hyrcanian forest. ABR 8(1):188–197
Erfani M, Salmanmahiny A, Danehkar A, Etemad V (2017b) Modeling of forest soil and litter health using disturbance and landscape heterogeneity indicators in northern Iran. J Mt Sci 14(9):1801–1813
Erfani M, Danehkar A, Salmanmahiny A, Etemad V (2018) Evaluation of disturbance and spatial attribute effects on regeneration using structural equation modeling (case study: Khyrud forest-Nowshahr). Iran J For Poplar Res 25(4):563–573
Franklin SE, Maudie AJ, Lavigne MB (2001) Using spatial cooccurrence texture to increase forest structure and species composition classification accuracy. Photogramm Eng Remote Sens 64(7):849–855
Forestry and Forest Economics Department of Tehran University (2009) Forest management project of Gorazbon section. University of Tehran, Tehran
Grime JP (1977) Evidence for the existence of three primary strategies in plants and its relevance to ecological and evolutionary theory. Am Nat 111(982):1169–1194
Hammond EH (1954) Small-scale continental landform maps. Ann Assoc Am Geogr 44(1):33–42
Hammond EH (1964) Analysis of properties in land form geography: an application to broad-scale land form mapping. Ann Assoc Am Geogr 54(1):11–19
Hirschmug M, Steinegger M, Gallaun H, Schardt M (2014) Mapping forest degradation due to selective logging by means of time series analysis: case studies in central Africa. Remote Sens 6(1):756–775
Kolb TE, Wagner MR, Covington WW (1994) Utilitarian and ecosystem perspectives: concepts of forest health. J For 92(7):10–15
Kremen C, Ostfeld RS (2005) A call to ecologists: measuring, analyzing, and managing ecosystem services. Front Ecol Environ 3(10):540–548
Lausch A, Erasmi S, King DJ, Magdon P, Heurich M (2016) Understanding forest health with remote sensing—part I-a review of spectral traits, processes and remote-sensing characteristics. Remote Sens 8(12):1029. https://doi.org/10.3390/rs812 1029
López-Serrano PM, José JC, Ramón AD (2016) Evaluation of radiometric and atmospheric correction algorithms for aboveground forest biomass estimation using Landsat 5 TM data. Remote Sens 369(8):1–15. https://doi.org/10.3390/rs805 0369
Marvie Mohadjer MR (2012) Silviculture. University of Tehran Press, Tehran, p 418
Narasimha Rao PV, Sesha Sai MR, Sreenivas K, Krishna Rao MV, Rao BRM, Dwivedi RS, Venkataratnam L (2002) Textural analysis of IRS-1D panchromatic data for land cover classification. Int J Remote Sens 23(17):3327–3345
Olofsson P, Foody GM, Herold M, Stehman SV, Woodcock CE, Wulder MA (2014) Good practices for estimating area and assessing accuracy of land change. Remote Sens Environ 148(25):42–57
Panta M, Kim K, Joshi C (2008) Temporal mapping of deforestation and forest degradation in Nepal: applications to forest conservation. For Ecol Manag 256(9):1587–1595
Podest E, Saatchi S (2002) Application of multiscale texture in classifying JERS-1radar data over tropical vegetation. Int J Remote Sens 23(7):1487–1506
Rahimi E, Salmanmahiny A, Soltanian S (2016) A comparison of continuous and discrete indices in measuring Gorgan forest landscape fragmentation. J RS GIS Nat Resour 7(3):30–45
Ravikumar R (2008) Multi-scale texture analysis of remote sensing images using Gabor filter banks and wavelet transforms. M.Sc. thesis, Department of Geography, Texas A&M University, Texas, United States
Sarmadiyan F, Jafari M (2001) The survey of soil of the Kheyrud Forest Research Station University of Tehran, Karaj, Iran. Iran J Nat Resour 291:33–890
Shao GF, Tang LN, Liao JF (2019) Overselling overall map accuracy misinforms about research reliability. Landsc Ecol 34:2487–2492
Smith JH, Stehman SV, Wickham JD, Yang L (2003) Effects of landscape characteristics on land-cover class accuracy. Remote Sens Environ 84(3):342–349
Su Mon M, Mizoue N, Zaw Htun N, Kajisa T, Yoshida S (2012) Factors affecting deforestation and forest degradation in selectively logged production forest: a case study in Myanmar. For Ecol Manag 267:190–198
Tassetti AN, Malinverni ES, Hahn M (2010) Texture analysis to improve supervised classification in IKONOS Imagery. In: Proceedings of the “ISPRS TC VII symposium-100 years ISPRS”, 5–7 July 2010. IAPRS, vol XXXVIII, part 7A, Vienna, pp 245–250. https ://pdfs.seman ticsc holar .org/842f/56664 bafb2 c38b1 63998 8e526 1b918 0f7e5 0.pdf. Accessed 18 Oct 2019
Yuan H, Van Der Wiele CF, Khorram S (2009) An automated artificial neural network system for land use/land cover classification from Landsat TM imagery. Remote Sens 1(3):243–265
 Journal of Forestry Research2021年2期
- Journal of Forestry Research的其它文章
- Stem taper functions for Betula platyphylla in the Daxing’an Mountains, northeast China
- Leaf phenotypic variation of endangered plant Tetracentron sinense Oliv. and influence of geographical and climatic factors
- Ecological variations of woody species along an altitudinal gradient in the Qinling Mountains of Central China: area-based versus mass-based expression of leaf traits
- Variations in stem radii of Larix principis-rupprechtii to environmental factors at two slope locations in the Liupan Mountains, northwest China
- A review of ecological mechanisms for management practices of protective forests
- Variation of basic density, calorific value and volumetric shrinkage within tree height and tree age of Ugandan grown Eucalyptus grandis wood
