Trends in tropospheric ozone concentrations and forest impact metrics in Europe over the time period 2000–2014
Chiara Proietti · Maria Francesca Fornasier · Pierre Sicard · Alessandro Anav · Elena Paoletti · Alessandra De Marco
Abstract In Europe, tropospheric ozone pollution appears as a major air quality issue, and ozone concentrations remain potentially harmful to vegetation. In this study we compared the trends of two ozone metrics widely used for forests protection in Europe, the AOT40 (Accumulated Ozone over Threshold of 40 ppb) which only depends on surface air ozone concentrations, and the Phytotoxic Ozone Dose which is the accumulated ozone uptake through stomata over the growing season, and above a threshold Y of uptake (PODY). By using a chemistry transport model, we found that European-averaged ground-level ozone concentrations (? 2%) and AOT40 metric (? 26.5%) significantly declined from 2000 to 2014, due to successful control strategies to reduce the emission ofozone precursors in Europe since the early 1990s. In contrast, the stomatal ozone uptake by forests increased from 17.5 to 26.6 mmol O 3 m ?2 despite the reduction in ozone concentrations, leading to an increase of potential ozone damage on plants in Europe. In a climate change context, a biologically-sound stomatal flux-based standard (PODY) as new European legislative standard is needed.
Keywords Tropospheric ozone · AOT40 · POD · Trendm · Mann–Kendall test
Introduction
Tropospheric ozone (O3) is a secondary short-lived climate pollutant (Shindell et al. 2012), formed by the photochemical oxidation of NOxin the presence of carbon monoxide (CO), methane (CH4) and volatile organic compounds (VOCs) (Chameides et al. 1988). It is also the third most important greenhouse gas in terms of radiative forcing (Mickley et al. 2001). Despite the implementation of legislative standards to control the emission of O3precursors worldwide (Cooper et al. 2014; Monks et al. 2015; Simon et al. 2015; Sicard et al. 2016a), O3concentrations remain potentially harmful to vegetation over some regions around the world (Sicard et al. 2016a, 2017; Cailleret et al. 2018; Mills et al. 2018). In Europe, surface O3pollution appears as a major air quality issue (Sicard et al. 2013, 2018, 2020a, b; EEA 2018), particularly in Southern Europe where road traffi c and industrial emissions, combined with higher solar radiation, enhance O3formation (Millán et al. 2000), and causes threat to vegetation (e.g. Sanz et al. 2000; Paoletti 2006; Wittig et al. 2009; Anav et al. 2011; Mills et al. 2011; Sicard et al. 2016b). Currently, the European standard used to protect vegetation against negative impacts of O3is the Accumulated Ozone over a Threshold of 40 ppb (AOT40), i.e. the cumulative exposure to hourly O3concentrations above 40 ppb over the daylight hours of the growing season (Directive 2008/50/EC). In Europe, a target value of 9,000 ppb h, averaged over 5 years, is recommended by the Directive 2008/50/CE for the vegetation protection whilst a critical level of 5,000 ppb h is recommended by UNECE ( 2017) for forest protection. Although AOT40 metric is widely used, the O3uptake through stomata is a better metric to assess plant damage because it estimates the quantity of O3entering in the leaf tissues (Musselman et al. 2006; De Marco et al. 2015; Sicard et al. 2016c). The Phytotoxic Ozone Dose above a threshold Y of uptake (PODY) is the accumulated stomatal O3flux over the growing season and can be modelled using the Deposition of Ozone and Stomatal Exchange (DO3SE) model (UNECE 2017). The threshold Y represents a detoxification threshold below which any O3molecule absorbed by the plant is detoxified (CLRTAP 2017). High ambient O3levels may not damage plants when stomata are closed (Ronan et al. 2020). Conversely, high PODY and resulting damages can occur at low O3levels when stomata are open under favourable environmental conditions such as optimal air temperature and soil moisture (Ronan et al. 2020). For these reasons, the stomatal flux-based approach is recommended as more realistic compared to the exposure-based approach (Paoletti and Manning 2007; Sicard et al. 2016c; Agathokleous et al. 2018).
The evaluation of temporal trends in air pollutant levels in European Union (EU) countries is an essential tool to assess the improvement of air quality due to emissions control strategies (Guerreiro et al. 2014). To date, many studies have investigated O3trends for a small number of monitoring stations, in particular at rural sites representative of background O3conditions (De Leeuw 2000). In 2016, a report was published by the co-operative programme for monitoring and evaluation of the long-range transport of air pollutants in Europe (EMEP) focusing on background sites showing the evolution of ground-level O3over the time period 1990–2012 (Colette et al. 2017). The report highlighted a relatively flat trend for annual O3mean concentrations at EMEP background stations whilst a reduction of 37% for AOT40 was found between 2002 and 2012. Sicard et al. ( 2016a) found a decline (? 27%) for O3vegetation impact metrics at 332 background stations in France between 1999 and 2012. Similarly, Araminien? et al. ( 2019) found a decreasing trend over the time period 2001–2014 for O3annual mean (? 1.3%) and AOT40 (? 16%) in Lithuania whereas they found an increase for POD0 (+ 2.9%). Anav et al. ( 2019) found a decreasing trend of AOT40 (? 22%) and O3concentrations (? 1.6%) and a slight increase of POD0 (+ 5.9%) in Europe over the time period 2000 ? 2014. In this study, we performed a spatio-temporal analysis of short-term annual trends in O3exposure-based and flux-based metrics for the protection of forests for all European countries over the time period 2000–2014.
Materials and methods
Environmental data: the WRF-CHIMERE modelling system
Hourly air temperature data and O3concentrations were obtained, respectively, from the Weather Research and Forecasting (WRF), a mesoscale meteorological model (Skamarock and Klemp 2008) and CHIMERE, an Eulerian offl ine chemistry-transport model developed to analyse the gas-phase chemistry, aerosol formation, transport and deposition at regional scale. Data were provided at 1-h temporal resolution and 12 km × 12 km of spatial resolution over the time period 2000–2014. The O3concentrations at 20–25 m of height from the ground (top of the canopy) provided by the CHIMERE model were used to calculate AOT40 and PODY. Further information about the validation of data obtained by the WRF-CHIMERE modelling system can be found in Menut et al. ( 2013), Martin et al. ( 2014) and Anav et al. ( 2016).
Calculation of O 3 metrics
AOT40 calculation
The O3exposure index AOT40 (in ppb hours, abbreviated to ppb h) was calculated as sum of the hourly exceedances above 40 ppb, for daylight hours (8 am–8 pm) during the growing season, i.e. 1st April-30th September for the protection of forest trees (UNECE 2010), according to the methodology for O3risk assessment in Europe.

where [O3] is hourly O3concentration (ppb), n denotes the number of hours to be included in the calculation period and dt is time step (1-h). The function “maximum” ensures that only values exceeding 40 ppb are taken into account. In Europe, the critical values for the protection of forests is 5000 ppb h as recommended by UNECE ( 2010).
However, Klingberg et al. ( 2014) showed that AOT40 does not consider the influence of climate change on the growing season duration. By consequence, we used in this study the AOT40 formula proposed by Anav et al. ( 2016) that is more plausible from a physiological point of view as the revised AOT40 was calculated from 1st January to 31st December for hours with stomatal conductance ( gsto) higher than 0:where [O3] is the hourly O3concentration (ppb), dt is the time step (1-h) and gstois the stomatal conductance computed according to Eq. ( 3). However, AOT40 does not provide any information on the O3uptake by leaves (Anav et al. 2016).

Phytotoxic ozone dose calculation
The PODY was calculated using the DO3SE model, based on the multiplicative Jarvis’ algorithm (Jarvis 1976) for estimation of gsto(mmol O3m?2s?1). The gstois calculated as a species-specific function where the maximum value of stomatal conductance ( gmax) is reduced by limiting functions, scaled from 0 to 1 as described in Eq. 3.

where gmaxis the maximum stomatal conductance of a plant species to O3(mmol O3m?2s?1per leaf area). The functions fphen, flight, ftemp, fVPDand fSWCstand for the gmaxvariation with leaf age, photosynthetically flux density at the leaf surface (PPFD, μmol photons m?2s?1), surface air temperature, (T, °C), vapor pressure deficit (VPD, kPa) estimated through the surface air humidity, and volumetric soil water content (SWC, m3m?3), respectively. The function fminis the minimum gstoexpressed as a fraction of gmax. We assumed that fphenwas 1 throughout the growing season. The following formulas were applied:
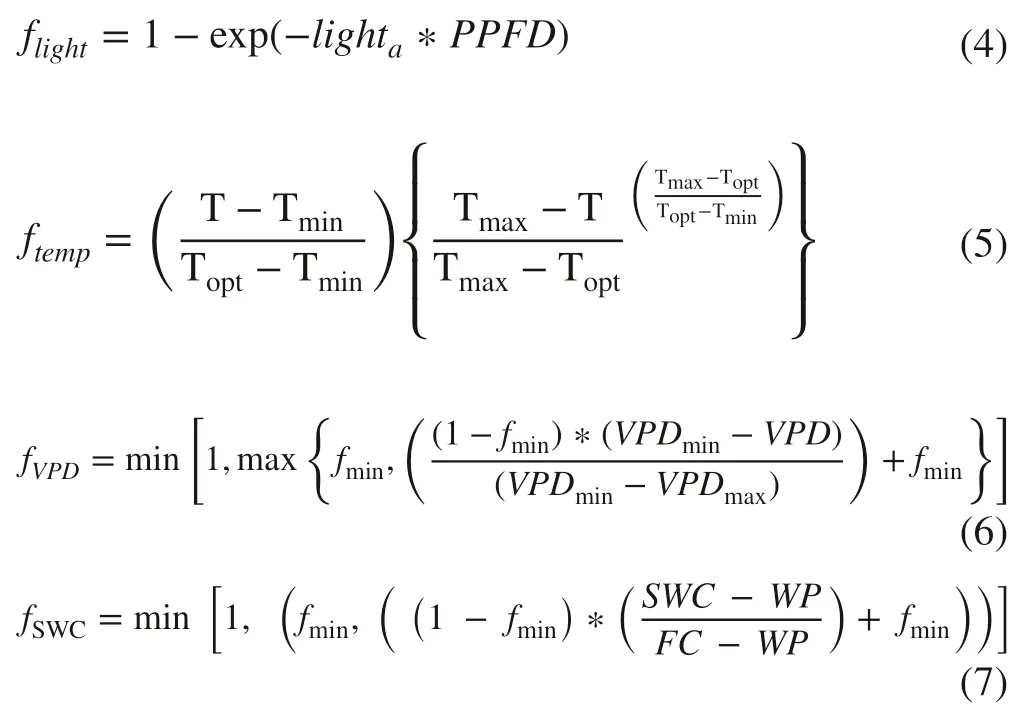
where lightais an adimensional constant; PPFD is hourly photosynthetic photon flux density estimated through the solar radiation; Topt, Tmin, and Tmax, represent the optimum, minimum, and maximum temperature for stomatal conductance, respectively; VPDminand VPDmaxare minimum and maximum vapor pressure deficit for stomatal conductance, respectively; WP is SWC at wilting point and FC is SWC at field capacity. These two parameters are constant and depend on the soil type obtained from a module included into the WRF-CHIMERE model.
The dominant vegetation data, required to estimate gsto, were retrieved from the spatial tree distribution, based on the European Forest Institute database (Brus et al. 2011). Species-specific values of DO3SE parameters were derived from UNECE ( 2017) for each dominant plant species.
Once the stomatal conductance was computed, the stomatal O3flux was calculated over the growing season and expressed as PODY (nmol O3m?2s?1per leaf area). PODY (mmol m?2) was calculated from hourly data as:

where PODY is the accumulated stomatal O3flux above a threshold Y over the growing, gstorepresents the hourly stomatal conductance values, [O3] is the hourly O3concentrations (ppb) and dt is the time step (1-h). PODY was calculated with Y = 0 nmol O3m?2s?1per leaf area, by considering that any O3molecule is harmful for plants (Musselman et al. 2006), and Y = 1 nmol O3m?2s?1per leaf area, as recommended by CLRTAP ( 2017).
Estimation of annual trends
A 10-year time-series of O3data is considered long enough to assess short-term changes as reported in Sicard et al. ( 2016a). The non-parametric tests are robust and suitable for non-normally distributed data with missing and extreme values (Sicard et al. 2009). The non-parametric Mann–Kendall test was used to assess whether there is a monotonic upward or downward trend of O3over time (Sicard et al. 2013; Guerreiro et al. 2014). To quantify linear trends, the non-parametric Sen’s slope estimator was used (Sicard et al. 2013, 2016a; Araminien? et al. 2019). Annual trends were calculated for O3metrics over the time period 2000–2014 for each European country as well as for four European regions as classified in UNECE ( 2010). Table 1 shows the regional classification of countries. The results are considered statistically significant at p < 0.05.
Results
European distribution of air temperature and ozone metrics
Over the time period 2000–2014, the minimum annual air temperatures (7.0 ± 0.3 °C) occurred in Northern Europe while the maximum values (12.7 ± 0.5 °C) were found in Mediterranean Europe (Fig.1). Atlantic and Continental central Europe showed mean annual temperature ranging from 8.2 to 10.2 °C (Fig.1). Taking into account mean O3concentrations, Mediterranean Europe showed valuesranging from 42.9 ppb in 2011 to 45.0 ppb in 2003 whilst the other parts of Europe showed annual average values well below 40 ppb for all considered years (Fig.2). Similarly, the highest AOT40 values (38,359 ppb h) were observed in Mediterranean Europe whilst the lowest AOT40 values (5094 ppb h) were found in Northern Europe (Fig.3). In Continental central Europe, AOT40 ranged from 13,636 to 23,515 ppb h while in Atlantic central Europe AOT40 varied from 8207 to 13,751 ppb h (Fig.3). Taking into account POD0 values, the minimum value (14.0 mmol O3m?2) was found in 2006 in Northern Europe while the maximum values, 29.7 and 32.1 mmol O3m?2were observed in Atlantic and Mediterranean Europe, respectively (Fig.4). Similar results were found for POD1 (Fig.5).

Table 1 Regional classification of countries adopted in this study based on Manual on methodologies and criteria for modelling and mapping critical loads and levels of air pollution effects, risks and trends (UNECE 2017)
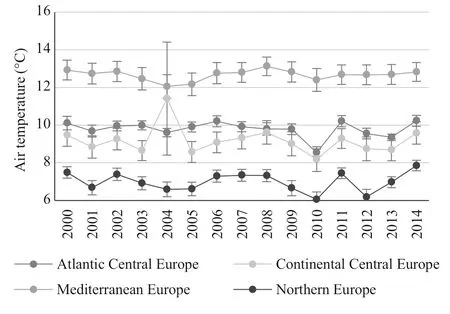
Fig.1 Mean annual air temperature (in °C ± Standard Error) in Europe over the time period 2000–2014
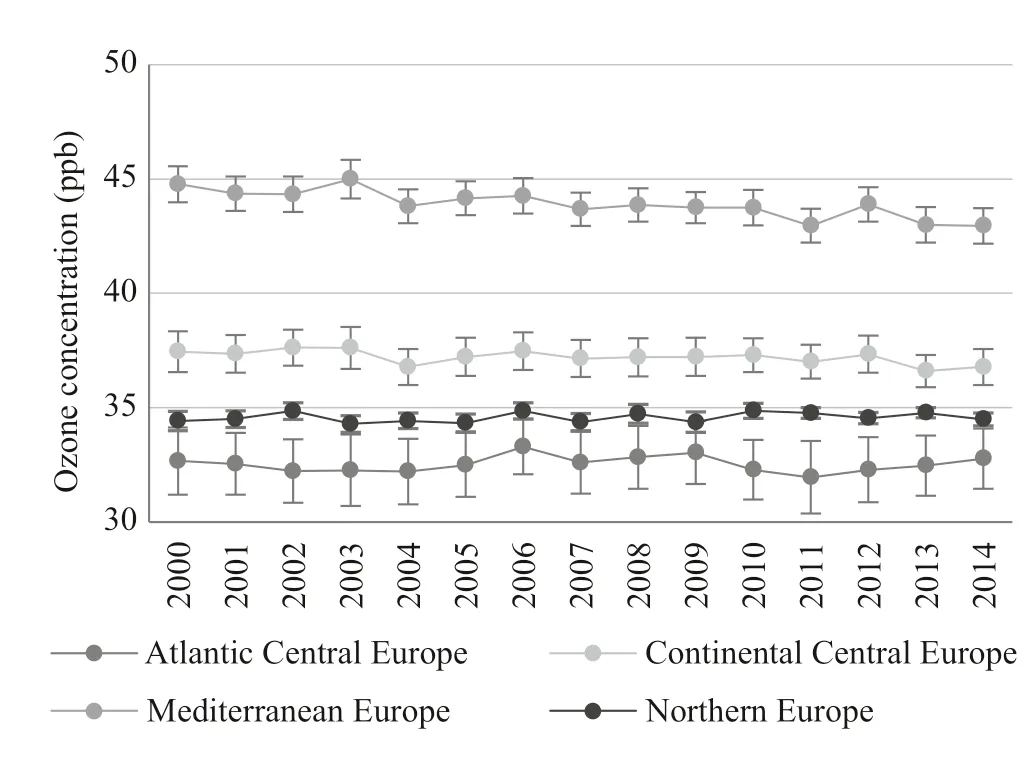
Fig.2 Mean ozone concentration (in ppb ± Standard Error) in Europe over the time period 2000–2014
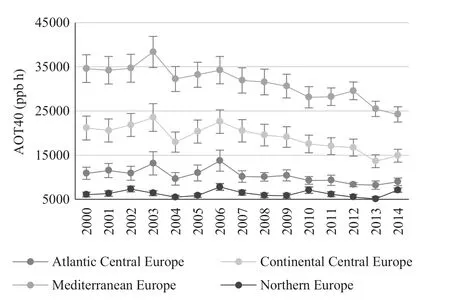
Fig.3 Mean AOT40, i.e. accumulated exposure over a threshold of 40 ppb (in ppb h ± Standard Error) in Europe over the time period 2000–2014
Trends in ground-level ozone metrics at European level
The annual trend magnitudes for O3concentrations, AOT40, POD0 and POD1 over the time period 2000–2014 are shown in Tables 2, 3, 4 and 5. The O3mean concentrations decreased significantly ( p < 0.05) by 0.4 ppb per decade in Continental Central Europe and by 1.1 ppb per decade in Mediterranean Europe (Table 2). In Atlantic Central Europe and Northern Europe, the trends for O3mean concentration were not statistically significant (Table 2). The exposure index AOT40 significantly declined in Atlantic, Continental and Mediterranean Europe with a magnitude of 2124, 5532 and 7161 ppb h per decade, respectively (Table 3). POD0 and POD1 increased significantly over the time period 2000–2014 all over Europe, except in Northern Europe showing a positive but not significant ( p > 0.5) trend (Tables 4, 5). POD0 and POD1 increased by 4.3 and 3.3 mmol O3m?2per decade in Atlantic Central Europe respectively, and by 2.4 and 3.0 mmol O3m?2per decade in Continental Central Europe while higher trend magnitudes were found in Mediterranean Europe: POD0 and POD1 significantly increased by 5.7 and 6.1 mmol O3m?2per decade, respectively. It is important to underline that POD0 and POD1 values are increasing since 2010.
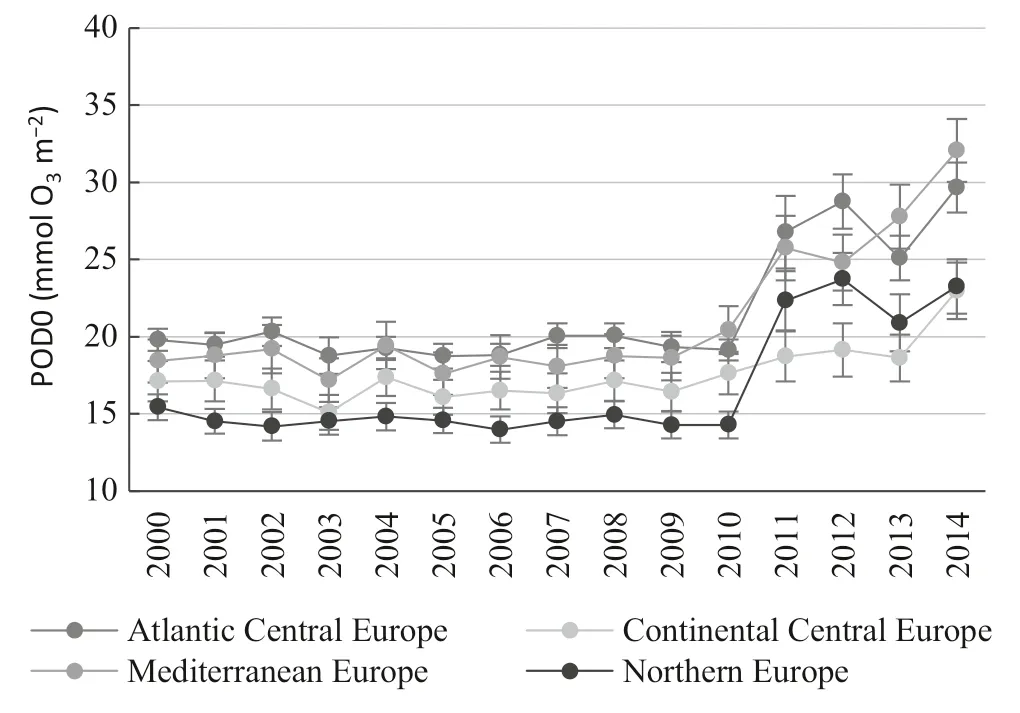
Fig.4 Mean Phytotoxic Ozone Dose above a threshold Y of 0 nmol m ?2 s ?1 (POD0 in mmol O 3 m ?2 ± Standard Error) in Europe over the time period 2000–2014
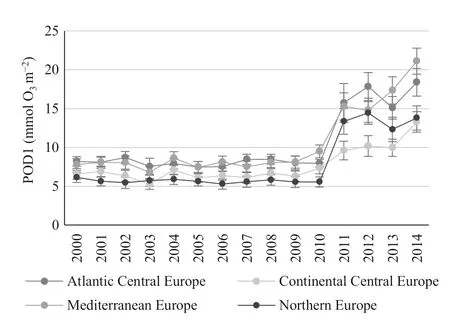
Fig.5 Mean Phytotoxic Ozone Dose above a threshold Y of 1 nmol m? 2 s? 1 (POD1 in mmol. O 3 m? 2 ± Standard Error) in Europe over the time period 2000–2014
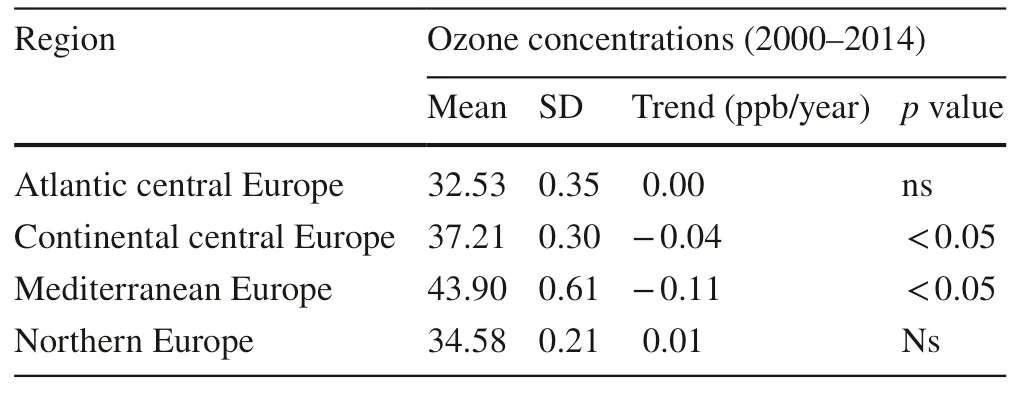
Table 2 Regional average ± standard deviation (SD) and annual trend, obtained by the Mann Kendall test for ozone concentrations over the time period 2000–2014 (not significant, ns)
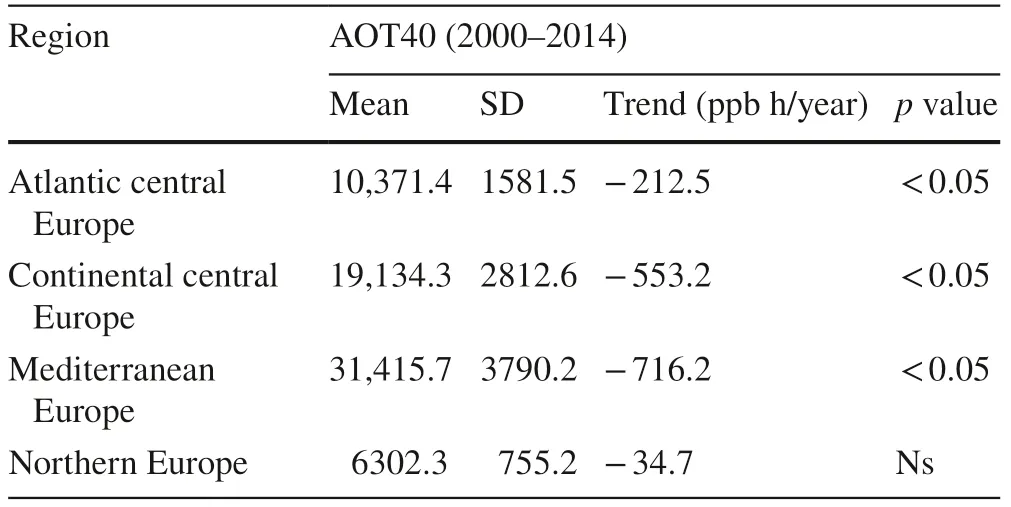
Table 3 Regional average ± standard deviation (SD) and annual trend, obtained by the Mann Kendall test for AOT40 over the time period 2000–2014 (not significant, ns)
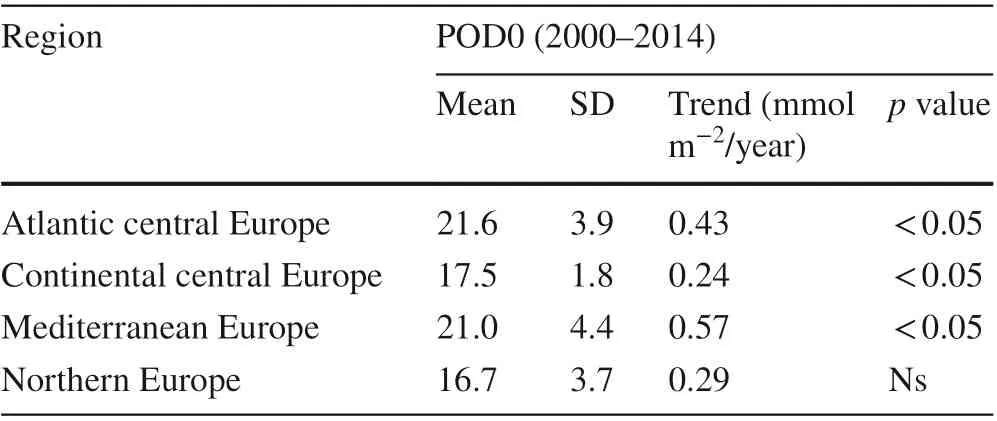
Table 4 Regional average ± standard deviation (SD) and annua trend, obtained by the Mann Kendall test for POD0 over the tim period 2000–2014 (not significant, ns)
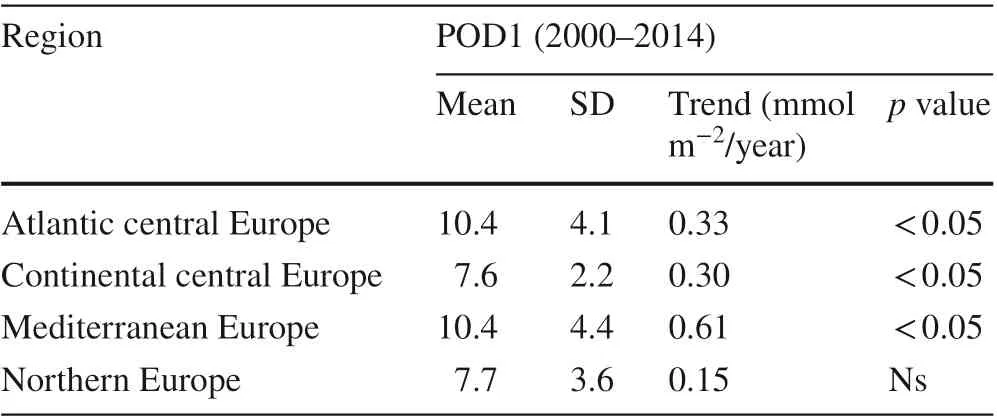
Table 5 Regional average ± standard deviation (SD) and annua trend, obtained by the Mann Kendall test for POD1 over the tim period 2000–2014 (not significant, ns)
Trends in ground-level ozone metrics at country-level

Fig.6 Annual trends for AOT40 (in ppb h per year) a and ozone concentrations (in ppb) b in European countries. Blue color is for negative trends, pink for positive ones. Countries with not significant trends ( p > 0.05) are striped
Over the time period 2000–2014, the exposure AOT40 index significantly declined in most of European countries (Fig.6 a). The lowest value was found in Switzerland (? 1376 ppb h year?1) and the highest values were observed in the Isle of Man (self-governing British Island) and Malta (+ 200 ppb h year?1and + 249 ppb h year?1respectively). Similar results were found for trends in O3concentrations (Fig.6 b). In particular, only six countries showed positive trends (Denmark, United Kingdom, the Netherlands, Germany, Sweden and Svalbard). On the contrary, trends of POD0 and POD1 were positive in all countries (Fig.7 a and b) with minimum values of + 0.03 and + 0.04 mmol m?2per year and maximum values of + 1.06 and + 0.93 mmol m?2per year for POD0 and POD1, respectively.
Discussion and conclusions

Fig.7 Annual trends for POD0 a and POD1 b (in mmol O 3 m– 2 per year) in European countries. Blue color is for negative trends, red for positive ones. Countries with not significant trends ( p > 0.05) are striped
Our results showed a general decrease of O3concentrations and exposure-based index, namely AOT40, all over Europe and a general increase of flux-based metrics (POD0 and POD1) over the time-period 2000–2014. These results are in line with other studies conducted in different European countries. Anav et al. ( 2019) found that O3concentrations and AOT40 declined all over Europe from 2000 to 2014, while PODY did not. Karlsson et al. ( 2017) found a significantly decreasing trends of AOT40 in Fennoscandia and United Kingdom over the time period 1990–2015 highlighting that AOT40 is projected to no longer exceed the critical level established for forest protection for most of Northern Europe by 2050, while POD1 does not fall below its critical level. Similarly, the analysis conducted by Mills et al. ( 2018) at global level by using the international Tropospheric Ozone Assessment Report (TOAR) database showed a statistically significant decreasing trends of 45% of AOT40 (for perennial vegetation) and highlighted the reduction of AOT40 at many European sites. At country level, Araminien? et al. ( 2019) found negative trends of O3concentrations (? 0.28 ppb decade?1) and AOT40 (? 2,540 ppb h decade?1) but a positive trend for POD0 (+ 0.39 mmol O3m?2decade?1) in Lithuania. Our results demonstrate the large-scale success of European control strategies, such as the Air Quality Framework Directive (96/62/EC), Large Combustion Plant Directive (2001/80/EC), National Emission Ceilings Directives (2001/81/EC) and the Gothenburg Protocol (1999) under the United Nations Convention on Long-Range Transboundary Air Pollution (LRTAP), targeted at decreasing peak O3levels and reducing the risk of O3impacts on vegetation and human health. The emission reductions have primarily been achieved as a result of the progress in vehicle technologies, the stringent inspection systems legislation related to the “Euro” standards, the use of flue gas abatement techniques, the progress in the storage and distribution of solvents (Vestreng et al. 2008; EEA 2018; Sicard et al. 2020b). However, our results showed a general increase of PODY all over Europe between 2000 and 2014 highlighting the relative insensitivity of PODY to O3precursors control strategies. Climate change is identified as the responsible of this insensitivity as postulated in previous studies (Liu et al. 2016a, b; Fu et al. 2017; Anav et al. 2019). They reported earlier green-up dates and delayed dormancy dates then a longer growing season due to changing climate. Moreover, climate change increases the stomatal conductance thanks to the positive effects of higher air temperature and solar radiation on stomata opening (Hoshika et al. 2015). Even if the O3mean concentrations decreased, higher PODY levels were observed over time leading to higher O3risk to European forests (Proietti et al. 2016; Anav et al. 2019). Anav et al. ( 2019) hypothesized that the positive feedback between climate change and PODY will increase in the near future and the efforts in controlling emissions of O3precursors could be significantly off set by climate change, thus increasing the O3risk for forests. A primary goal is to define a metric for O3-risk assessment, which can identify ecosystems at O3risk to protect them using standards and policies. In Europe, AOT40 has been widely used, under the assumption that plant injury and exposure to O3concentrations are correlated (EPA 2007; UNECE 2011; Fares et al. 2013). To date, several studies report a general growing consensus for moving toward a biologically-sound stomatal flux-based standard (PODY) as new European legislative standard (Mills et al. 2011; Fares et al. 2013; Sicard et al. 2016b, c; Anav et al. 2016, 2019) although critical levels for vegetation protection still need to be validated (Sicard et al. 2016c). Epidemiological observation of O3-induced injury and environmental variables including O3can be used to derive consistent stomatal flux-based critical levels for different type of vegetation under natural field conditions (De Marco and Sicard 2019; Paoletti et al. 2019). The question about deriving new critical levels is still a challenge for the scientific community (De Marco and Sicard 2019), even because some advantage of AOT40 are still present. Indeed the simplicity and fast applicability of AOT40 could be an advantage for the use of the concentration-based metric (Anav et al. 2016). But on the other side AOT40 is not taking into consideration more biological processes linked to the stomatal aperture and can have spatially and temporally different patterns (De Marco et al. 2015). These consideration highlights the role of climate into determination of the impacts ofozone on forests. Consequently, strategies integrating both climate and air quality policies are urgently needed for forest protection against the negative impacts of O3(Ainsworth et al. 2012).
FundingOpen access funding provided by Ente per le Nuove Tecnologie, l’Energia e l’Ambiente within the CRUI-CARE Agreement.
Open AccessThis article is licensed under a Creative Commons Attribution 4.0 International License, which permits use, sharing, adaptation, distribution and reproduction in any medium or format, as long as you give appropriate credit to the original author(s) and the source, provide a link to the Creative Commons licence, and indicate if changes were made. The images or other third party material in this article are included in the article’s Creative Commons licence, unless indicated otherwise in a credit line to the material. If material is not included in the article’s Creative Commons licence and your intended use is not permitted by statutory regulation or exceeds the permitted use, you will need to obtain permission directly from the copyright holder. To view a copy of this licence, visit http://creat iveco mmons.org/licen ses/by/4.0/.
References
Agathokleous E, Kitao M, Kinose Y (2018) A review study on ozone phytotoxicity metrics for setting critical levels in Asia. Asian J Atmos Environ 12:1–16
Ainsworth EA, Yendrek CR, Sitch S, Collins WJ, Emberson LD (2012) The effects of tropospheric ozone on net primary productivity and implications for climate change. Annu Rev Plant Biol 63:637–661
Anav A, Menut L, Khvorostyanov D, Viovy N (2011) Impact of tropospheric ozone on the Euro-Mediterranean vegetation. Glob Change Biol 17:2342–2359
Anav A, De Marco A, Proietti C, Alessandri A, Dell’Aquila A, Cionni I, Friedlingstein P, Khvorostyanov D, Menut L, Paoletti E, Sicard P, Sitch S, Vitale M (2016) Comparing concentration-based (AOT40) and stomatal uptake (PODY) metrics for ozone risk assessment to European forests. Glob Change Biol 22:1608–1627
Anav A, De Marco A, Friedlingstein P, Savi F, Sicard P, Sitch S, Vitale M, Paoletti E (2019) Growing season extension affects ozone uptake by European forests. Sci Total Environ 669:1043–1052
Araminien? V, Sicard P, Anav A, Agathokleous E, Stak?nas V, De Marco A, Varnagiryt?-Kaba?inskien? I, Paoletti E, Girg?dien? R (2019) Trends and inter-relationships of ground-level ozone metrics and forest health in Lithuania. Sci Total Environ 658:1265–1277
Brus DJ, Hengeveld GM, Walvoort DJJ, Goedhart PW, Heidema AH, Nabuurs GJ, Gunia K (2011) Statistical mapping of tree species over Europe. Eur J For Res 131:145–157
Cailleret M, Ferretti M, Gessler A, Rigling A, Schaub M (2018) Ozone effects on European forest growth-towards an integrative approach. J Ecol 106:1377–1389
CLRTAP (2017) Mapping critical loads for ecosystems, Chapter V of Manual on methodologies and criteria for modelling and mapping critical loads and levels and air pollution effects, risks and trends
Chameides WL, Lindsay RW, Richardson J, Kiang CS (1988) The role of biogenic hydrocarbons in urban photochemical smog: Atlanta as a case study. Science 241:1473–1475
Colette A, Solberg S, Beauchamp M, Bessagnet B, Mal-herbe L, Guerreiro C (2017) Long term air quality trendsin Europe: contribution of meteorological variability, natu-ral factors and emissions. ETC/ACM, Bilthoven
Cooper OR, Parrish DD, Ziemke J, Balashov NV, Cupeiro M, Galbally IE, Gilge S, Horowitz L, Jensen NR, Lamarque JF, Naik V, Oltmans SJ, Schwab J, Shindell DT, Thompson AM, Thouret V, Wang Y, Zbinden RM (2014) Global distribution and trends of tropospheric ozone: an observation-based review. Elementa 2:29
De Leeuw F (2000) Trends in ground level ozone concentrations in the European Union. Environ Sci Policy 3:189–199
De Marco A, Sicard P (2019) Why do we still need to derive ozone critical levels for vegetation protection. Int J Environ Sci Nat Resour 21:164–166
De Marco A, Sicard P, Vitale M, Carriero G, Renou C, Paoletti E (2015) Metrics ofozone risk assessment for Southern European forests: testing the potential of canopy moisture content as plant response indicator. Atmos Environ 120:182–190
EPA (2007) Review of the National Ambient Air Quality Standards for Ozone: Policy Assessment of Scientific and Technical Information. OAQPS Staff Paper. U.S. Environmental Protection Agency, Offi ce of Air Quality Planning and Standards, Research Triangle Park, Durham NC. Publication No. EPA-452/R-07-003
EEA (2018) European Environment Agency: Air quality in Europe. 2018 report. ISBN 978-92-9213-989-6. https ://doi.org/10.2800/77741 1.
Fares S, Vargas R, Detto M, Goldstein AH, Karlik J, Paoletti E, Vitale M (2013) Tropospheric ozone reduces carbon assimilation in trees: estimates from analysis of continuous flux measurements. Glob Change Biol 19:2427–2443
Fu YSH, Piao SL, Delpierre N, Hao FH, H?nninen H, Liu YJ, Sun WC, Janssens IA, Campioli M (2017) Larger temperature response of autumn leaf senescence than spring leaf-out phenology. Glob Change Biol 24:2159–2168
Guerreiro CBB, Foltescu V, de Leeuw F (2014) Air quality status and trends in Europe. Atmos Environ 98:376–384
Hoshika Y, Katata G, Deushi M, Watanabe M, Koike T, Paoletti E (2015) Ozone-induced stomatal sluggishness changes carbon and water balance of temperate deciduous forests. Sci Rep 5:9871
Jarvis PG (1976) The interpretation of the variations in leaf water potential and stomatal conductance found in canopies in the field. Philos Trans R Soc Lond B 273:593–610
Karlsson PE, Klingberg J, Engardt M, Andersson C, Langner J, Karlsson GP, Pleijel H (2017) Past, present and future concentrations of ground-level ozone and potential impacts on ecosystems and human health in northern Europe. Sci Total Environ 576:22–35
Klingberg J, Engardt M, Karlsson PE, Langner J, Pleijel H (2014) Declining ozone exposure of European vegetation under climate change and reduced precursor emissions. Biogeosciences 11:5269–5283
Liu Q, Fu YSH, Zeng ZZ, Huang MT, Li XR, Piao SL (2016a) Temperature, precipitation, and insolation effects on autumn vegetation phenology in temperate China. Glob Change Biol 22:644–655
Liu Q, Fu YSH, Zhu ZC, Liu YW, Liu Z, Huang MT, Janssens IA, Piao SL (2016b) Delayed autumn phenology in the Northern Hemisphere is related to change in both climate and spring phenology. Glob Change Biol 22:3702–3711
Martin F, Fileni L, Palomino I, Vivanco MG, Garrido JL (2014) Analysis of the spatial representativeness of rural background monitoring stations in Spain. Atmos Pollut Res 5:779–788
Menut L, Bessagnet B, Khvorostiyanov D, Beekmann M, Blond N, Colette A, Coll I, Curci G, Foret G, Hodzic A, Mailler S, Meleux F, Monge JL, Pison I, Siour G, Turquety S, Valari M, Vautard R, Vivanco MG (2013) CHIMERE 2013: a model for regional atmospheric composition modelling. Geosci Model Dev 6:981–1028
Mickley LJ, Jacob DL, Rind D (2001) Uncertainty in preindustrial abundance of tropospheric ozone: implications for radiative forcing calculations. J Geophys Res 106:3389–3399
Millán MM, Mantilla E, Salvador R, Carratalá A, Sanz MJ, Alonso L, Gangoiti G, Navazo M (2000) Ozone cycles in the Western Mediterranean basin: interpretation of monitoring data in complex coastal terrain. J Appl Meteorol 39:487–508
Mills G, Pleijel H, Braun S, Buker P, Bermejo V, Calvo E, Danielsson H, Emberson L, Fernandez IG, Grunhage L, Harmens H, Hayes F, Karlsson PE, Simpson D (2011) New stomatal flux-based critical levels for ozone effects on vegetation. Atmos Environ 45:5064–5068
Mills G, Sharps K, Simpson D, Pleijel H, Broberg M, Uddling J, Jaramillo F, Davies WJ, Dentener F, Van den Berg M, Agrawal M, Agrawal SB, Ainsworth EA, Buker P, Emberson L, Feng ZZ, Harmens H, Hayes F, Kobayashi K, Paoletti E, Van Dingenen R (2018) Ozone pollution will compromise efforts to increase global wheat production. Glob Change Biol 24(8):3560–3574. https://doi.org/10.1111/gcb.14157
Monks PS, Archibald AT, Colette A, Cooper O, Coyle M, Derwent R, Fowler D, Granier C, Law KS, Mills GE, Stevenson DS, Tarasova O, Thouret V, von Schneidemesser E, Sommariva R, Wild O, Williams M (2015) Tropospheric ozone and its precursors from the urban to the global scale from air quality to shortlived climate forcer. Atmos Chem Phys 15:8889–8973
Musselman RC, Lefohn AS, Massman WJ, Heath RL (2006) A critical review and analysis of the use ofexposure- and flux-based ozone indices for predicting vegetation effects. Atmos Environ 40:1869–1888
Paoletti E, Alivernini A, Anav A, Badea O, Carrari E, Chivulescu S, Conte A, Ciriani ML, Dalstein-Richier L, De Marco A, Fares S, Fasano G, Giovannelli A, Lazzara M, Leca S, Materassi S, Moretti V, Pitar D, Popa I, Sabatini F, Salvati L, Sicard P, Sorgi T, Hoshika Y (2019) Toward stomatal-flux based forest protection against ozone: the MOTTLES approach. Sci Total Environ 691:516–527
Paoletti E (2006) Impact ofozone on Mediterranean forests: a review. Environ Pollut 144:463–474
Paoletti E, Manning WJ (2007) Toward a biologically significant and usable standard for ozone that will also protect plants. Environ Pollut 150:85–95
Proietti C, Anav A, DeMarco A, Sicard P, Vitale M (2016) A multisites analysis on the ozone effects on gross primary production of European forests. Sci Total Environ 556:1–11
Ronan AC, Ducker JA, Schnell JL, Holmes CD (2020) Have improvements in ozone air quality reduced ozone uptake into plants? Elem Sci Anth 8:2
Sanz MJ, Calatayud V, Calvo E (2000) Spatial pattern ofozone injury in Aleppo pine related to air pollution dynamics in a coastalmountain region ofeastern Spain. Environ Pollut 108:239–247
Shindell D, Kuylenstierna JCI, Vignati E, van Dingenen R, Amann M, Klimont Z, Anenberg SC, Muller N, Janssens-Maenhout G, Raes F, Schwartz J, Faluvegi G, Pozzoli L, Kupiainen K, H?glund-Isaksson L, Emberson L, Streets D, Ramanathan V, Hicks K, Oanh NTK, Milly G, Williams M, Demkine V, Fowler D (2012) Simultaneously mitigating near-term climate change and improving human health and food security. Science 335:183–189
Sicard P, Coddeville P, Galloo JC (2009) Near-surface ozone levels and trends at rural stations in France over the 1995–2003 period. Environ Monit Assess 156:141–157
Sicard P, Thibaudon M, Besancenot JP, Mangin A (2013) Forecast models and trends for the main characteristics of the Olea pollen season in Nice (south-eastern France) over the 1990–2009 period. Grana 51:52–62
Sicard P, Serra R, Rossello P (2016a) Spatio-temporal trends of surface ozone concentrations and metrics in France. Environ Res 149:122–144
Sicard P, Augustaitis A, Belyazid S, Calfapietra C, De Marco A, Fenn M, Grulke N, He S, Matyssek R, Serengil Y, Wieser G, Paoletti E (2016b) Global topics and novel approaches in the study of air pollution, climate change and forest ecosystems. Environ Pollut 213:977–987
Sicard P, De Marco A, Dalstein-Richier L, Tagliaferro F, Paoletti E (2016c) An epidemiological assessment of stomatal ozone fluxbased critical levels for visible ozone injury in Southern European forests. Sci Total Environ 541:729–741
Sicard P, Anav A, De Marco A, Paoletti E (2017) Projected global tropospheric ozone impacts on vegetation under different emission and climate scenarios. Atmos Chem Phys 17:12177–12196
Sicard P, Agathokleous E, Araminiene V, Carrari E, Hoshika Y, De Marco A, Paoletti E (2018) Should we see urban trees as effective solutions to reduce increasing ozone levels in cities? Environ Pollut 243:163–176
Sicard P, Khaniabadi YO, Perez S, Gualtieri M, De Marco A (2019) Effect of O3, PM10 and PM2.5 on cardiovascular and respiratory diseases in cities of France, Iran and Italy. Environ Sci Pollut Res 26:32645–32665
Sicard P, De Marco A, Agathokleous E, Feng ZZ, Xu XB, Paoletti E, Diéguez Rodriguez JJ, Calatayud V (2020a) Amplified ozone pollution in cities during the COVID-19 lockdown. Sci Total Environ 735:139542
Sicard P, Paoletti E, Agathokleous E, Araminien? V, Proietti C, Coulibaly F, De Marco A (2020b) Ozone weekend effect in cities: Deep insights for urban air pollution control. Environ Res 191:110193
Simon H, Reff A, Wells B, Xing J, Frank N (2015) Ozone trends across the United States over a period of decreasing NOx and VOC emissions. Environ Sci Tech 49:186–195
Skamarock W, Klemp JB (2008) A time-split non-hydrostatic atmospheric model for weather research and forecasting applications. J Comput Phys 227:3465–3485
UNECE (2010) Mapping critical levels for vegetation. Manual on methodologies and criteria for modelling and mapping critical loads and levels and air pollution effects, risks and trends, United Nations Economic Commission for Europe (UNECE) convention on long range transboundary air pollution, Geneva p 254. https://www.icpma pping.org
UNECE (2011) Manual on methodologies and criteria for modelling and mapping critical loads and levels and air pollution effects, risks and trends. Convention on long-range transboundary air pollution. https://www.icpma pping.org. Accessed November 2012
UNECE (2017) Mapping critical levels for vegetation. International cooperative programme on effects of air pollution on natural vegetation and crops, Bangor, UK
Vestreng V, Ntziachristos L, Semb A, Reis S, Isaksen ISA, Tarrasón L (2008) Evolution of NOx emissions in Europe with focus on road transport control measures. Atmos Chem Phys Discuss 8:10697–10747
Wittig VE, Ainsworth EA, Naidu SL, Karnosky DF, Long SP (2009) Quantifying the impact of current and future tropospheric ozone on tree biomass, growth, physiology and biochemistry: a quantitative meta-analysis. Glob Change Biol 15:396–424
 Journal of Forestry Research2021年2期
- Journal of Forestry Research的其它文章
- Stem taper functions for Betula platyphylla in the Daxing’an Mountains, northeast China
- Leaf phenotypic variation of endangered plant Tetracentron sinense Oliv. and influence of geographical and climatic factors
- Ecological variations of woody species along an altitudinal gradient in the Qinling Mountains of Central China: area-based versus mass-based expression of leaf traits
- Variations in stem radii of Larix principis-rupprechtii to environmental factors at two slope locations in the Liupan Mountains, northwest China
- A review of ecological mechanisms for management practices of protective forests
- Variation of basic density, calorific value and volumetric shrinkage within tree height and tree age of Ugandan grown Eucalyptus grandis wood
