Hyperspectral imaging technology to detect the vigor of thermal-damaged Quercus variabilis seeds
Lei Pang · Jiang Xiao · Jingjing Ma · Lei Yan
Abstract This study investigated the feasibility of hyperspectral imaging techniques to estimate the vigor of heatdamaged Quercus variabilis seeds. Four thermal damage grades were classified according to heat treatment duration (0, 2, 5, and 10 h). After obtaining hyperspectral images with a 370–1042 nm hyperspectral imager that included visible and near infrared light, germination was tested to confirm estimates. The Savitzky–Golay (SG) second derivative was used to preprocess the spectrum to reduce any noise impact. The successive projections algorithm (SPA), principal component analysis, and local linear embedding algorithm were used to extract the characteristic spectral bands related to seed vigor. Finally, a model for seed vigor classification of Q. variabili s based on partial least squares support vector machine (LS-SVM) with different spectral data sets was developed. The results show that the spectrum after SG second derivative preprocessing was better for developing the model, and SPA performed the best among the three feature band selection methods. The combination SG second derivative-LS-SVM provided the best classification model for Q. variabilis seed vigor, with the prediction set reaching 98.81%. This study provides an important basis for rapid and nondestructive assessment of the vigor of heat-damaged seeds using hyperspectral imaging techniques.
Keywords Seed vigor level · Quercus variabilis · Heat damage · Hyperspectral · Least squares support vector machine
Introduction
Quercus variabilis (Fagaceae) is an important deciduous tree for raw material to produce lumber, cork, silicone, fire charcoal, and edible fungi (Zhou et al. 2010). In addition, Q. variabilis is an excellent species for green spaces, windbreaks, and water conservation and plays an important role in developing the local economy and protecting ecological balance (Guama and Linera 2006). However, Q. variabilis seeds are prone to mildew, susceptible to insects, and are generally diffi cult to store. They can only be stored for a very short time at room temperature and need to be stored in the refrigerator after soaking. If the storage conditions are unfavorable, such as high temperature, the seeds will be thermally damaged, thus, affecting seed vigor (Lanzano et al. 2009).
Traditional seed viability assays include physiological, physical, and biochemical tests (Lombardi et al. 1997), but they are time consuming, laborious, and damage the seeds. To avoid these problems, nondestructive methods such as thermal infrared imaging technology (Dumont et al. 2015), Raman spectroscopy (Lee et al. 2017), and Fourier nearinfrared spectroscopy have been used (Qiu et al. 2018). Spectral imaging technology, one of many nondestructive testing techniques, acquires spectral information while collecting image information of the tested sample without touching the object. Compared with other point-based scanning spectroscopy techniques, hyperspectral imaging covers a relatively large sample area and can provide important spatial information (Doherty et al. 2013).
Hyperspectral imaging technology has been widely used for seed classification of agricultural and forestry crops (Guo et al. 2017; Yang et al. 2017) and to analyze nutrients in seeds (Ringsted et al. 2017; Li et al. 2018b). For research on seed vigor determination, many researchers have made full use of the three-dimensional information provided by hyperspectral imaging technology to identify different levels of seed vigor from different directions. Wakholi et al. ( 2018) used a 1000–2500 nm short-wave near-infrared hyperspectral camera to detect the vigor of maize seeds before and after microwave treatment, and the support vector machine achieved 100% classification accuracy. Using the hyperspectral data of both sides of viable and nonviable wheat seeds, the standard normal variable (SNV)-SPA-PLS-DA model achieved higher classification accuracy using only 16 bands (Zhang et al. 2018). Nansen et al. ( 2015) tested germination of three Australian native tree species after rapid aging for different durations, and collected reflection profile data of individual seeds and reported that reduced germination was associated with significant changes in seed coat reflection curves.
In previous studies, most researchers tested typical seeds such as maize and wheat; recalcitrant seeds have been less studied. In addition, the vigor studies usually have tested for viable or nonviable, but rather than did not distinguish between multi-levela continuum, i.e., levels of vigor. The purpose of this study was thus to explore the feasibility of hyperspectral imaging to estimate levels of Q. variabilis seed vigor after different durations of heat treatment (thermal damage). The specific objectives were to (1) determine whether the Savitzky–Golay (SG) second derivative preprocessing of spectral can improve the accuracy of the classification model; (2) select the effective wavelengths related to Q. variabilis seed vigor using three different feature band extraction methods; (3) study the classification performance of the LS-SVM model using different spectral data sets and determine the optimal combination to accurately classify seed vigor.
Materials and methods
Sample preparation
Quercus variabilis seeds were collected during September 2018 in Pinggu District, Beijing, China (117° 13′ E, 49° 27′ N). Seed samples were initially screened using a water selection method, by soaking seeds in a 50 °C water bath for 40 min to inhibit growth of weevils, then storeing them at 4 °C after natural air drying. Because seeds are injured by drying temperature that are too high (> 60 °C) (Peng et al. 2018), we used a high temperature to accelerate aging and thus simulate the natural aging process of Q. variabilis seeds. The seeds were dehulled and placed in a blast drying oven at 60 °C for different durations: 0 (A), 2 (B), 5 (C), 10 h (D) with 168 samples per grade. Seeds thus had four levels of vigor. Seeds in each level were randomly divided 3:1 into a training set and a test set. The training set was used to train the classification model, while the test set was used to evaluate and verify model performance.
Hyperspectral data acquisition
The hyperspectral imaging system used in this experiment (Fig.1) consisted of a SOC710VP hyperspectral imager (Surface Optics Corp., San Diego, CA, USA), two 250-W halogen lamps (OSRAM GCA; Sylvania, Gloucester, MA, USA), a transfer device, and a computer. The scanning range of the spectrometer was 370–1042 nm with a resolution of 4.6875 nm, which included a total of 128 bands. At the time of data acquisition, the spectrometer scan speed was 30 lines/s, and image resolution was 520 × 696. To reduce the effect of variation in the light source and eliminate the effect of dark current, the black reference ( Idark) was obtained by completely covering the camera lens, and a white Teflon tile with nearly 100% reflectivity was used as the white reference ( Iref). The calibrated image ( I) was corrected using the following formula for the acquired image ( Iraw) (Mo et al. 2014):
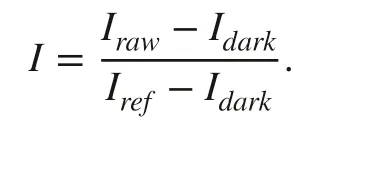
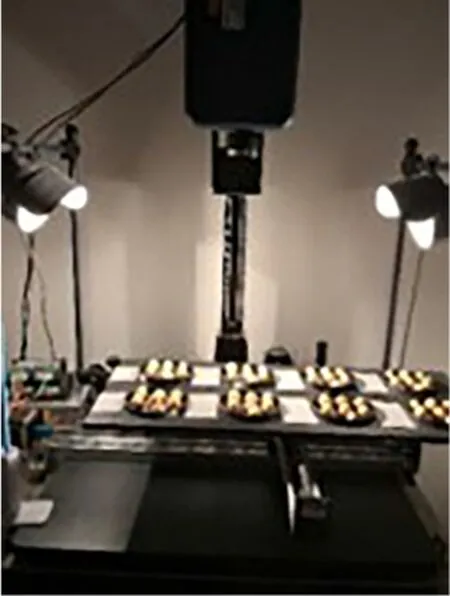
Fig.1 Hyperspectral acquisition system
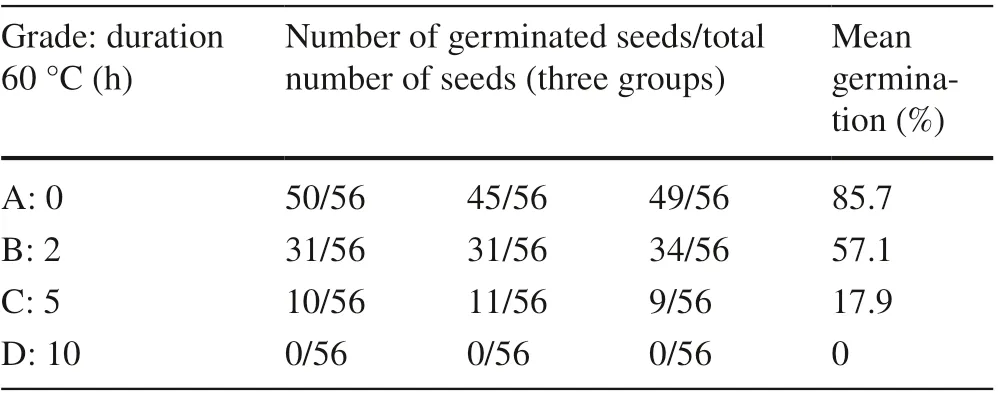
Table 1 Percentage seed germination for different grades of vigor after four durations of 60 °C heat treatments
Seed germination test
After the hyperspectral images were acquired, seeds of each level were randomly divided into three groups of 56 samples each, and standard germination experiments were performed to determine seed vigor (Shetty et al. 2011). The seeds were placed on germinating paper soaking in a petri dish (9 cm in diameter) at 25 °C. According to the ISTA ( 2019) standard, seeds with a germ length of 1 cm are regarded as germinated (Viable) (International Rules for Seed Testing 2019). The germination rate was determined after 7 days of continuous illumination. Figure 2 is a partial A-grade seed germination experiment for 7 days. Seed vigor, was characterized as the percentage of total seeds that germinated; that is, the viability ofeach group was quantified as a percentage of germinating seeds. The results of seed germination are listed in Table 1.
Spectral extraction and preprocessing
Threshold segmentation, image filling, and denoising eliminated the effect of the hyperspectral image background. The centroid ofeach seed sample was marked after the connected area was obtained. A circular area with a radius of 50 (seed budding area) was considered the region of interest (ROI) with each centroid as the center (Wang et al. 2016). A total of 672 spectral curves was obtained by averaging the pixel spectra of the ROI ofeach Q. variabilis seed.
The environment surrounding the instrument and other factors produce spectral noise and have an impact on subsequent analyses. Spectral pre-processing not only mathematically reduces, eliminates, or normalizes undesirable effects, but improves the robustness and accuracy of calibration models (Rinnan et al. 2009). Currently used spectral preprocessing methods include standard normal variables (SNV), multiple scattering correction (MSC), and SG and its derivatives (Yang et al. 2015). Here we used the SG 2nd derivative algorithm for spectral preprocessing, which effectively resolved overlapping peaks and extracted valuable information hidden in the spectrum.
Optimal wavelength selection
The successive projections algorithm (SPA) is a forward variable selection algorithm that minimizes vector space collinearity. This method fully discovers the set of variables with minimal redundant information from the spectral information, so that collinearity between the variables is minimized. The number of variables used for modeling is greatly reduced, and the speed and effi ciency of modeling improves. SPA is commonly used for effi cient wavelength extraction during spectral analysis of crops and food (Diniz et al. 2015; Hui et al. 2016; Sun et al. 2017; Cheng et al. 2018; Li et al. 2018a).
A principal component analysis (PCA) transforms raw data into a set of linearly independent representations of each dimension by linear transformation to extract the main linear components of the data. The goal of PCA is to seek out r ( r < n) principal components that largely reflect the effects of the original n variables, and these new variables are irrelevant and orthogonal (Metsalu and Vilo 2015; Du et al. 2016). If X is a matrix of m × n, the PCA dimensionality reduction of X mainly includes the following steps: calculating the covariance matrix of the sample matrix; calculating eigenvectors and eigenvalues of the covariance matrix; arranging the eigenvectors into a matrix from top to bottom according to the size of the corresponding eigenvalue and taking the first k rows to form matrix a; that is, the data after reducing to k dimensions.
The local linear embedding (LLE) algorithm is an unsupervised dimensionality reduction method for nonlinear data proposed by Roweis and Saul ( 2000). It is a manifold learning algorithm that uses local linearity to reflect global nonlinearity. This algorithm expands the understanding of dimension reduction to some extent (McIvor and Humphreys 2000). Dimension optimization is not just a simple reduction in quantity, but a mapping of signals from high-dimensional space to low-dimensional space. This progress maintains the original data properties, which is equivalent to the secondary extraction ofeigenvalues (as shown in Fig.3). The LLE algorithm can be summarized into three steps: (1) finding k neighbor points for each sample point; (2) calculating the local reconstruction weight matrix ofeach sample point from its nearest neighbors; and (3) calculating the output value of the sample point through its local reconstruction weight matrix and neighbors.
Results and discussion
Spectral analysis
Figure 4 a shows the average spectral information of all Q. variabilis seeds after different heat durations. The graph shows that the spectral curves of the four levels are basically the same, but there are obvious differences in reflectivity. Spectral reflectance decreased as heat duration increased. This phenomenon was matched with the lower germination and a longer high-temperature processing time. Another argument is that the decline of spectral reflectance indicates a decrease in seed vigor. Furthermore, the double-frequency absorption of the stretching and bending vibration of the N–H, C–H, and O–H bonds in the visible and near-infrared spectra of Q. variabilis seeds reveals chemical information about the main components, such as water, proteins, and starch. The light microwave peak at 970 nm is the combined frequency absorption of symmetrical and antisymmetrical stretching vibrations of water molecules (Yamatera et al. 1964; Polyansky et al. 1998). Figure 4 b is the averagespectrum preprocessed with the SG second derivative, which served as the basis for subsequent analysis. Although the average spectrum reflects certain rules, it does not represent the information of all samples due to the differences in biological samples. Accordingly, further analysis of all spectra is required.
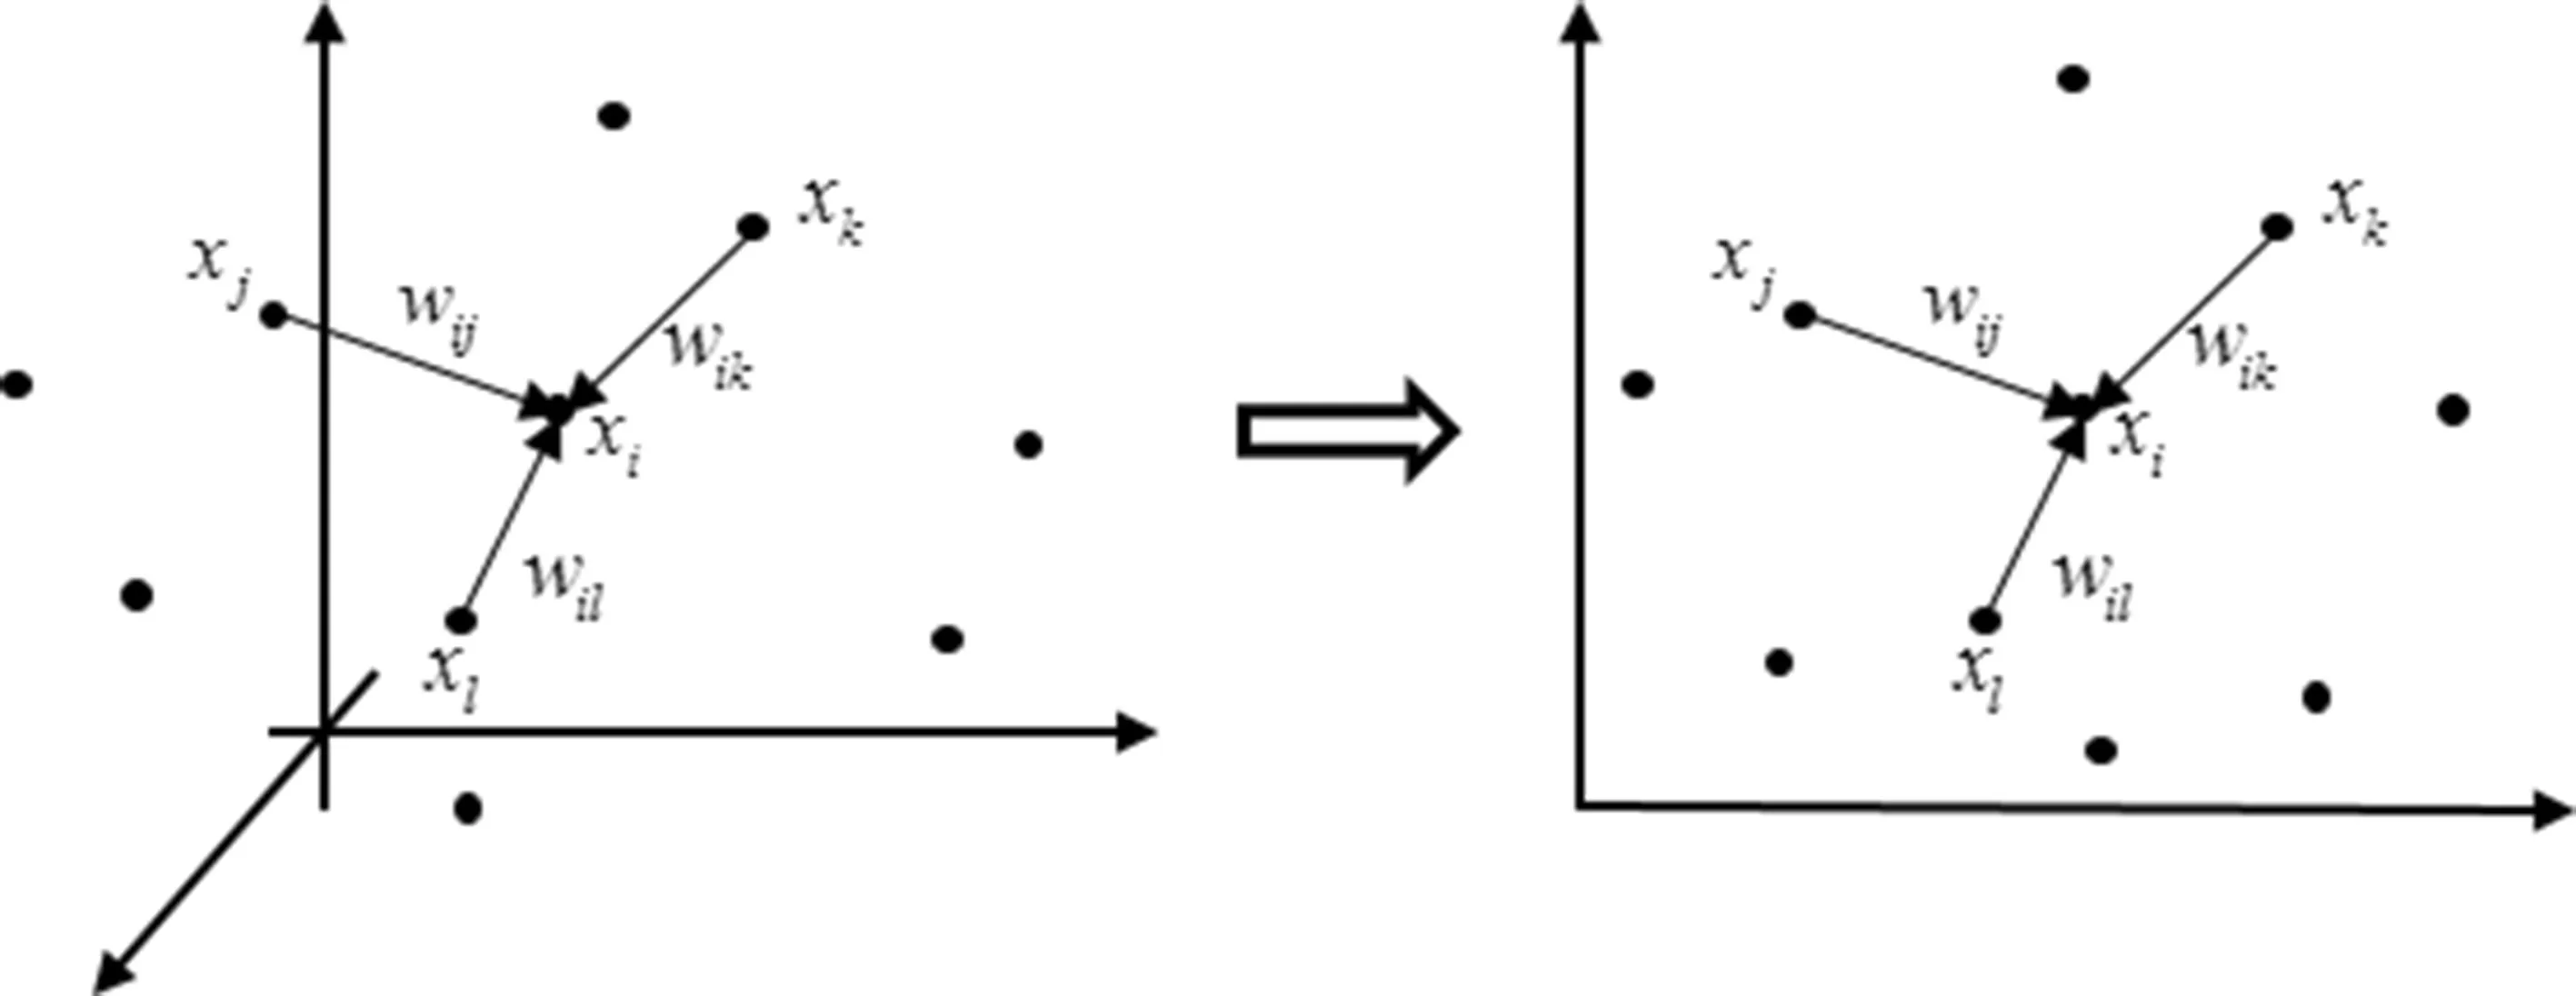
Fig.3 Dimension reduction diagram of the local linear embedding (LLE) algorithm

Fig.4 Average spectra at different levels: a original spectra; b spectra preprocessed by the Savitzky–Golay (SG) second derivative
Selection characteristic wavelengths using three algorithms
The colinear minimum effective wavelength was chosen using the SPA method. Figure 5 a demonstrates the variation in the root mean square error (RMSE) when SPA was used to calculate the characteristic wavelength of the original spectrum. The number of wavelength bands from 1 to 3, 5 to 8, and 8 to 10 is a process in which the RMSE drops rapidly. After 10 features were eventually determined, the RMSE changed, but the overall trend was stable. Figure 5 b provides the selected characteristic bands of 528.7, 559.8, 590.9, 669.6, 711.9, 722.5, 765.1, 781.2, 883.5, 894.3, and 970.7 nm. The same procedure was applied to the SG second derivative pre-processed spectrum. The representative bands were 410.8, 426.0, 472.0, 544.2, 564.9, 632.8, 653.8, 711.9, 775.8, 781.1, 888.9, 932.4, 976.2, and 1025.7 nm, respectively.
The PCA maps high-dimensional data into low-dimensional space using a linear projection and the variance of the data is expected to be the largest in the projected dimensions. The histogram of the first three principal component contributions of the preprocessed spectrum are shown in Fig.6 a. The cumulative contribution rate of the first two principal components was > 95%, representing most of the hyperspectral data information, so these two principal components were further analyzed. Each principal component was linearly superimposed by the spectra of 128 bands, and the weight coeffi cients ofeach wavelength in the first two principal components are shown in Fig.6 b, c. The wavelengths in which the weight coeffi cients of PC1 and PC2 were located at the local maximum were respectively selected as the effective wavelengths. The characteristic bands selected by PCA were revealed when the repeating band was removed. Table 2 summarizes the feature bands extracted by the PCA algorithm.
The LLE algorithm can learn the local linear low-flow model of any dimension. The difference with PCA is that LLE retains the local linear relationship of high dimensional space. In this study, the number of neighbors was set to 12. Before dimension reduction, the linear relationship between each sample and its nearest 12 samples was trained, and this linear relationship was applied to each sample after reducing the space. The weight coeffi cient of the linear relationship before and after dimensionality reduction was as constant or minimal as possible. Therefore, the band corresponding to a peak with a weight coeffi cient greater than 0.1 after dimension reduction was selected as the characteristic band. From the coeffi cient distribution map (as shown in Fig.7), seven (664.4, 711.9, 738.5, 867.2, 888.9, 905.2, and 937.9 nm) and six bands (706.6, 727.8, 759.8, 770.5, 883.5, and 894.3 nm) were selected by the original spectrum and the preprocessed spectrum, respectively.
Establish recognition model through LS-SVM
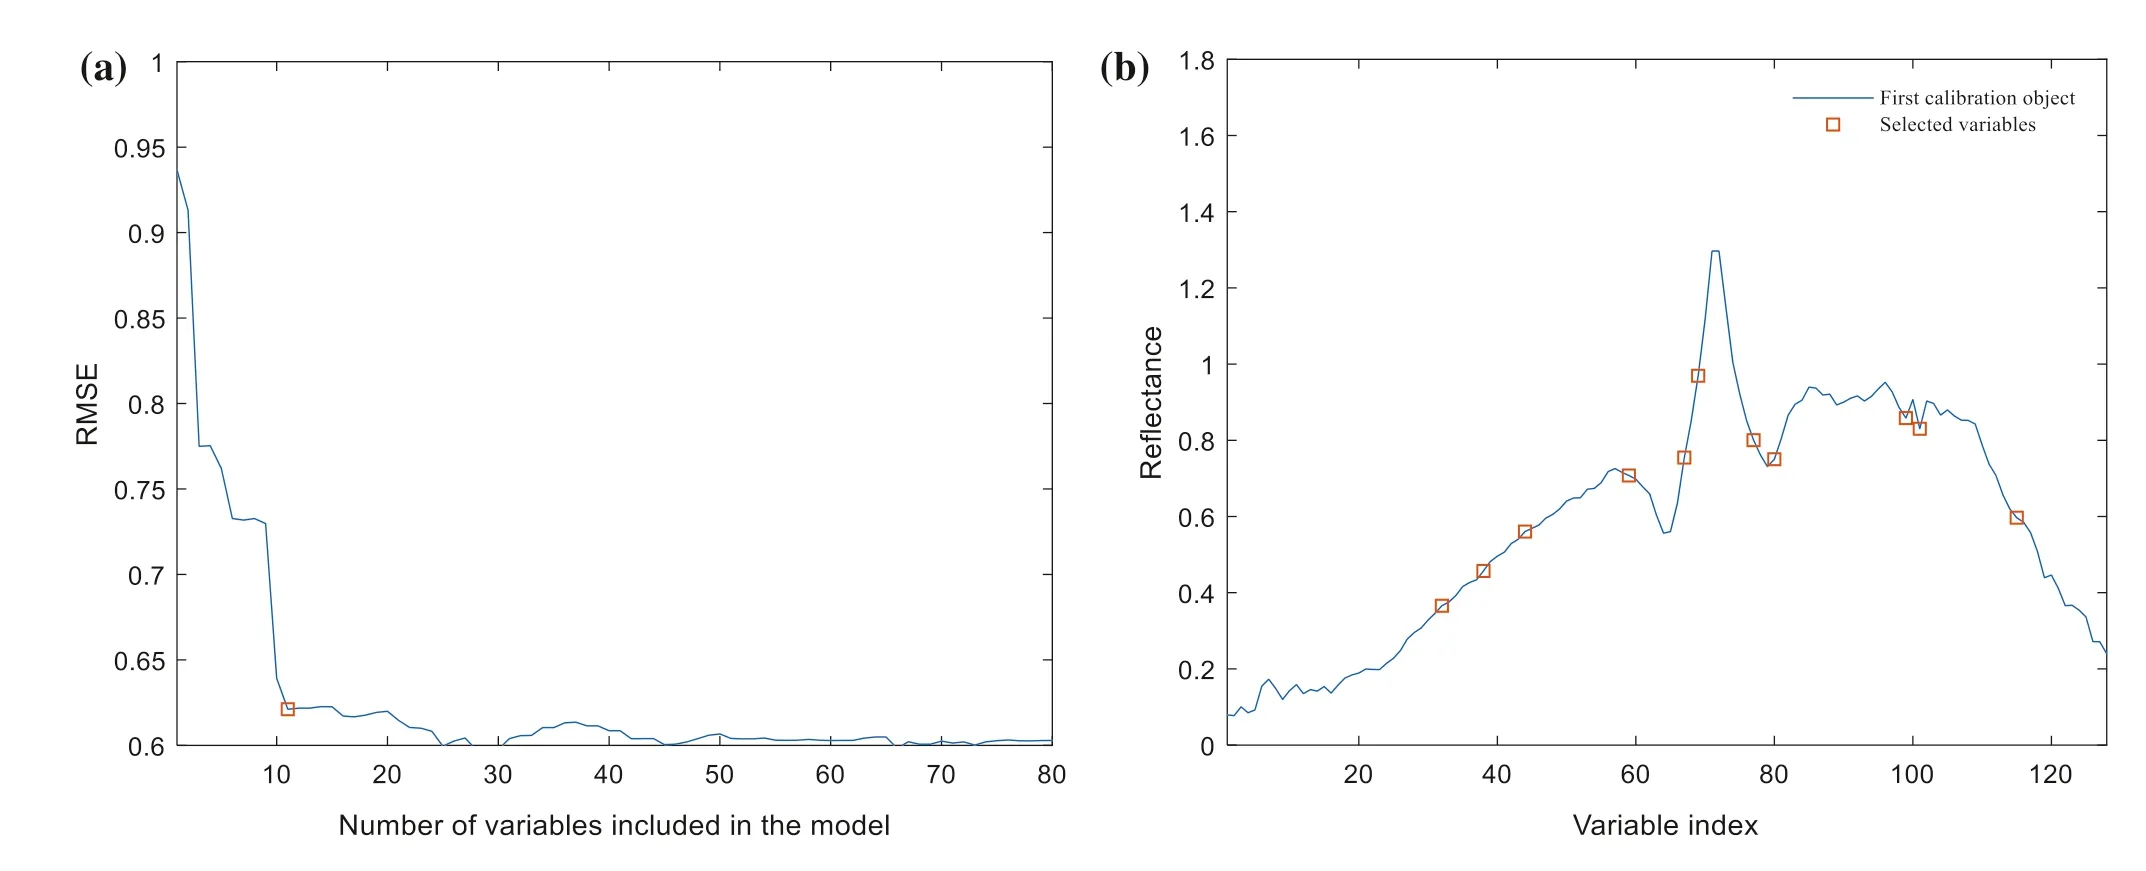
Fig.5 Selecting characteristic wavelengths from the original spectrum using the successive projections algorithm (SPA): a change in the root mean square error (RMSE); b selection of characteristic bands
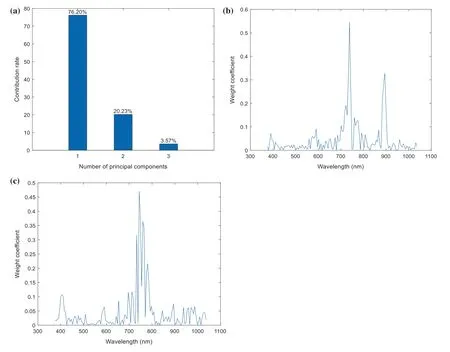
Fig.6 Principal component analysis algorithm extracts the characteristic band from the preprocessed spectrum. a Contribution rates of the first three principal components (PCs); b weight coeffi cient distribution of PC1; c weight coeffi cient distribution of PC2
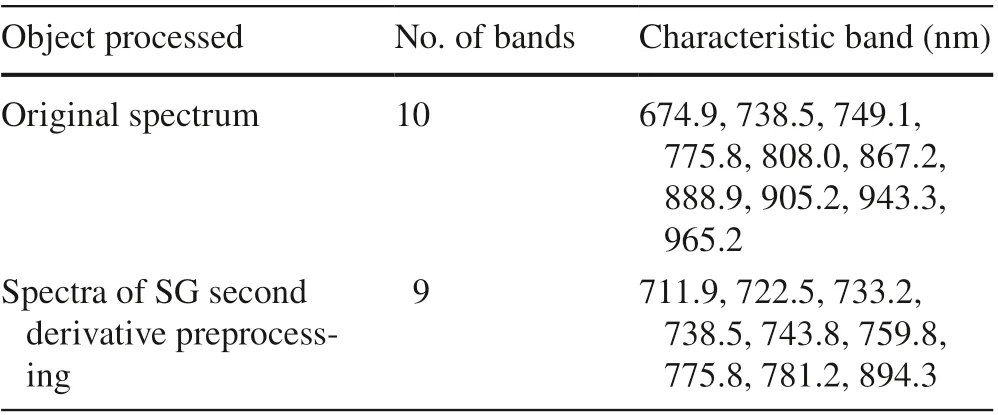
Table 2 Characteristic band table selected by PCA algorithm
After SG second derivative pre-processing and using the SPA, PCA, and LLE to select characteristic wavelengths of different spectral bands, the LS-SVM analysis model was used to classify and predict seed vigor under the different heat durations. A total of 126 samples were randomly selected from the 168 seeds ofeach vigor level as the training set by cross-validation, and the remaining 42 were used as test sets. Modeling and analysis were carried out on different spectral data sets. Figure 8 is a comparison between the real and predicted categories of the test set based on partial data set modeling (original spectrum, SG second-order preprocessed spectrum, characteristic band extracted by LLE for the original spectrum, and characteristic band extracted by LLE for SG second-order pre-processed spectra).
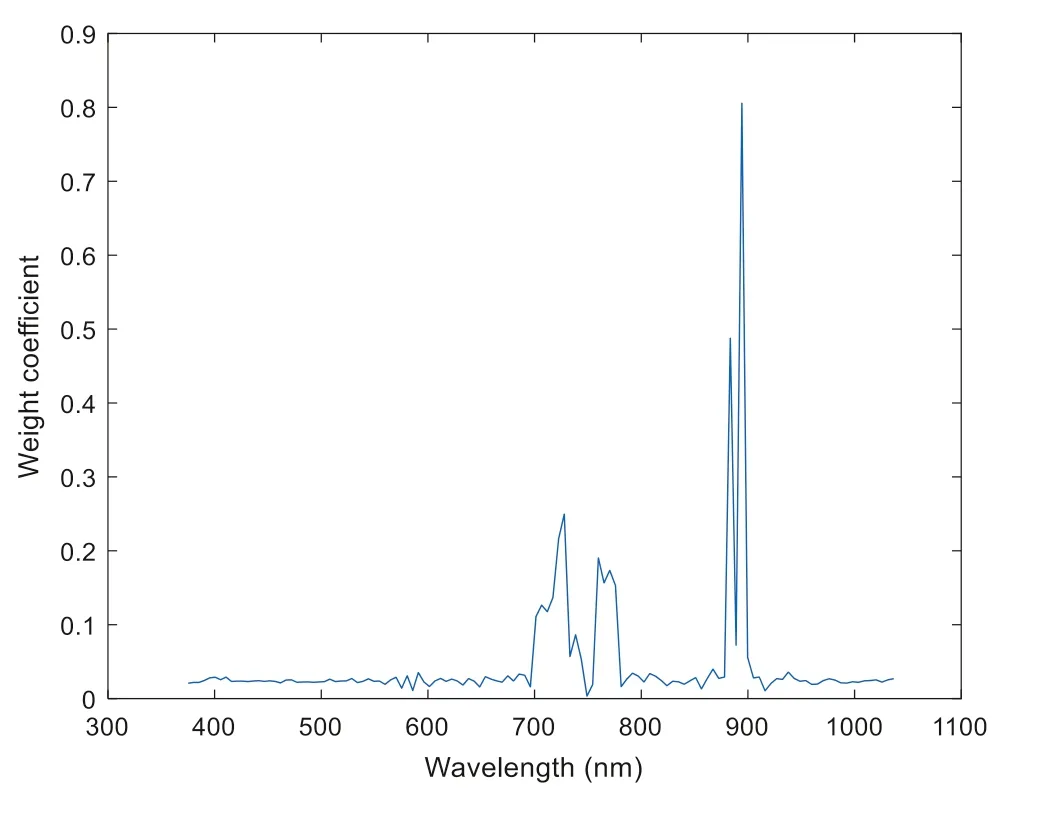
Fig.7 Weight coeffi cient graph after the local linear embedding (LLE) algorithm dimension reduction of the pre-processed spectra
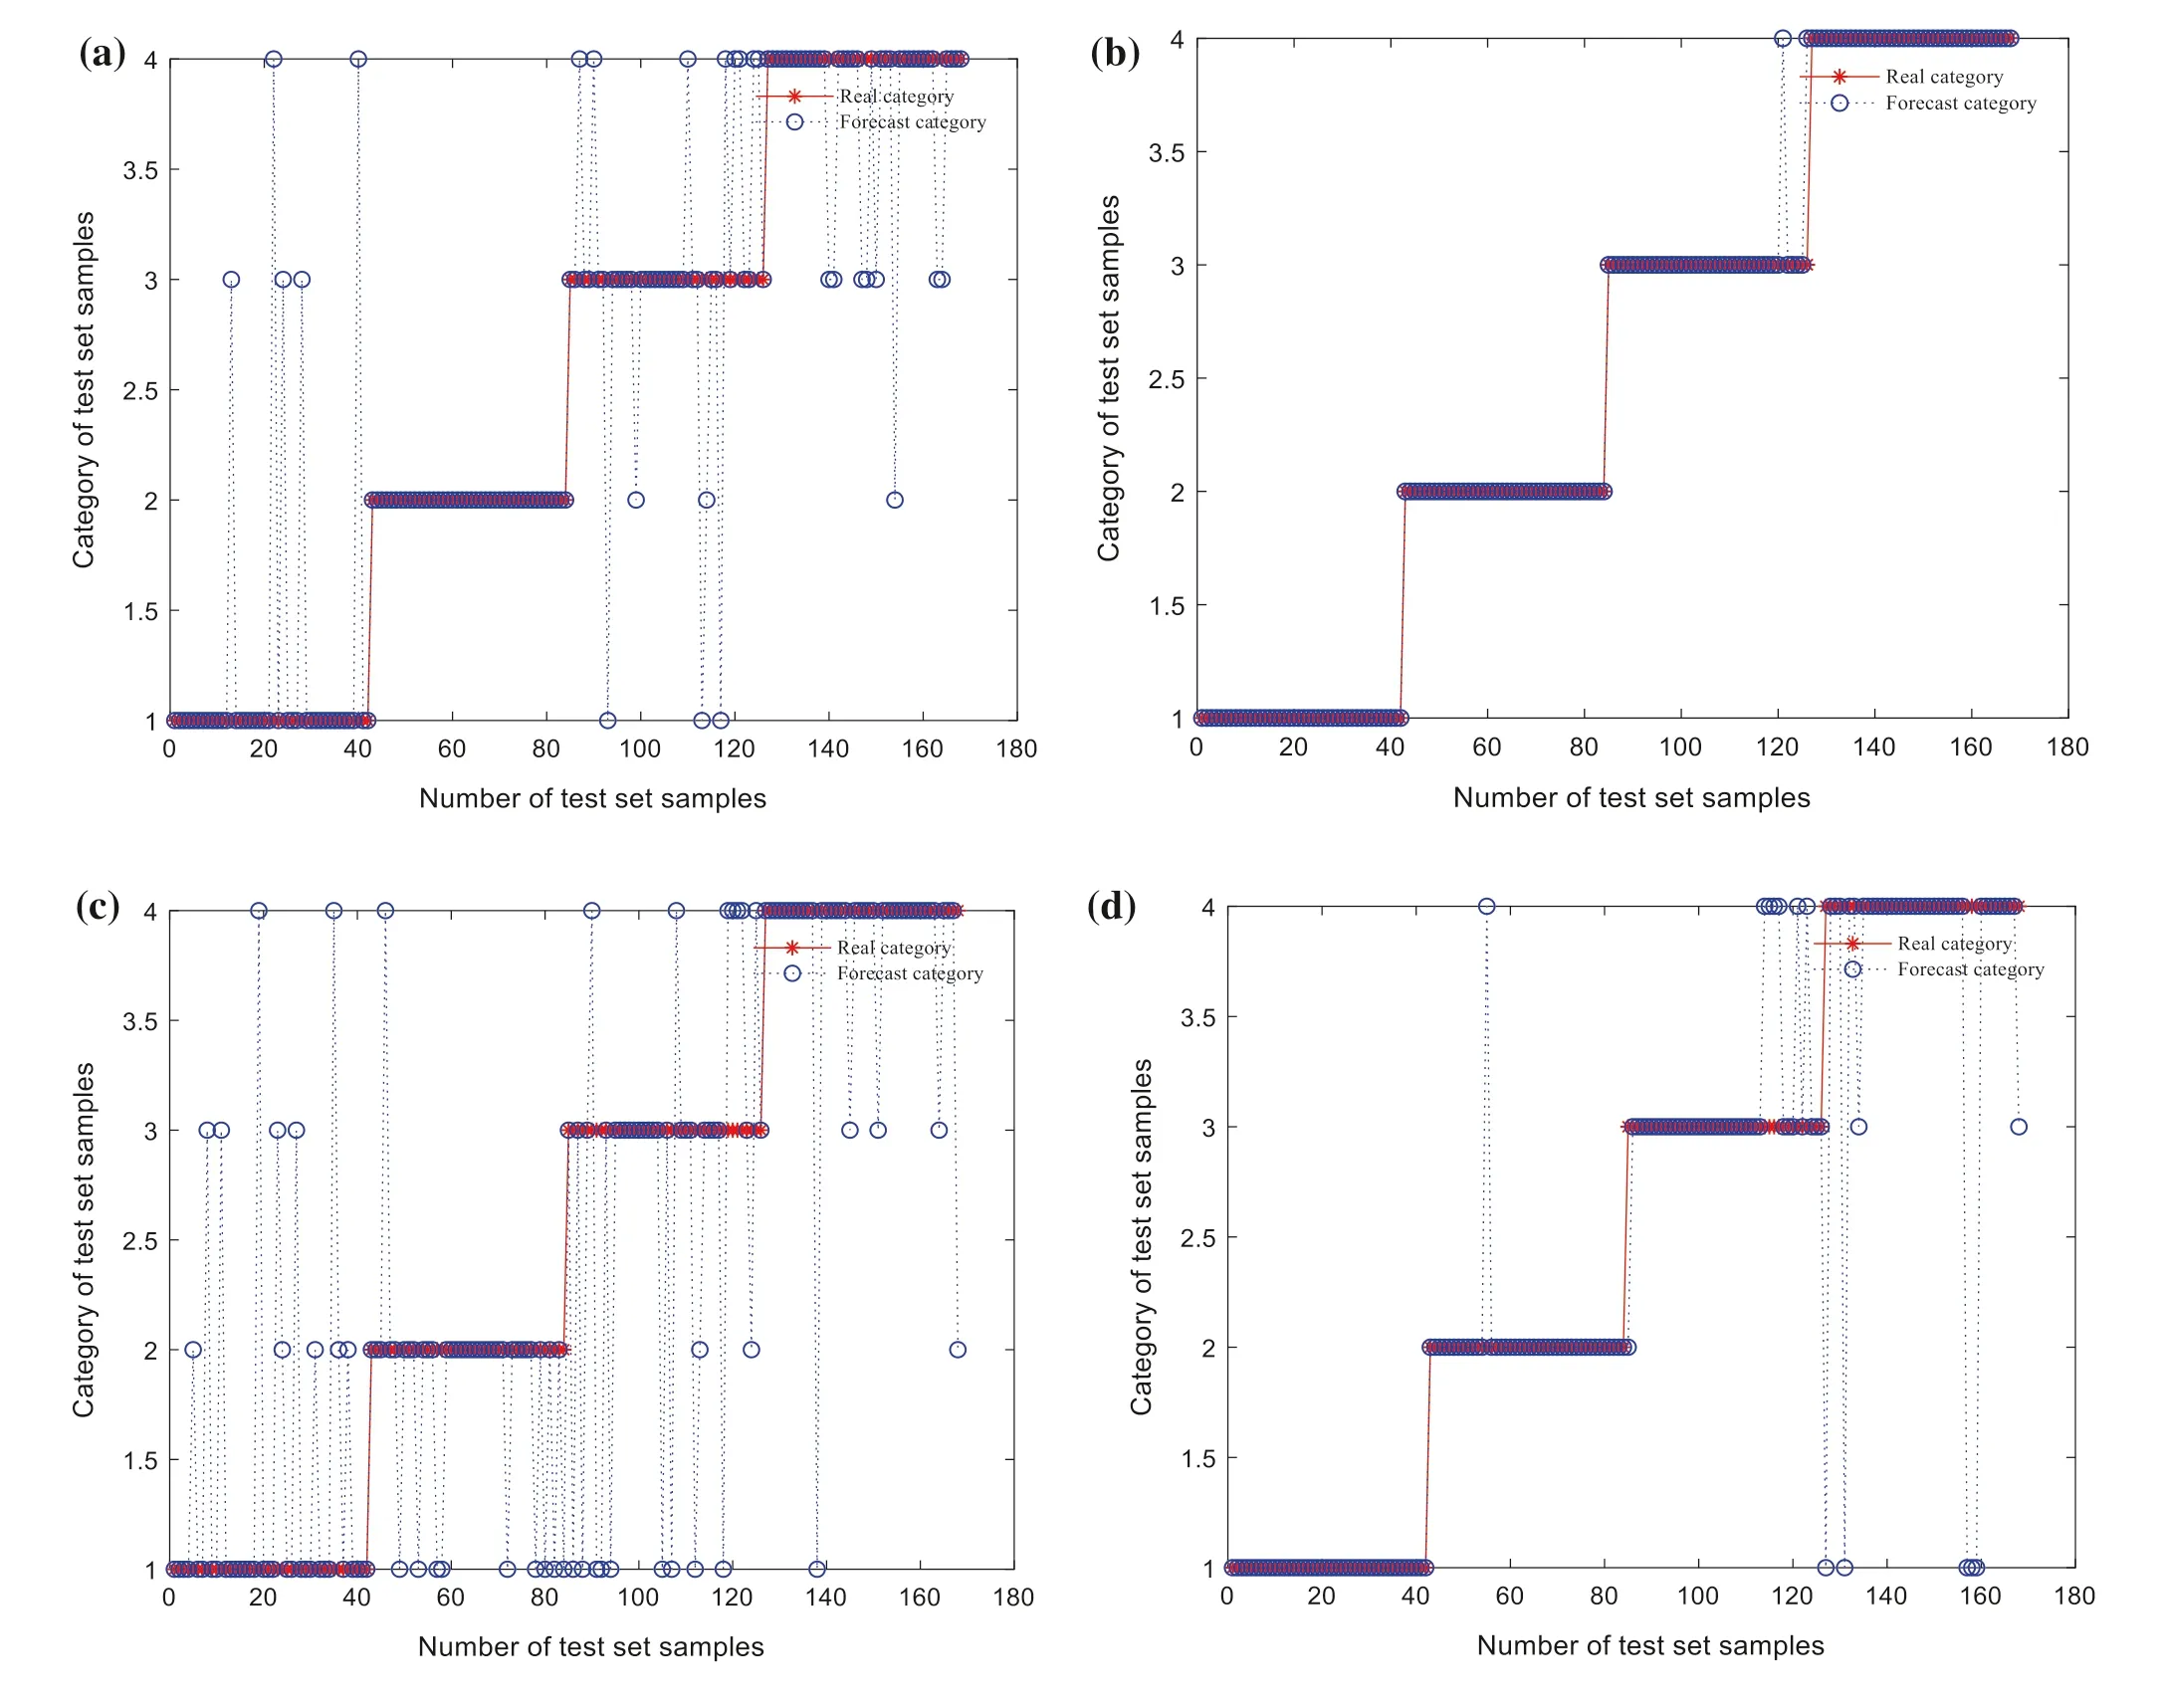
Fig.8 Partial least squares support vector machine (LS-SVM) modeling results using different spectral data prediction sets. a Original spectrum; b original spectrum after Savitzky–Golay (SG) secondorder pre-processing; c characteristic band extracted using the local linear embedding (LLE) algorithm for the original spectrum; d characteristic band extracted by LLE for the SG second-order pre-processed spectra
Table 3 displays the accuracy of the LS-SVM classification model in eight different spectral data sets. The training set was superior to the test set when modeling based on each spectral data set. Taking the test set accuracy as the criterion, the classification model of SG second derivative preprocessing without extracting the effective band combined with LS-SVM had the best effect, with an accuracy rate of 98.81%. The combination of pre-processed spectra and LLE achieved 91.07% accuracy with the minimum number of bands. Regardless of the original spectrum or the pretreated spectrum, the model recognition rate based on the entire band was the highest, but the overall calculation of the model was more complex. In addition, the spectral classification effect based on the SG second derivative was better than that based on the original spectrum, regardless of whether the feature was extracted or not. On the basis of the optimal model, seed pretreatment and hyperspectral data collection and pre-processing are indispensable for the dynamic prediction of a batch of new seeds. At this time, seed vigor level can be determined with high accuracy (98.81% in 128 bands and 96.43% in 14 bands) and thus estimate the germination rate according to Table 1 and nondestructively predict seed vigor.
Accuracy based on SPA extraction of a representative band was the highest followed by PCA, when LS-SVMwas used to classify Q. variabili s seeds after different durations of heat treatment. This phenomenon may be due to the fact that the characteristic band extracted by SPA has a large range in the visible and near-infrared bands. However, these three methods still have the problem of a decreased accuracy caused by the small number of bands representing all of the information.
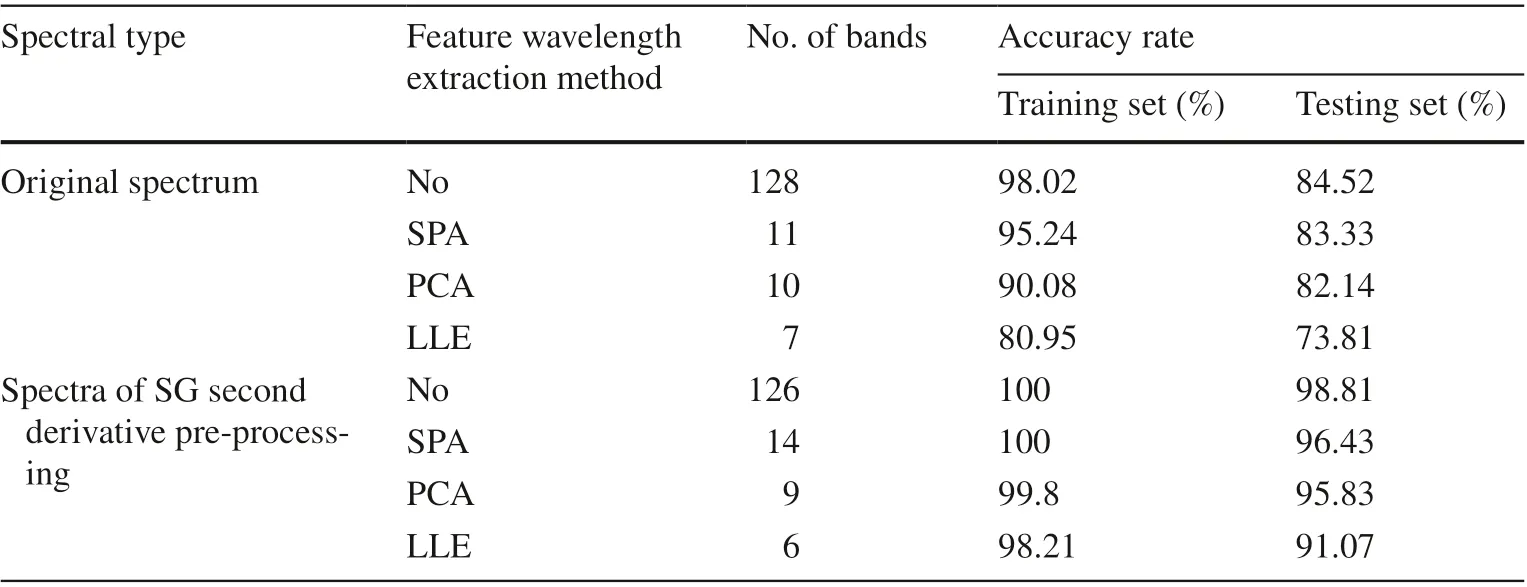
Table 3 Classification results of different seed grades for various spectral data sets using partial least squares support vector machine (LS-SVM)
Conclusion
Classification models for Q. variabilis seed vigor after different degrees of thermal damage were established based on hyperspectral image acquisition, pre-processing, feature wavelength selection, and classifier selection. After pre-processing, the accuracy of the spectral model was significantly improved, increasing from 84.52% to 99.4%. SPA, PCA, and LLE can achieve similar model performance with full band in fewer bands, which indicated that information utilization was improved.
In conclusion, hyperspectral imaging technology has great potential for accurately estimating the viability of heat-damaged Q. variabilis seeds. Pre-processing and feature band selection methods improves the accuracy of this new method to rapidly and accurately estimate seed vigor. The relationship between the near-infrared spectrum of the wider band and seed vigor now needs to be studied by combining chemical detection with spectral analysis and elucidate the relationship between chemical composition and the spectrum. In subsequent studies, Q. variabilis seeds from different years and regions will also be tested, and image information and fusion information of spectra and images will also be used.
AcknowledgementsProject funding: The work was funded by the National Natural Science Foundation of China (Grant No. 31770769), the National Key Research and Development Program of China (No. 2017YFC0504403) and the Fundamental Research Funds for the Central Universities (No. 2015ZCQ-GX-03).
References
Cheng JH, Jin HL, Liu ZW (2018) Developing a NIR multispectral imaging for prediction and visualization of peanut protein content using variable selection algorithms. Infrared Phys Technol 88:92–96
Diniz P, Pistonesi M, Alverez MB, Band BS, Araujo M (2015) Simplified tea classification based on a reduced chemical composition profile via successive projections algorithm linear discriminant analysis (SPA-LDA). J Food Compos Anal 39:103–110
Doherty B, Daveri A, Clementi C, Romani A, Bioletti S, Brunetti B, Sgamellotti A, Miliani C (2013) The Book of Kells: a noninvasive MOLAB investigation by complementary spectroscopic techniques. Spectrochim Acta A 115:330–336
Du MJ, Ding SF, Jia HJ (2016) Study on density peaks clustering based on k-nearest neighbors and principal component analysis. Knowl Based Syst 99:135–145
Dumont J, Nirvonen T, Heikkinen V, Mistretta M, Granlund L, Himanen K, Keinanen M (2015) Thermal and hyperspectral imaging for Norway spruce ( Picea abies) seeds screening. Comput Electron Agric 116:118–124
Guama JG, Linera GW (2006) Edge effect on acorn removal and oak seedling survival in Mexican lower montane forest fragments. New Forest 31:487–495
Guo DS, Zhu QB, Huang M, Guo Y, Qin JW (2017) Model updating for the classification of different varieties of maize seeds from different years by hyperspectral imaging coupled with a pre-labeling method. Comput Electron Agric 142:1–8
Hui GY, Sun LJ, Wang JN, Wang LK, Dai CJ (2016) Research on the pre-processing pethods of wheat hardness prediction model based on visible-near infrared spectroscopy. Spectrosc Spectr Anal 36(7):2111–2116
ISTA (2019) International rules for seed testing. International Seed Testing Association 2019
Lanzano L, Li S, Costanzo E, Gulino M, Scordino A, Tudisco S, Musumeci F (2009) Time-resolved spectral measurements of delayed luminescence from a single soybean seed: effects of thermal damage and correlation with germination performance. Luminescence 24(6):409–415
Lee H, Kim MS, Qin JW, Park E, Song YR, Oh CS, Cho BK (2017) Raman hyperspectral imaging for detection of watermelon seeds infected with Acidovorax citrulli. Sensors 17(10):2188–2198
Li XL, Wei YZ, Xu J, Feng XP, Xu FY, Zhou RQ, He Y (2018a) SSC and pH for sweet assessment and maturity classification of harvested cherry fruit based on NIR hyperspectral imaging technology. Postharvest Biol Technol 143:112–118
Li Z, Li C, Gao Y, Ma WG, Zheng YY, Niu YZ, Hu J (2018b) Identification ofoil, sugar and crude fiber during tobacco ( Nicotiana tabacum L.) seed development based on near infrared spectroscopy. Biomass Bioenerg 111:39–45
Lombardi T, Fochetti T, Bertacchi A, Onnis A (1997) Germination requirements in a population of Typha latifolia. Aquat Bot 56(1):1–10
McIvor RT, Humphreys PK (2000) A case-based reasoning approach to the make or buy decision. Integr Manuf Syst 11(5):295–310
Metsalu T, Vilo J (2015) ClustVis: a web tool for visualizing clustering of multivariate data using Principal Component Analysis and heatmap. Nucl Acids Res 43:566–570
Mo C, Kim K, Lee K, Kim MS, Cho BK, Lim J, Kang S (2014) Nondestructive quality evaluation of pepper ( Capsicum annuum L.) seeds using LED-induced hyperspectral reflectance imaging. Sensors 14(4):7489–7504
Nansen C, Zhao G, Darkin N, Zhao C, Turner SR (2015) Using hyperspectral imaging to determine germination of native Australian plant seeds. J Photochem Photobiol, B 145:19–24
Peng YK, Zhao F, Li L, Xing YY, Fang XQ (2018) Discrimination of heat-damaged tomato seeds based on near infrared spectroscopy and PCA-SVM method. Trans Chin Soc Agric Eng 34(5):159–165
Polyansky O, Zobov F, Viti S, Tennyson J (1998) Water vapor line assignments in the nearinfrared. J Mol Spectrosc 189(2):291–300
Qiu GJ, Lü E, Lu HZ, Xu S, Zeng FG, Shui Q (2018) Single-Kernel FT-NIR spectroscopy for detecting supersweet corn ( Zea mays L. Saccharata Sturt) seed viability with multivariate data analysis. Sensors 18(4):1010–1025
Ringsted T, Ramsay JS, Jespersen BM, Keiding SR, Engelsen SB (2017) Long wavelength near-infrared transmission spectroscopy of barley seeds using a supercontinuum laser: prediction of mixedlinkage betaglucan content. Anal Chim Acta 986:101–108
Rinnan A, Berg F, Engelsen SB (2009) Review of the most common pre-processing techniques for near-infrared spectra. Trac Trend Anal Chem 28(10):1201–1222
Roweis ST, Saul LK (2000) Nonlinear dimensionality reduction by locally linear embedding. Science 290(5500):2323–2326
Shetty N, Min TG, Gislum R, Olesen MH, Boelt B (2011) Optimal sample size for predicting viability of cabbage and radish seeds based on near infrared spectra of single seeds. J Near Infrared Spectrosc 19(6):451–462
Sun Y, Gu XZ, Sun K, Hu HJ, Xu M, Wang ZJ, Pan LQ (2017) Hyperspectral reflectance imaging combined with chemometrics and successive projections algorithm for chilling injury classification in peaches. LWT Food Sci Technol 75:557–564
Wakholi C, Kandpal LM, Lee H, Hyungjin B, Park E, Kim ME, Cho BK (2018) Rapid assessment of corn seed viability using short wave infrared line-scan hyperspectral imaging and chemometrics. Sens Actuators B Chem 255:498–507
Wang L, Sun DW, Pu HB, Zhu ZW (2016) Application of hyperspectral imaging to discriminate the variety of maize seeds. Food Anal Methods 9:225–234
Yamatera H, Gondon G, Fitzpatrick B (1964) Near-infrared spectral of water and aqueous solutions. J Mol Spectrosc 14(3):268–278
Yang S, Zhu QB, Huang M, Qin JW (2017) Hyperspectral image-based variety discrimination of maize seeds by using a multi-model strategy coupled with unsupervised joint skewness-based wavelength selection algorithm. Food Anal Methods 10(2):424–433
Yang XL, Hong HM, You ZH, Cheng F (2015) Spectral and image integrated analysis of hyperspectral data for waxy corn seed variety classification. Sensors 15(7):15578–15594
Zhang TT, Wei WS, Zhao B, Wang RR, Li ML, Yang LM, Wang JH, Sun Q (2018) A reliable methodology for determining seed viability by using hyperspectral data from two sides of wheat seeds. Sensors 18(3):813–825
Zhou JY, Lin J, He JF, Zhang WH (2010) Review and perspective on Quercus variabilis research. J Northwest For Univ 25(3):43–49
 Journal of Forestry Research2021年2期
- Journal of Forestry Research的其它文章
- Stem taper functions for Betula platyphylla in the Daxing’an Mountains, northeast China
- Leaf phenotypic variation of endangered plant Tetracentron sinense Oliv. and influence of geographical and climatic factors
- Ecological variations of woody species along an altitudinal gradient in the Qinling Mountains of Central China: area-based versus mass-based expression of leaf traits
- Variations in stem radii of Larix principis-rupprechtii to environmental factors at two slope locations in the Liupan Mountains, northwest China
- A review of ecological mechanisms for management practices of protective forests
- Variation of basic density, calorific value and volumetric shrinkage within tree height and tree age of Ugandan grown Eucalyptus grandis wood
