Applications of Metabolomics:Cancer Metabolism,Nanotoxicity and Biomarker Discovery
HU Shen*
(School of Dentistry and Jonsson Comprehensive Cancer Center,University of California,Los Angeles,California,90095,USA)
Abstract:Metabolomics refers to a systematic analysis and study of the small molecule metabolites present in a biological system,e.g.,a specific type of cell,tissue,organ,biofluid,or organism.Since metabolites are closely linked to the phenotype,metabolomics can be used for numerous biomedical applications,such as discovery of clinically useful biomarkers,identification of metabolic enzyme targets for therapeutics,understanding of metabolic mechanisms in diseases,determination of gene function,and metabolic phenotyping.In this review article,I have summarized our recent progress on using metabolomics to study cancer metabolism,nanotoxicity and biomarker discovery.
Keywords:Metabolomics;Cancer metabolomics;Nanotoxicity;Disease biomarkers;Gout
1 Introduction
Metabolomics is a powerful analytical methodology for systematic study of small molecule metabolites present in a biological system.Metabolites are the end products of cellular processes.Therefore,metabolomic profiling can precisely reflect the phenotype and activity of cellular metabolism in the context of physiological stimuli or disease states.Due to the complexity of a metabolomic sample,metabolomic analysis often requires a high-throughput technology such as liquid chromatography with mass spectrometry (LC-MS),gas chroma-tography with mass spectrometry (GC-MS),capillary electrophoresis with mass spectrometry (CE-MS) or nuclear magnetic resonance(NMR) spectroscopy to analyze and identify a large array of metabolites[1].With the substantial evolvement of these analytical technologies in the past twenty years,metabolomics has now become a powerful tool for biomedical research and been widely used to discover metabolite biomarkers for clinical applications,understand pathogenic mechanisms of human diseases,and identify druggable targets for disease treatment.
Professor Jieke Cheng (程介克) was my mentor when I was a PhD student at Wuhan University.The training that I received in his laboratory and from the Chemistry Department of Wuhan University had profound impact on my academic career.As a newly graduated college student in his laboratory more than twenty years ago,I had very limited access to chemistry literature especially those from foreign countries,and therefore very little knowledge about the frontier research in Bioanalytical Chemistry.Professor Cheng was so far-sighted and had always brought us the most innovative concepts and methodologies,which clearly broadened our view of Analytical Chemistry research.At that time,we were lack of resources in the laboratory.However,it did not prevent him from encouraging us to chase the most innovative research such as single cell analysis,capillary electrophoresis,nanoelectrochemistry,ultrasensitive chemiluminescence and microfluidics.In 1993,he chaired the First International Conference on Analytical Chemistry for Chinese Scholars and many renown analytical chemists,including those from the United States,attended the meeting to share the most frontier research in the field.To this date,I remember vividly that,in 1995,I attended the Second International Conference on Analytical Chemistry for Chinese Scholars in Shenzhen with Professor Cheng,and he arranged the pleasant trip to Zhuhai to visit a high-tech company.Due to my trainings in capillary electrophoresis and single cell analysis,I had the great opportunity after my graduation to work as a research scientist at the City University of Hong Kong with Professor Paul Li and in the University of Alberta and University of Washington with Professor Norman Dovichi.Same as Professor Cheng,Norm and Paul are great mentors to me and fully support my career development.Looking back,my academic career was certainly boosted by the in-depth trainings in Analytical Chemistry and Separation Science that I received as an undergraduate student and then a PhD student in Wuhan.Over the years,those initial studies and lab experiences have significantly contributed to my research activities in single cell proteomics,body fluid proteomics,biomarker discovery,metabolomics and cancer biology.To celebrate Professor Cheng’s 90thanniversary as an academician,here I write a brief overview about some of the recent research in my laboratory at the University of California,Los Angeles (UCLA).Particularly,I will introduce both global and targeted metabolomics platforms and their applications to studying cancer metabolism,biomarker discovery and nanotoxicity.
2 Cancer metabolomics
Metabolomics has emerged as a powerful analytical methodology for studying metabolic pathways,gene networks and systems biology.With the newly evolved MS and NMR methods,metabolomics has now become a valuable approach for screening novel biomarkers for cancer diagnosis,prognosis,or monitoring of treatment efficacy.Meanwhile,metabolomic applications have led to the discovery of critical target genes regulating cancer metabolism and/or serving as the targets for therapeutic interventions[1].In addition,metabolomics can be combined with transcriptomics such as RNA Sequencing for a systems biology analysis to narrow down significant metabolic pathways in cancer metabolism (Fig.1).
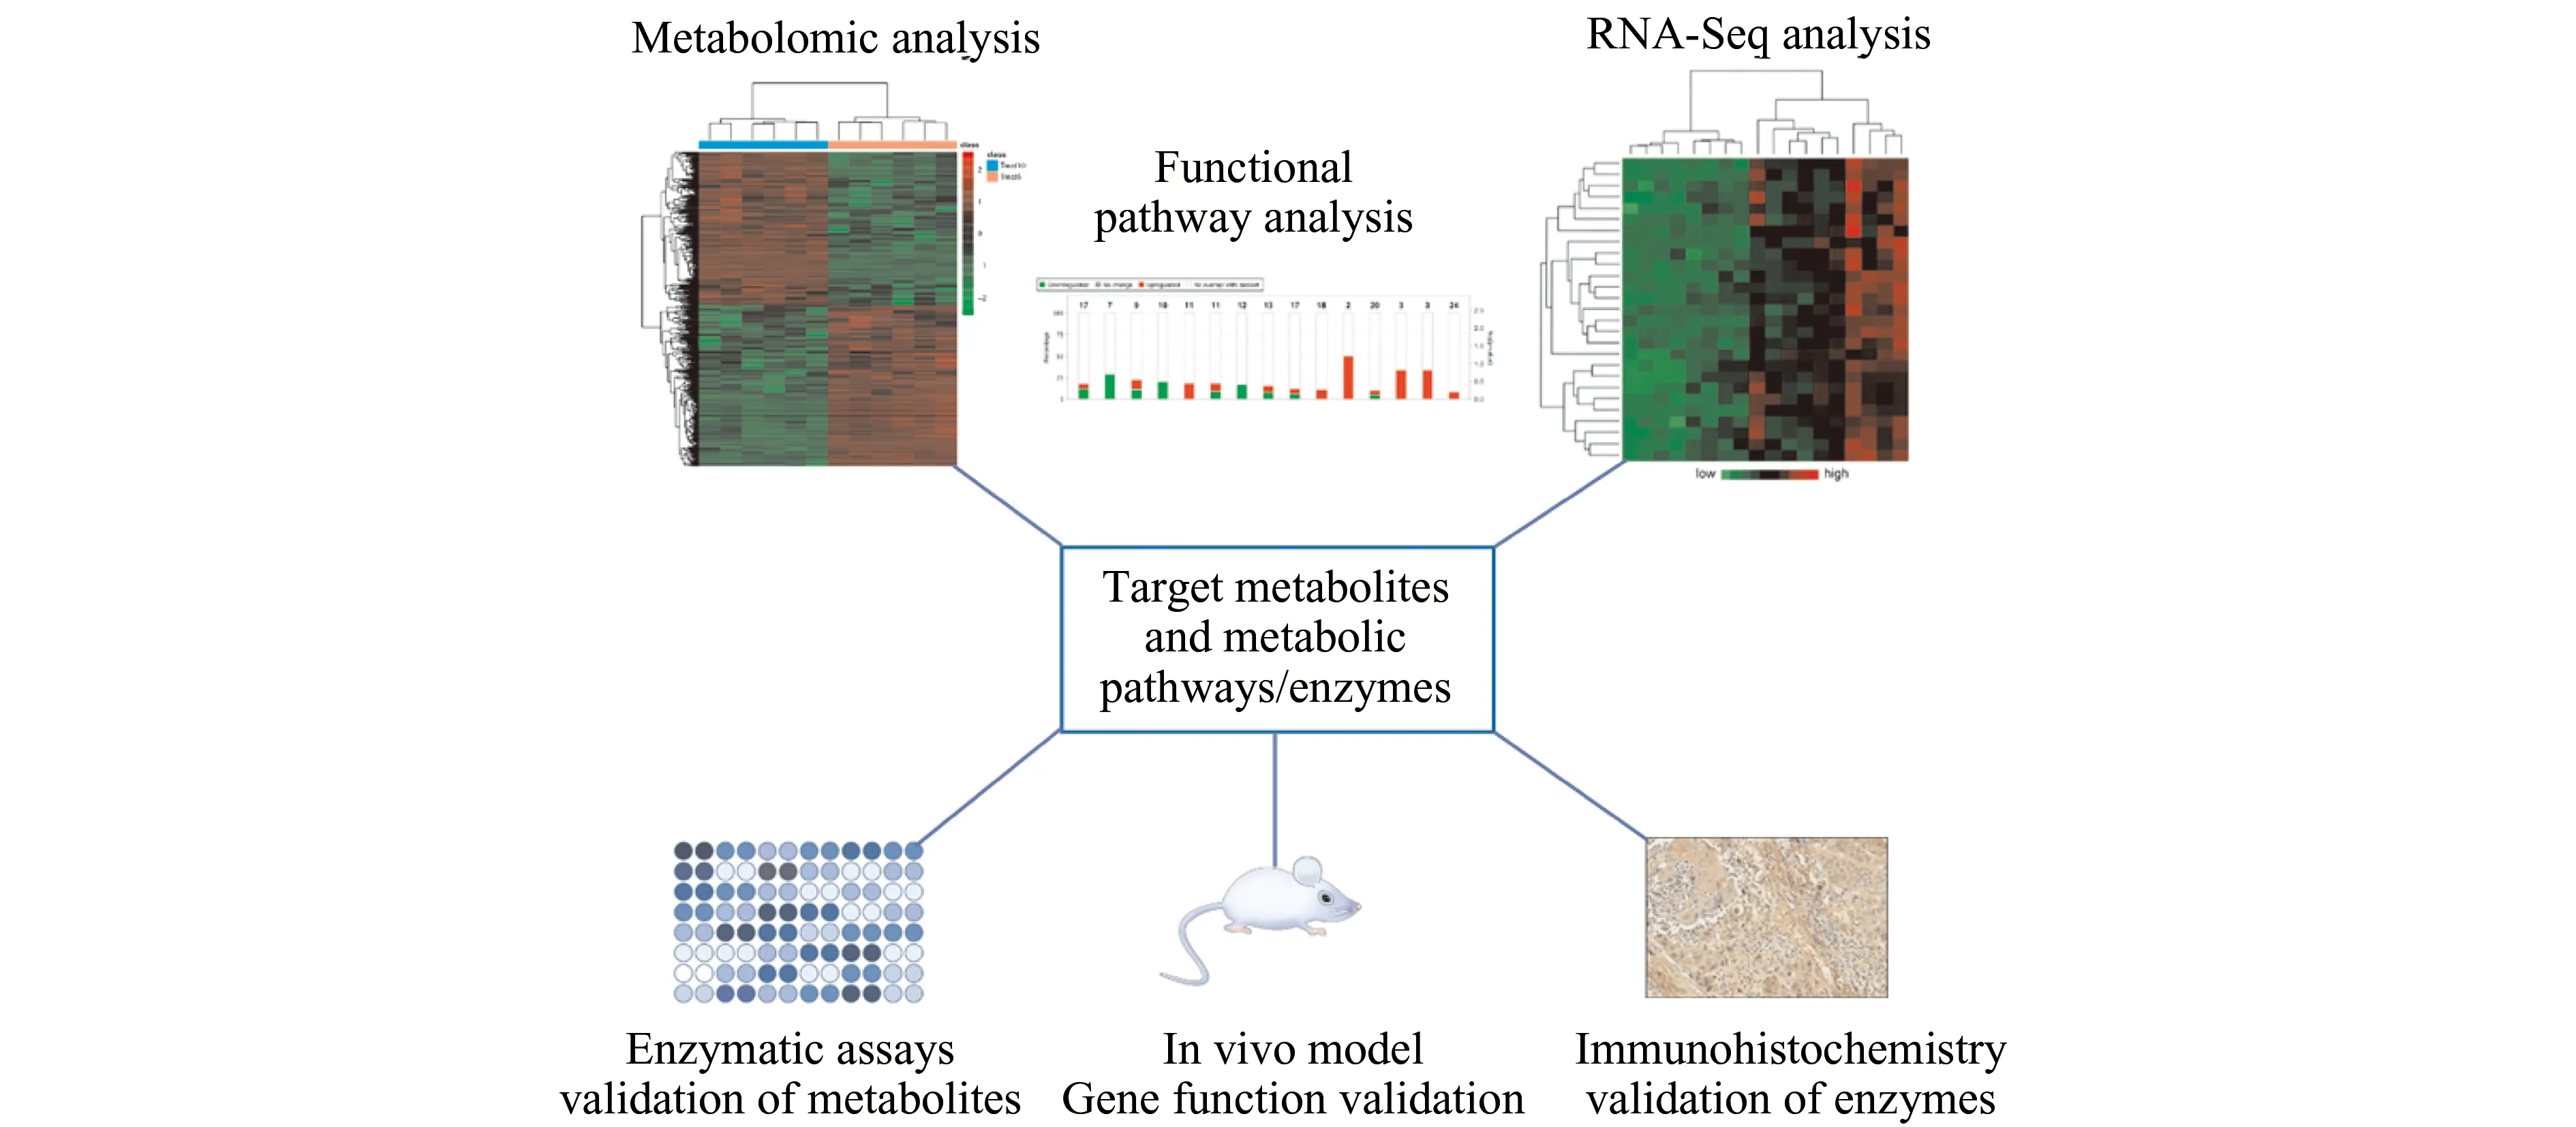
Fig.1 A systems biology analysis of cancer metabolism.Metabolomic and transcriptomic (RNA-Seq) analyses of cancer/normal tissues,followed by functional pathway analysis,can be combined to elucidate the significantly altered metabolic pathways and related metabolites/metabolic enzymes.The identified metabolites can be further validated with enzymatic assays whereas the identified metabolic pathway genes (metabolite enzymes) can be further validated with immunohistochemistry.Meanwhile,the metabolic enzymes’ function can be verified with in vivo animal models to determine if the metabolite enzymes promote or suppress cancer development or progression.Successfully validated metabolites may serve as diagnostic or prognostic biomarkers while the validated enzyme genes may serve as therapeutic targets for cancer treatment.
Due to the highly complex nature and a large array of compounds in a metabolomic sample,separation science plays a critical role in metabolomics in order to achieve a comprehensive profiling analysis of the metabolites.The strength of MS-based metabolomics is best realized when coupled with a separation technique,such as CE,GC or LC.Ion chromatography (IC) or ion-exchange chromatography (IEC) is a form of LC suitable for metabolite analysis because it allows the separation of ions and polar molecules based on their charge.There are two types of IC,cation exchange chromatography (CEC) and anion exchange chromatography (AEC),depending on the analytes’ surface charge.CEC is used when the analytes of interest are positively charged,and the separation is based on the interaction between positively charged analytes and negatively charged stationary phase.On the contrary,a positively charged stationary phase is used in AEC for the separation of negatively charged analytes.In fact,IC has quite high matrix tolerance and allows selective analysis of ionic analytes from a complex metabolomic sample.Another advantage of IC lies in its predictability of elution patterns based on the presence of charged groups on the analyte surface.For instance,when AEC is used,negatively charged molecules will be eluted out last and the positive charged molecules will be eluted out first,and vice versa when CEC is used.In addition,commercial IC columns are highly robust and can be flexible with high or low capacity depending on the analytical needs[11].
IC is traditionally used for the separation of small inorganic ions.Due to a recent development of eluent suppression technology that allows continuous desalting and conversion of high-salt eluents into pure water,online coupling of IC with MS has been successful for analysis of metabolites such as carbohydrates,organic acids,sugar phosphates,and nucleotides in biological samples.We have recently demonstrated a highly sensitive capillary IC-MS (capIC-MS) method for metabolic profiling of head and neck squamous cell carcinoma (HNSCC) cells.The capIC allowed an exquisite separation of anionic polar metabolites (Fig.2A),and the sensitivities increased by up to 100-fold when compared to reversed-phase LC (RPLC) or hydrophilic interaction liquid chromatography (HILIC).The detection limits for a panel of standard metabolites were determined within a range of 0.04 to 0.5 nmol/L (0.2 to 3.4 fmol).This method was applied to an untargeted metabolomic analysis of HNSCC cells and stem-like cancer cells,and more than 4000 metabolites could be quantified with a single analysis (Fig.2B).Due to the high resolution of IC and MS,isobaric metabolites such as 11 sugar monophosphates were well resolved.Differential metabolomic analysis identified significant changes in energy metabolism pathways such as glycolysis and tricarboxylic acid cycle between cancer stem cells and non-stem cancer cells (Fig.2C).Our study indicates that capIC-MS is a powerful metabolomics tool by providing enhanced separation,reproducibility and sensitivity for analysis of polar metabolites[7].
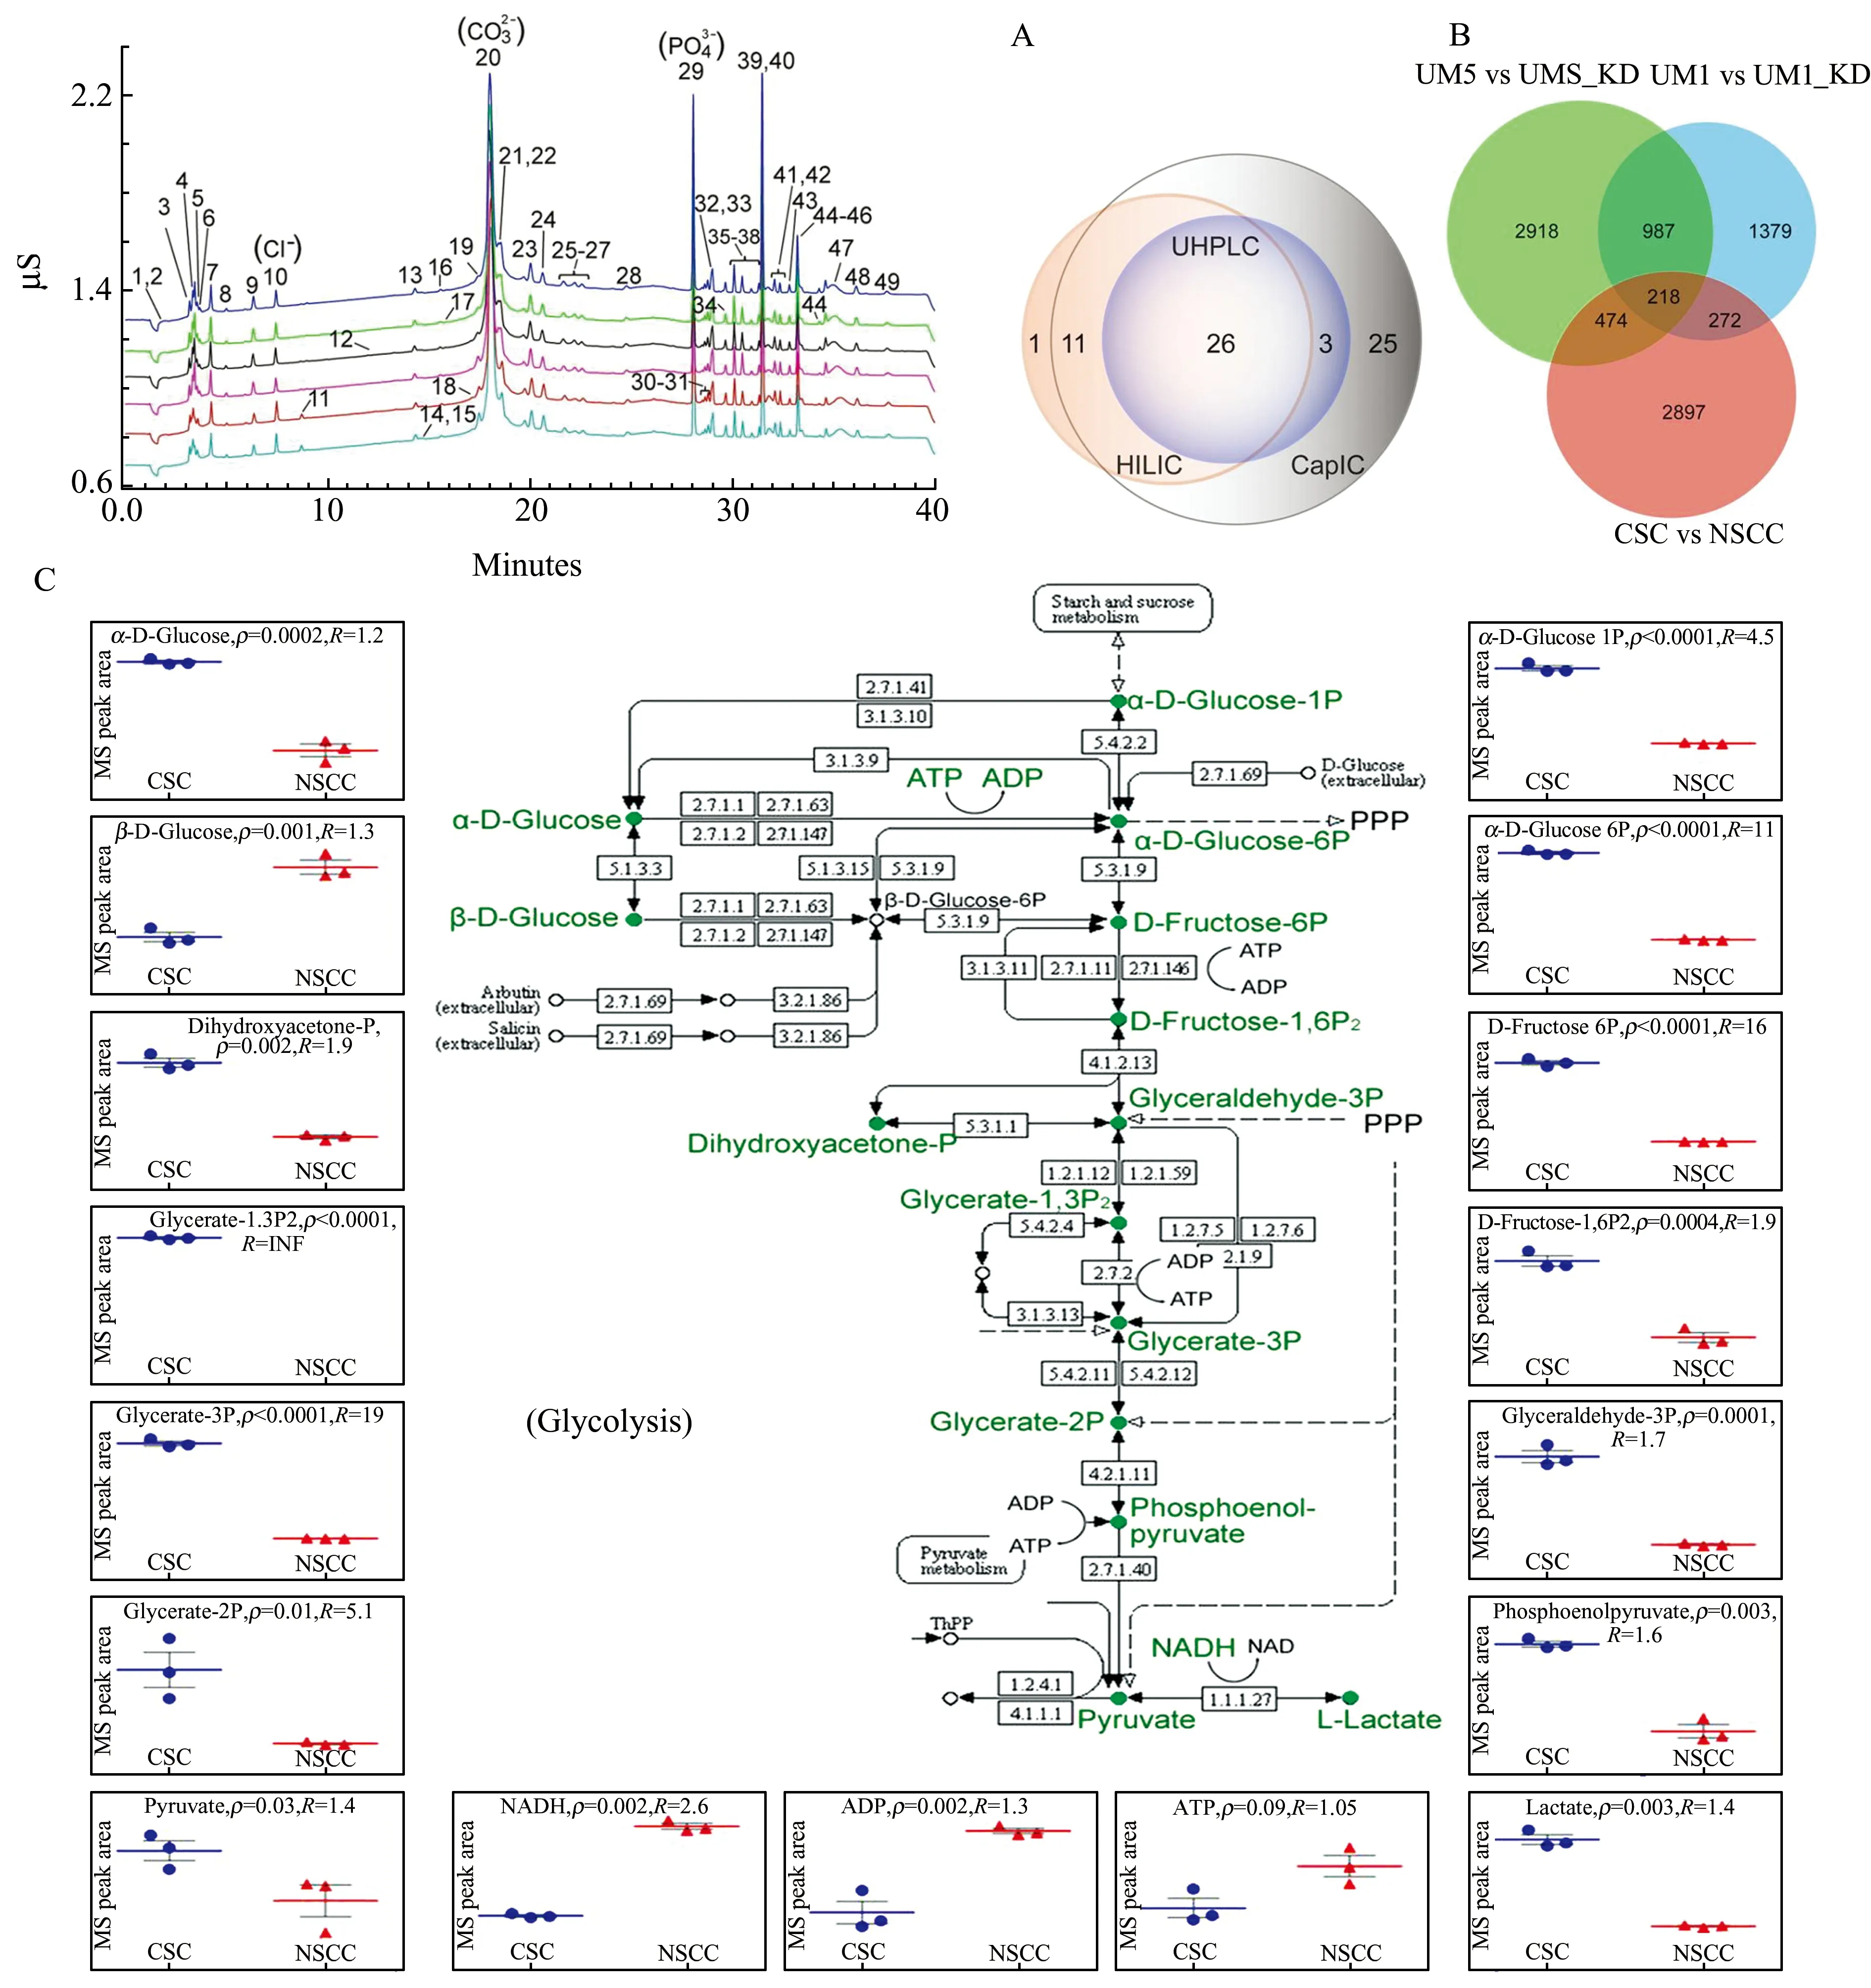
Fig.2 Capillary IC with MS for metabolic profiling of cancer cells.(A) Interday reproducibility analysis of the metabolite standards at 600 ppb by capIC with conductive detection (n=6).Peaks:(1) d-Glucose;(2) d-arabinose;(3) mevalonate;(4) lactate;(5) shikimate;(6) acetoacetate;(7) pyruvate;(8) malate;(9) uridine;(10) chloride;(11) nitrite;(12) glucose 1-phosphate;(13) cAMP;(14) methylmalonate;(15) succinate;(16) tartrate;(17) malonate;(18) 2-oxoglutarate;(19) fructose 6-phosphate;(20) carbonate;(21) maleate;(22) d-glucose-6-phosphate;(23) ribose-5-phosphate;(24) AMP;(25-27) unknown;(28) sulfate;(29) phosphate;(30) citrate;(31) isocitrate;(32) cis-aconitate;(33) phosphoenolpyruvate;(34) trans-aconitate;(35) ribulose-5-phosphate;(36) d-fructose-1,6-diphosphate;(37) cGMP;(38) d-fructose-2,6-diphosphate;(39) IMP;(40) dihydroxy acetone-phosphate;(41) CTP;(42) ADP;(43) 5-phosphoribosyl-1-diphosphate;(44) ATP;(45) GTP;(46) dGTP;(47) GDP;(48-49) unknown.RSDs of intensity were 5.5%,7.8%,and 6.0% and RSDs of RT were 6.5%,8%,and 7.2%,respectively,for the three inorganic ions chloride,carbonate,and phosphate coexisting in the sample solution.(B) The number of quantified metabolites between cancer stem cells (CSCs) and non-stem cancer cells (NSCCs),as well as between HNSCC cells with sox11 knockdown (UM1_KD and UM5_KD) and control HNSCC cells (UM1 and UM5).(C) Capillary IC with MS analysis revealed metabolic changes of the glycolysis pathway between oral CSCs and NSCCs.p:p-value;R:fold change.Reproduced with permission[7].
We have also developed a targeted metabolomics method,by using IC-MS and stable isotope labeled internal standards,for quantitative analysis of metabolites in a specific metabolic pathway in cancer cells.Briefly,heavy isotope labeled metabolites at a serial of diluted concentrations are spiked into the metabolomic samples as internal standards and IC-MS is used to profile the metabolites,including the spiked internal metabolite standards and the unlabeled counterparts.The targeted metabolites are then absolutely quantifiedviathe normalization to the spiked internal standards.In addition to targeted metabolomic data,the analysis also produces global metabolomics data simultaneously that can be used for differential metabolomics and functional metabolic pathway analysis.Our method offers great technical advantages for metabolite analysis,including exquisite sensitivity,high speed and reproducibility,and wide dynamic range.We have applied this method to the quantification of pyruvate and TCA cycle metabolites in HNSCC cancer cells and discover distinct metabolic phenotypes between high and low invasive head and neck cancer cells and between CSCs and NSCCs[8].Fig.3 illustrates the absolute levels of pyruvate and 5 TCA cycle intermediates among highly invasive UM1 and UMSCC5 and low invasive UM2 and UMSCC6 cancer cells by using the targeted metabolomic analysis.The expression levels of these metabolites were found to be exceptionally higher in the UMSCC5 cancer cell line,which displays exuberant metabolism,than the other three cancer cell lines.
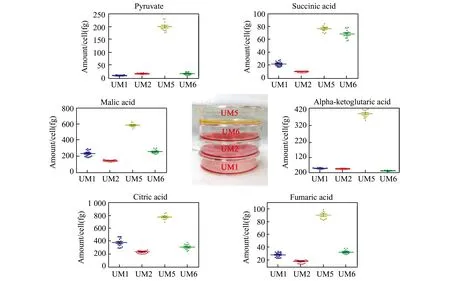
Fig.3 Quantitative analysis of the 6 targeted metabolites in head and neck cancer cells by ion chromatography with mass spectrometry and isotope labeled internal standards.The production of these metabolites in UM5 cancer cells is significantly higher than other cell lines.Inserted are the cultures of all 4 cell lines.Equal number of cells were initially plated and cultured for the same amount of time.Due to more aggressive metabolism in UM5 cancer cells,more lactate is produced and released that causes the lower pH of the culture medium.Reproduced with permission[8].
We have recently conducted both metabolomic and transcriptomic analyses of head and neck cancer tissues from a large number of cancer patients and discovered novel metabolic target genes in the folate cycle,fatty oxidation,sterol biosynthesis and hypoxia signaling pathways.Testing of the small molecular inhibitors targeting these genes are underway,which may lead to therapeutic intervention in human cancers.
3 Discovery of metabolite biomarkerswith metabolomics
Gout is a common form of inflammatory arthritis and the detailed pathogenic mechanisms for this metabolic disorder remain largely unknown.Using a similar capIC-MS method,we have profiled the salivary metabolites in 8 patients with gout,15 patients with hyperuricaemia (HUA),and 15 healthy individuals (Fig.4).In total,13240 metabolic features were found to be present in the participants of three study groups.As shown in Fig.1,capIC-MS/MS allows to detect 3158 significantly changed (pvalue <0.05,ratio>2) metabolic features (1299 down-regulated and 1859 up-regulated) between gout and HUA patients,and 5551 significantly altered metabolic features (2225 down-regulated and 3326 up-regulated) between gout patients and healthy controls,and 803 significantly changed metabolic features (341 down-regulated and 462 up-regulated) between HUA patients and healthy controls,respectively.All the identified metabolites with significant changes between HUA and healthy control groups were also significantly altered between gout and control groups.Forty-nine salivary metabolites were found to be significantly changed between gout patient and healthy control groups,and 26 salivary metabolites were significantly different between gout and HUA patient groups.Among the 26 significantly changed salivary metabolites between gout and HUA patients,24 of them were also significantly changed between gout patients and healthy controls.Three metabolite biomarkers,uric acid,oxalic acid,and l-homocysteic acid (HCA),were chosen for further validation using enzymatic assays in the saliva samples of 30 patients with gout,30 patients with HUA,and 30 healthy control subjects.Salivary uric acid and oxalic acid levels were found to be significantly higher in the patients with gout than the healthy controls,whereas salivary HCA level was significantly higher in the gout patients than both HUA patients and healthy controls.These assay measurements were in line with those obtained by cap IC-MS/MS.Receiver operating characteristic (ROC) analysis indicated that the three metabolites could discriminate gout patients from HUA patients with an AUC (area under the curve) value of 0.887,and the specificity and sensitivity were 73.30% and 93.30%,respectively.In addition,a combination of the three metabolite biomarkers could completely distinguish the patients with gout from the healthy controls.Our studies have demonstrated that capIC-MS is a valuable method for the identification of the dysregulated metabolites in the patients with gout or HUA.The identified metabolites not only include classic diagnostic biomarkers of gout and HUA,but also encompass a set of novel metabolite targets that might be associated with the disease progression of HUA and gout[12].
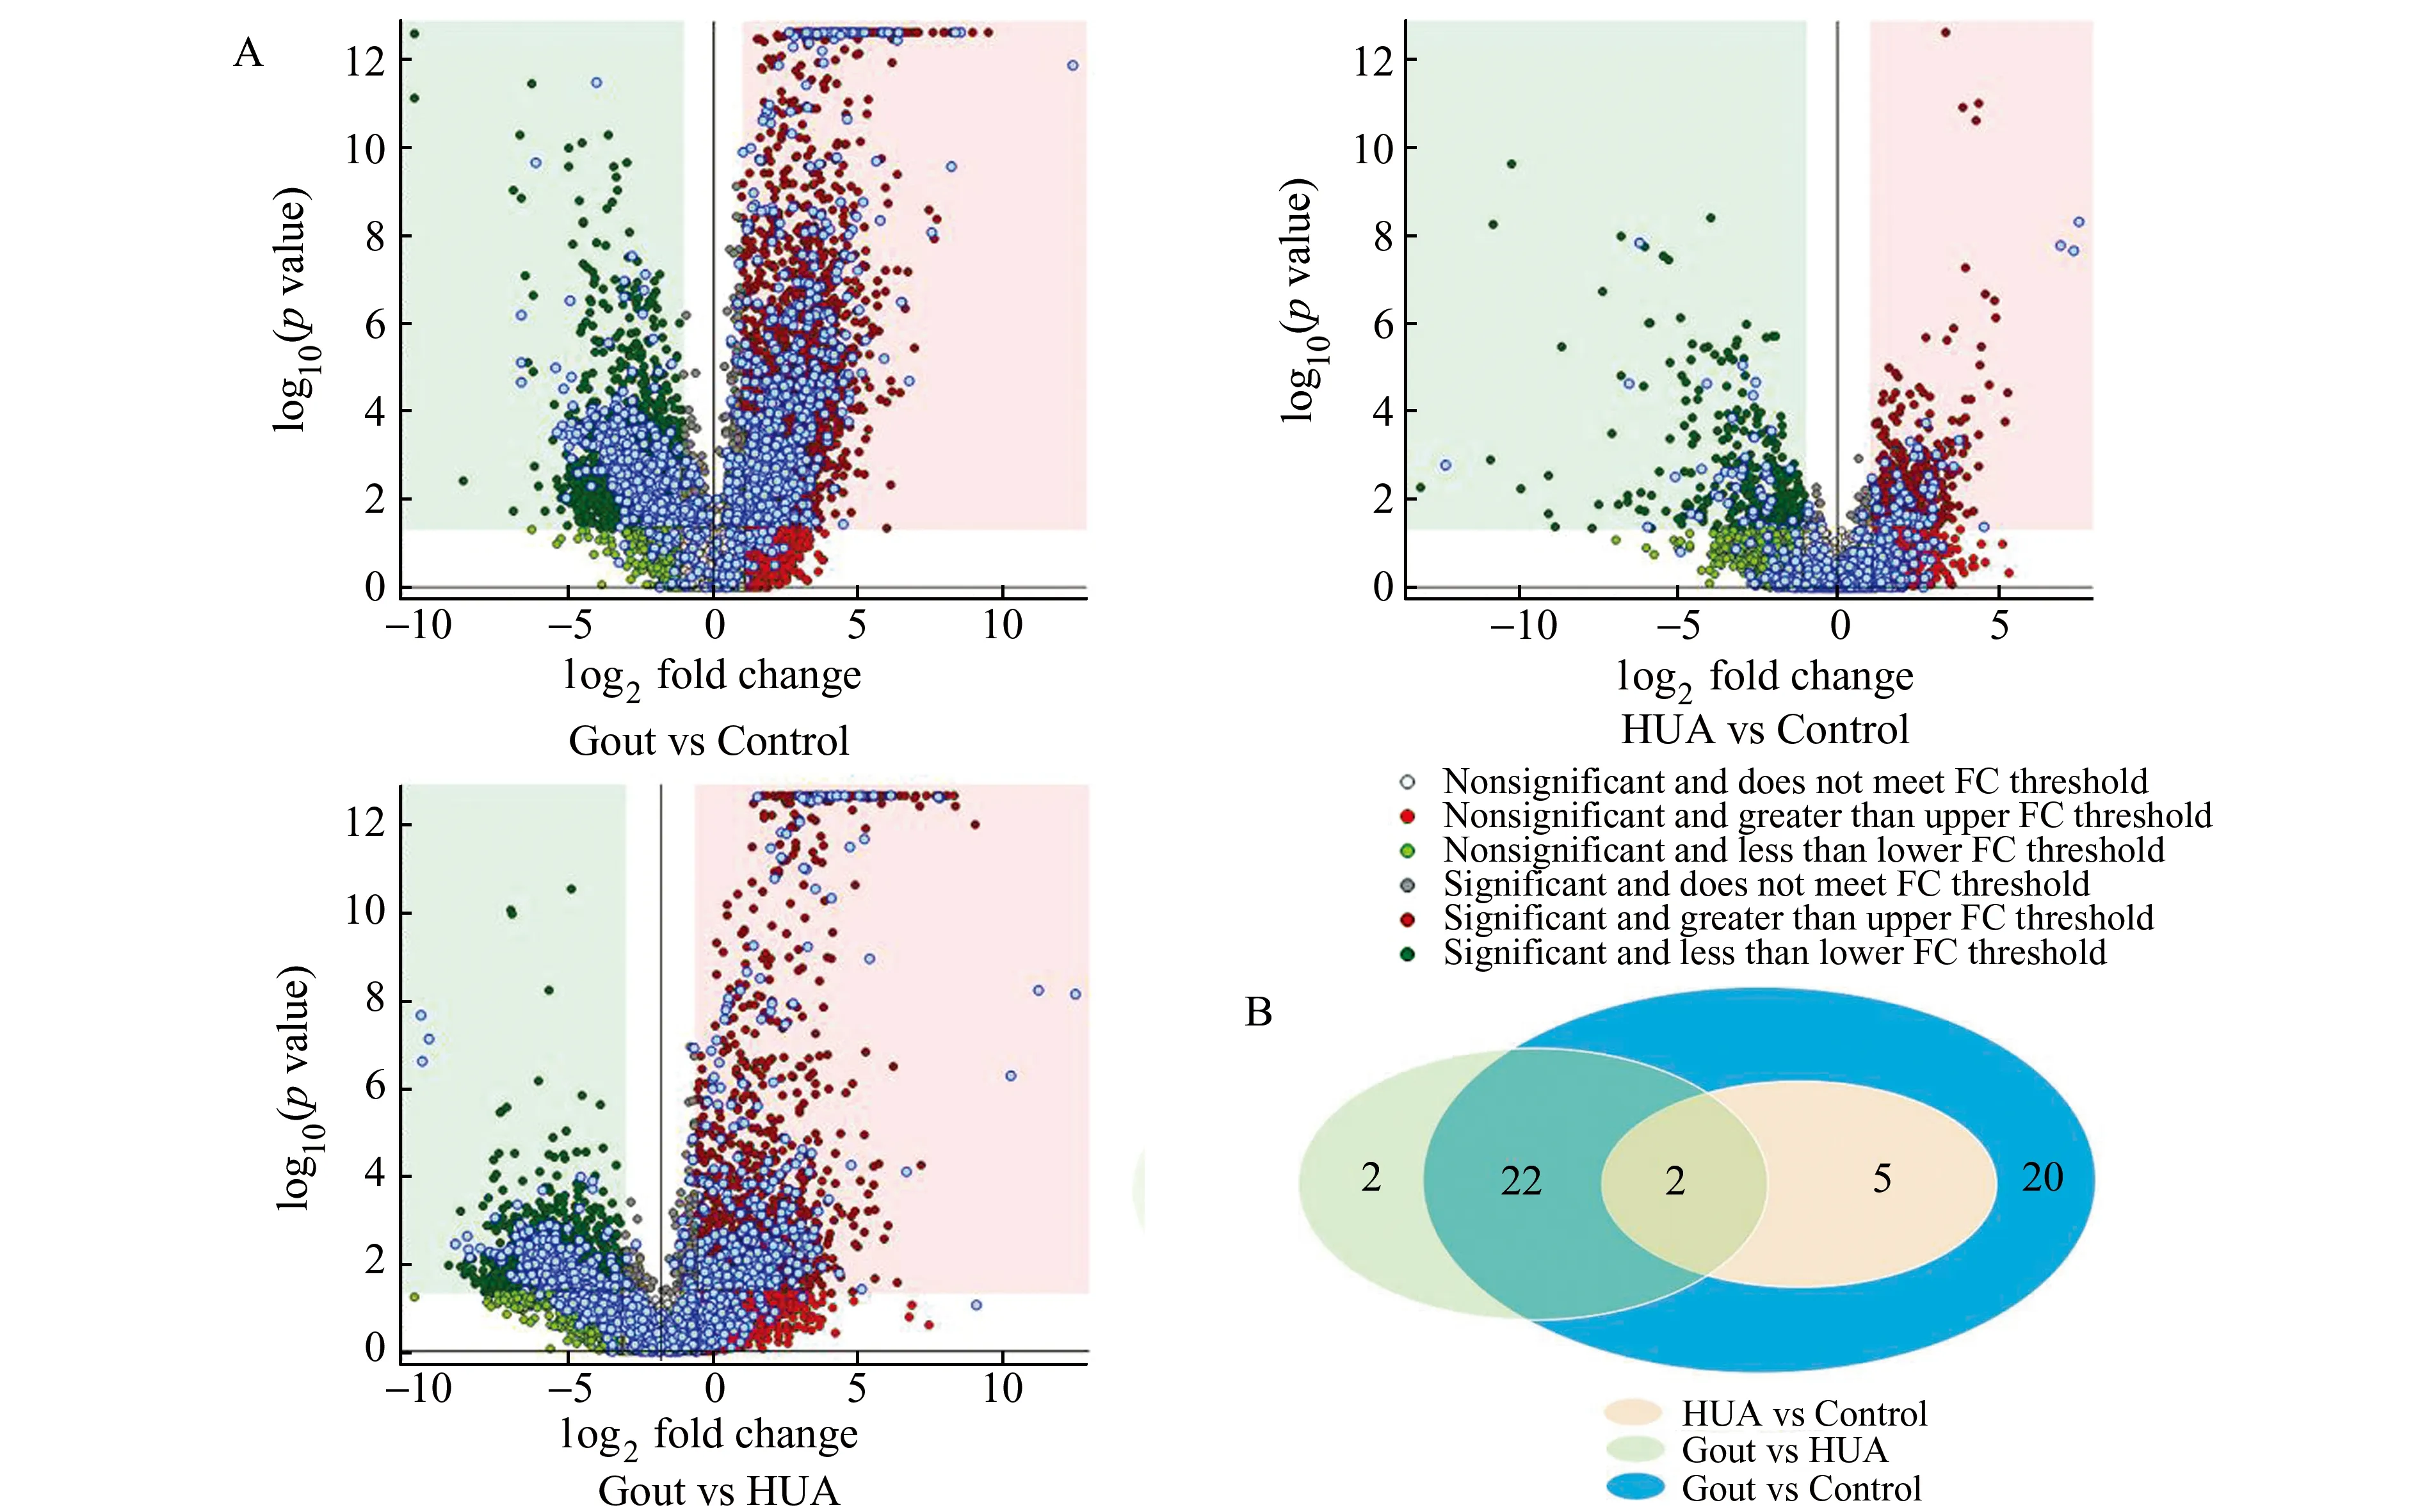
Fig.4 Identification of metabolite biomarkers for gout,a metabolic disease.(A) Volcano plots of metabolic features that are significantly different between gout patients and healthy controls,between HUA patients and healthy controls,or between gout and HUA patients.Y-axis indicates the p values (log-scaled),whereas the X-axis shows the fold change (log-scaled).Each symbol represents a different metabolic feature,and the colors of the symbol categorizes metabolic features falling under different criteria (p value and fold change threshold).p value <0.05 is considered as statistically significant,whereas fold change=2 is set as the threshold.(B) Number of identified salivary metabolites with significant changes (p value <0.05 and fold change>2) among the three two-group comparisons (gout vs HUA,gout vs control,and HUA vs control).Reproduced with permission[12].
Blood is a very most commonly used diagnostic fluid in clinical laboratory setting.However,compared to blood testing,human saliva testing has its own advantages including low protein content and sample complexity,minimum cost,non-invasiveness,and easy sample collection and processing.For patients,the noninvasive collection procedures for saliva dramatically reduce anxiety and discomfort,and simplify procurement of repeated samples for monitoring over time.Comprehensive analysis and identification of the deregulated metabolites in human saliva of gout patients will not only contribute to the understanding of disease pathogenesis,but may also reveal novel metabolomic biomarkers for clinical applications such as disease detection and prognosis prediction.Validated biomarkers derived from our studies,if further tested in multi-centric clinical trials,may lead to non-invasive,diagnostic and prognostic tools for clinical applications in gout.Future studies are warranted to investigate the clinical utility of these identified biomarkers for monitoring gout flare and/or treatment efficacy[12],and microfluidic devices are needed for fast testing of these metabolite biomarkers in body fluids of gout and HUA patients.In addition,we have also discovered saliva and serum metabolite biomarkers for diabetes and coronary heart disease and clinical validation of the identified metabolite biomarkers are currently under testing.
4 Nanotoxicity analysis with metabolomics
The widespread use of metal oxide nanoparticles (MOxNPs)has been found to pose a risk of exposure that may cause hazardous effects in human and the environment.Although many toxicological methodologies have been used to assess nanotoxicity,the effect of MOxNPs on cell metabolisminvitroandinvivoremains largely unknown,especially under the exposure to low-dose or supposedly low-toxicity MOxNPs[9].In our recent study,RPLC-MS/MS based metabolomics was used to reveal significantly altered metabolites in human bronchial epithelial cells exposed to four different types of MOxNPs (ZnO,SiO2,TiO2and CeO2) at both high and low doses.A total of 8630 metabolic features were found to be present in the cellular metabolomic samples of the total nine study groups.Volcano plots were generated to visualize the distribution of metabolic features between each MOxNPs treatment and control groups.Red or green dots in the volcano plots represented significantly upregulated (pvalue <0.05;ratio>1.200) or downregulated metabolites (pvalue <0.05;ratio<0.833),respectively.As shown in Fig.5,LC-MS/MS with data analysis allowed to detect 1733 significantly altered metabolic features (1263 down-regulated and 470 up-regulated) between high dose ZnO NPs and control groups,1672 significantly altered metabolic features (701 down-regulated and 971 up-regulated) between high dose SiO2NPs and control groups,1784 significantly altered metabolic features (669 down-regulated and 1115 up-regulated) between high dose TiO2NPs and control groups,and 1587 significantly altered metabolic features (725 down-regulated and 862 up-regulated) between high dose CeO2NPs and control groups.Meanwhile,a total of 844 (480 down-regulated and 364 up-regulated),2056 (943 down-regulated and 1113 up-regulated),1537 (593 down-regulated and 944 up-regulated) and 1593 (805 down-regulated and 788 up-regulated) significantly altered metabolic features were found in the BEAS-2B cells treated with low dose ZnO,SiO2,TiO2and CeO2NPs,respectively,when compared to the control group.The number of identified metabolites with significant changes among the eight two-group comparisons are shown in Fig.5B.For MOxNPs at the high doses,166 (146 down-regulated and 20 up-regulated),128 (59 down-regulated and 69 up-regulated),158 (51 down-regulated and 107 up-regulated) and 146 (57 down-regulated and 89 up-regulated) significantly altered metabolites were identified between each of the ZnO/SiO2/TiO2/CeO2NPs treatment and control groups,respectively.For MOxNPs at the low doses,77 (36 down-regulated and 41 up-regulated),150 (71 down-regulated and 79 up-regulated),121 (48 down-regulated and 73 up-regulated) and 133 (60 down-regulated and 73 up-regulated) significantly changed metabolites were identified between each of the ZnO/SiO2/TiO2/CeO2NPs treatment and control groups,respectively.Heatmaps were used to visualize the expression pattern of significantly changed metabolites between each MOxNPs treatment and control groups (Fig.5C)[9].
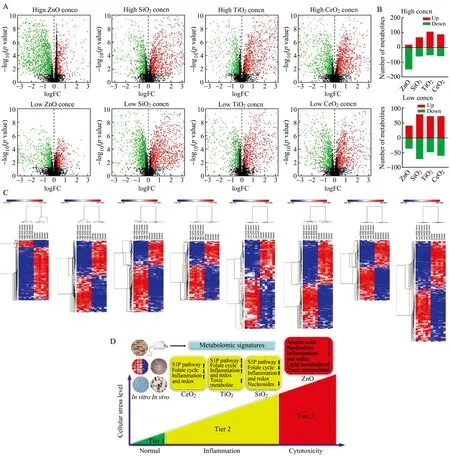
Fig.5 Metabolomic analysis revealed significantly altered metabolites by four different MOx NPs (ZnO,SiO2,TiO2,or CeO2 NPs).(A) Volcano plots of metabolic features that were significantly different between each MOx NP-treated and untreated group.The y-axis indicates the q values (log10-scaled),whereas the x-axis shows the fold change (log-scaled).Each dot represents a different metabolic feature,and the colors of the symbols categorize metabolic features falling under different criteria (q value and fold change threshold).A q value <0.05 was considered as statistically significant,whereas a fold change ≥1.200 or ≤ 0.833 was set as the threshold.(B) Number of identified metabolites with significant alterations between the cells exposed to each MOx NP and untreated cells.(C) Heatmaps of the identified metabolites with significant alteration between MOx NPs treated and untreated cells at two different concentrations.Each column indicated an independent biological sample and each row represented a metabolite.A range of colors that moved from blue to red indicated lowest to highest expression.(D) Hierarchical cellular stress responses based on metabolomics and functional validation.The cells are maintained in healthy state at Tier 1 stage.At an intermediate level of cellular stress (Tier 2),the exposure to SiO2,TiO2 and CeO2 NPs altered the metabolic pathways of S1P,fatty acid oxidation,folate cycle,inflammation/redox,and lipid metabolism in human bronchial epithelial cells.At a high level of cellular stress (Tier 3),ZnO NPs affected metabolism of amino acids,nucleotides,nucleosides,tricarboxylic acid cycle,lipids,inflammation/redox,and fatty acid oxidation,as well as elevation of toxic and DNA damage related metabolites.Only a short list of significantly altered pathways are presented due to limited space.Reproduced with permission[9].
TheIngenuity Pathway Analysis (IPA) tool was then used to analyze the metabolomic data and allowed to reveal significantly altered metabolic pathways and potential molecular mechanisms underlying the toxicological effects of MOxNPs.We demonstrated that high dose ZnO NPs caused severe cellular toxicity with significantly suppressed metabolism of amino acids,nucleotides,nucleosides,lipids,tricarboxylic acid cycle and fatty acid oxidation,as well as the overexpression of toxic (e.g.,DNA damage related) metabolites.On the other hand,the bronchial epithelial cells exposed to SiO2,TiO2and CeO2NPs displayed low toxicity with similar metabolomic alterations,although each type of NPs induced the changes of unique metabolites.These three NPs significantly affected the metabolic pathways of sphingosine-1-phosphate,fatty acid oxidation,folate cycle,inflammation/redox,and lipid metabolism (Fig.5D).In addition,dose-dependent effects were observed for a number of metabolites significantly altered by respective MOxNPs.Representative metabolites of the deregulated metabolic pathways were successfully validatedinvitrousing enzymatic assays.More importantly,these representative metabolites were further validated in a mouse model after inhalation exposure to respective NPs,indicating thatinvitrometabolomic findings may be used to effectively predict the toxicological effectsinvivo.Despite functional assay results demonstrated that the changes in cellular functions were largely reflected by the metabolomic alterations,LC-MS based metabolomics was sensitive enough to detect the subtle metabolomic changes when functional cellular assays showed no significant difference.Collectively,our studies have unveiled novel metabotoxic mechanisms in lung epithelial cells caused by MOxNPs and demonstrated the feasibility of using metabolomic signatures to understand and predict nanotoxicityinvivo[9].
5 Conclusion
Separation science plays a critical role in metabolomics,especially when the separation techniques are coupled with MS for a comprehensive profiling analysis of metabolites.Although LC-MS,GC-MS and CE-MS have been well demonstrated for metabolomic applications,these methods may be combined in order to achieve an in-depth,comprehensive metabolome analysis.RPLC-MS remains as a very commonly used analytical method for metabolomics.However,IC-MS has a great advantage for the analysis of ionic and very polar metabolites,and therefore can serve as a highly valuable complementary platform for metabolomics.We have utilized both RPLC-MS and IC-MS for our metabolomics applications.
In order to tackle the complex cancer metabolism,a systems biology approach combining both metabolomics with transcriptomics may be needed to pinpointsignificant metabolic pathways altered in cancer cells.The identified metabolite targets,if further validated,may serve as biomarkers for clinical applications,whereas the identified metabolic enzymes may be used as the targets for therapeutic interventions.In addition,our studies have demonstrated that metabolomics is a powerful approach to biomarker discovery in metabolic diseases such as gout.The identified and validated metabolite biomarkers may be used for diagnosis,prognosis and monitoring of treatment response.Lastly,we have revealed significantly altered metabolites and metabolic pathways in human bronchial epithelial cells treated with different nanomaterials.Under the circumstance when traditionalinvitroandinvivoassays are not effective to evaluate the toxicological effects of nanomaterials,metabolomic analysis may reveal early metabolic changes in cells and provide insight to the molecular mechanisms underlying the nanotoxicity[9].

