
Prediction of pathological nodal stage of locally advanced rectal cancer by collective features of multiple lymph nodes in magnetic resonance images before and after neoadjuvant chemoradiotherapy
2020-01-09 05:51:08HaitaoZhuXiaoyanZhangXiaotingLiYanjieShiHuiciZhuYingshiSun
Haitao Zhu,Xiaoyan Zhang,Xiaoting Li,Yanjie Shi,Huici Zhu,Yingshi Sun
Key Laboratory of Carcinogenesis and Translational Research (Ministry of Education/Beijing),Department of Radiology,Peking University Cancer Hospital &Institute,Beijing 100142,China
Abstract Objective:To predict pathological nodal stage of locally advanced rectal cancer by a radiomic method that uses collective features of multiple lymph nodes (LNs) in magnetic resonance images before and after neoadjuvant chemoradiotherapy (NCRT).Methods:A total of 215 patients were included in this study and chronologically divided into the discovery cohort (n=143) and validation cohort (n=72).In total,2,931 pre-NCRT LNs and 1,520 post-NCRT LNs were delineated from all visible rectal LNs in magnetic resonance images.Geometric,first-order and texture features were extracted from each LN before and after NCRT.Collective features are defined as the maximum,minimum,mean,median value and standard deviation of each feature from all delineated LNs of each participant.LN-model is constructed from collective LN features by logistic regression model with L1 regularization to predict pathological nodal stage (ypN0 or ypN+).Tumor-model is constructed from tumor features for comparison by using DeLong test.Results:The LN-model selects 7 features from 412 LN features,and the tumor-model selects 7 features from 82 tumor features.The area under the receiver operating characteristic curve (AUC) of LN-model in the discovery cohort is 0.818 [95% confidence interval (95% CI):0.745-0.878],significantly (Z=2.09,P=0.037) larger than 0.685(95% CI:0.602-0.760) of the tumor-model.The AUC of LN-model in validation cohort is 0.812 (95% CI:0.703-0.895),significantly (Z=3.106,P=0.002) larger than 0.517 (95% CI:0.396-0.636) of the tumor-model.Conclusions:The usage of collective features from all visible rectal LNs performs better than the usage of tumor features for the prediction of pathological nodal stage of locally advanced rectal cancer.
Keywords:Lymph node;neoadjuvant therapy;radiomics;rectal cancer
Introduction
Accurate prediction of pathological nodal stage may enable individualized treatments for the patients with locally advanced rectal cancer (LARC) (1-4).If pathological N0[ypN0,no residual metastatic lymph nodes (LNs)]can be confirmed by radiological methods after neoadjuvant chemoradiotherapy (NCRT) and before surgery,the following treatment could be changed from total mesorectal excision (TME) into more conservative plans such as“wait and see”or local excision.It is particularly beneficial to the patients with rectal cancer at lower position to preserve anal sphincter function and improve life quality.Magnetic resonance imaging (MRI) has been recognized as the most effective method to preoperatively evaluate LN status for LARC (5-7).However,the accuracy of preoperative LN evaluation is still below clinical requirement (8).
The emerge of radiomics makes it possible to extract many features from images and construct a predictive model by machine learning.Several studies on colon or rectal cancer including our previous work have applied radiomics in the prediction of pathological complete response (ypT0N0),nodal stage (ypN0) or pathological good response (ypT0-1N0) (9-16).It can be noticed that the labels in all these studies contain pathological nodal stage,but all these studies extract features only from primary tumors and no LN features are included.The major difficulty of using LN features in most retrospective studies is the lack of pathological ground truth of each LN detected in the images.Consequently,it is impossible to treat each LN as a labeled target.If we treat each participant as a labeled target,another challenge is the difference in LN number and LN position among different participants.As a result,it is difficult to determine which LN should be used for feature extraction and classification.
In this study,we propose a method to predict ypN0 stage by using the collective features from LNs.Collective features are defined as 5 statistical measurements of each feature from all delineated LNs of each participant.They include the maximum,minimum,mean,median value and standard deviation.Both pre-NCRT and post-NCRT features are used to measure the difference before and after treatment.The participants are chronologically divided into discovery cohort and validation cohort.Logistic regression model with L1 regularization is used in the discovery cohort for model construction and the validation cohort is used to test the model.Raters’ evaluation and a radiomics model that only uses tumor features are used for comparison.
Materials and methods
Patients
Due to the retrospective nature of the study,a written consent was waived.The protocol was approved by Institutional Medical Ethics Committee of Peking University Cancer Hospital (No.2019KT76).Inclusion criteria:1) biopsy-proven primary rectal adenocarcinoma;2) LARC confirmed by pre-treatment MRI (T-stage ≥T3,or positive nodal status);3) no treatment before;4)complete NCRT;and 5) TME surgery after NCRT.Exclusion criteria:1) lack of pathological results;2) lack of MRI scanning before or after NCRT,or scanning on different scanners;3) lack of high-resolution T2-weighted images;4) insufficient image quality for measurements(e.g.,motion artefacts);5) mucious adenocarcinoma demonstrated by pathology after TME surgery;or 6) lack of noticeable LNs on MRI.The inclusion and exclusion flowchart is shown inFigure 1.Finally,215 patients were included in this study,and chronologically divided into discovery cohort (n=143,Aug 2011-Nov.2014) and validation cohort (n=72,Nov.2014-Apr.2015) in the proportion of 2:1.
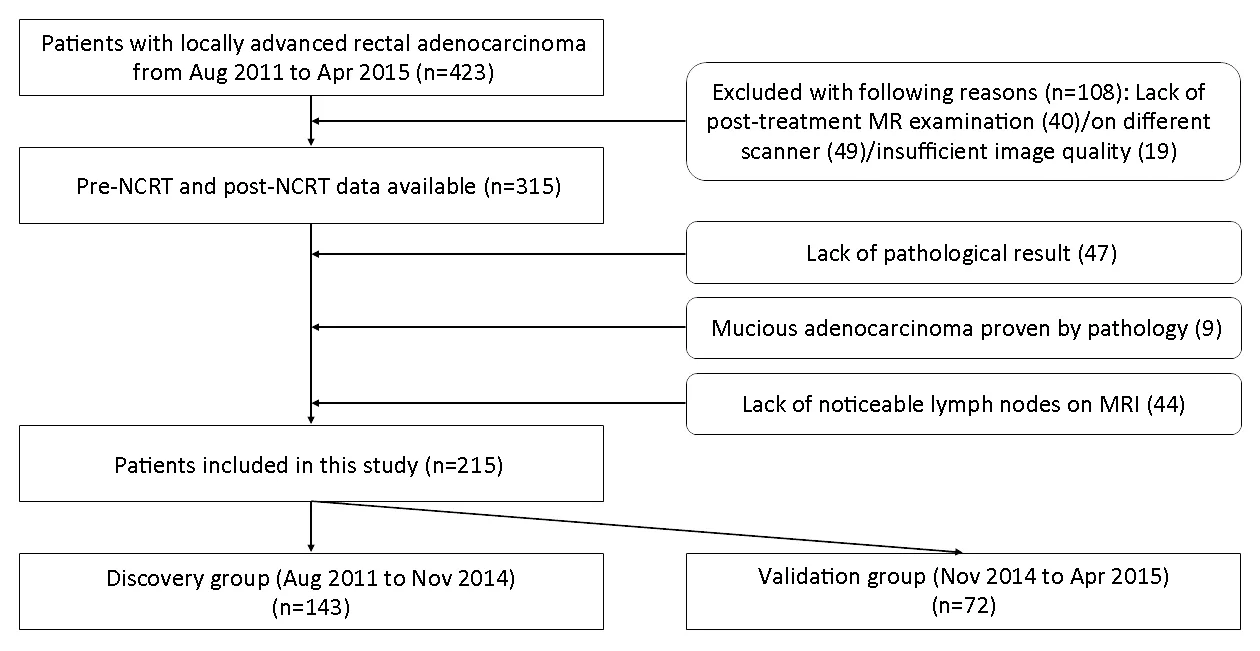
Figure 1 Inclusion and exclusion flowchart of this study.
MRI data acquisition
All patients received MRI examinations at two time points:within one week before the initiation of NCRT and within one week before surgery,which were defined as pre-NCRT MRI and post-NCRT MRI,respectively.MRI examinations were performed with a 3.0 Tesla MRI scanner (Discovery 750;GE Healthcare,Milwaukee,WI,USA) using an 8-channel phased array body coil in the supine position.To reduce colonic motility,20 mg of scopolamine butylbromide was injected intramuscularly 30 min prior to scanning.Patients were not asked to undergo bowel preparation before the examination.T2-weighted images were scanned in an oblique direction perpendicular to the intestinal tube with following parameters:repetition time (TR)=5,700 ms,echo time (TE)=110 ms,echo number=25,field of view (FOV)=180 mm × 180 mm,image size=512×512.
NCRT treatment
All patients underwent intensity-modulated radiation therapy (IMRT) with RapidArc (Varian Medical System,Palo Alto,CA,USA).The IMRT regimen consisted of 22 fractions of 2.3 Gy (gross tumor volume,GTV) and 1.9 Gy(clinical target volume,CTV).The total dose of 50.6 Gy(GTV)/41.8 Gy (CTV) was administered 5 times per week over a period of 30 d (17,18).Capecitabine (825 mg/m2orally twice per day) was administered concurrently with IMRT.All patients received TME surgery within 8-10 weeks after completion of IMRT.The treatment protocol and timeline followed the National Comprehensive NCCN guideline (19).
Pathologic assessment of response
Standard TME surgery was performed.The histopathologic evaluation was standardized as follows:The specimen was inked and fixed in formalin for 24-48 h.The specimen was then sectioned every 5 mm perpendicularly to the mesorectum.A careful search for LNs was made in each histopathologic tissue slice by an experienced pathologist with 10 years of experience.Each harvested LN was processed according to standard methods and stained with hematoxylin-eosin.Pathological nodal stage (ypN0 or ypN+) is used as ground truth for classification.If any LN is proved malignant,the participant is labeled as ypN+.
Feature extraction
Region of interest (ROI) was manually delineated on the whole tumor and all the noticeable LNs on each slice of the T2-weighted image with itk-SNAP (www.itksnap.org) by an experienced radiologist (20).ROIs were drawn along the contour of the tumor and LNs (Figure 2).The reproducibility of ROI delineation was tested on the first 50 patients by another experienced radiologist who is blind to the first radiologist’s delineation.Dice similarity coefficient(DSC) is used to evaluate the agreement of two ROIs (21).Features were automatically extracted from the ROI by a home-made program developed on the platform of MATLAB (2017b,MathWorks,Natick,MA,USA).Intraclass correlation coefficient (ICC) is used to evaluate the agreement of features extracted from the ROIs that are delineated by two radiologists.Voxels with intensities outside the rangewere rejected and not considered in the subsequent feature extraction,as suggested by Collewetet al(22).The intensity of all images is scaled into the range between 0 and 1 for normalization.Forty-one features were extracted from each LN and the primary tumor.They include 9 first-order gray level histogram features from the ROI volume,24 second-order gray level co-occurrence matrix (GLCM) texture features and 8 geometric features from the whole volume and the slice that has the largest ROI area.The mathematic expressions of the 41 features are described in theSupplementary materials.
Radiomics models
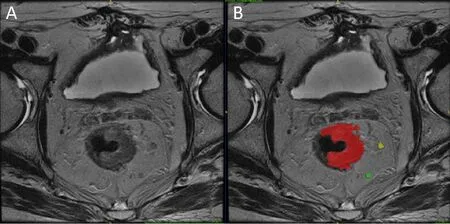
Figure 2 Example of region of interest (ROI) delineation for primary tumor and lymph nodes (LNs).(A) T2-weighted image;(B) ROI delineation on tumor and LNs.Red color is primary tumor;yellow and green color are LNs.
An LN-model is constructed by using the collective features from all visible rectal LNs.Collective features include the maximum,minimum,mean,median value and standard deviation of each feature of all visible rectal LNs of each participant.It also includes the pre-NCRT LN number and the post-NCRT LN number of each participant.Therefore,LN-model has 412 features(41×5×2+2) as both pre-NCRT and post-NCRT features are included.
A tumor-model is constructed by the features from the primary tumor.Tumor-model uses 41 features of the primary tumor in both pre-NCRT and post-NCRT data.Therefore,Tumor-model has 82 features (41×2).
Subjective evaluation was performed by two raters,a junior radiologist and a senior radiologist.First,the junior rater classified each participant into cN0 and cN+according to all MRI protocols before and after NCRT.Next,the senior rater reviewed the classification and made necessary correction.
Training and validation
Prior to training,redundant features are examined and removed.If the absolute value of correlation coefficient between two features is larger than a hyperparameterr,the feature with smaller group difference is removed.The remained features are trained by least absolute shrinkage and selection operator (LASSO) with L1 regularization(23).The positive and negative samples were properly weighted to keep a balance between two classifications.The 5-fold cross-validation is used to tune the hyperparameter λ by maximizing the area under curve(AUC) of receiver operating characteristic (ROC) curve.The detail of LASSO algorithm and the definition of λ are described in theSupplementary materials.After λ is determined,the model is trained with all data in the discovery cohort and tested in the validation cohort.
Statistical analysis
All continuous data were expressed asand the categorical data were presented with specific number and proportions.Student’st-test was used to compare the age difference between discovery cohort and validation cohort.Student’st-test was also used to remove all features that have no significant difference (P>0.05).Pearson Chi-square test was used to compare the difference in gender,T-stage and N-stage.Likelihood-ratio was used if any cell has expected count less than 5.AUC of different methods was compared by the method proposed by DeLonget al(24).Maximum Youden index (sensitivity+specificity -1) was used to determine the cutoff value to separate predicted ypN0 and ypN+.A two-sided P<0.05 was regarded as statistically significant.
Results
Clinical characteristics
Clinical characteristics of patients are summarized inTable 1.Significant difference (P<0.05) was found in age between discovery cohort and validation cohort.Gender,pre-NCRT TN-stage and pathological yTN-stage didn’t show significant difference (P>0.05).
ROI characteristics
A total of 2,931 pre-NCRT LNs and 1,520 post-NCRT LNs were delineated from 215 patients both in discovery cohort and validation cohort.The number of LN is 13.6±5.0 in pre-NCRT data and 7.1±3.9 in post-NCRT data for one patient,respectively.The DSC of ROI delineation of 50 common participants delineated by two radiologists is 0.93 for tumor and 0.87 for LN.The ICC values of all features between the delineations of two radiologists on 50 subjects are in the range from 0.82 to 0.95.
Discovery cohort
During the training of LN-model,412 features were first reduced to 156 by removing insignificant features with Student’st-test.Then the 156 features were reduced to 7 by removing redundant ones withr=0.6.All the 7 features were selected by LASSO algorithm with L1 regularization.The hyperparameter λ=0.0367 is determined by 5-fold cross-validation.The 7 features in the final LN-model and the corresponding weights are listed inTable 2.Positive weights indicate positive relation with ypN+probability.The“time”column is used to separate pre-NCRT features from post-NCRT features.Finally,LN-model includes 3 pre-NCRT features and 4 post-NCRT features.The“collective measurement”column points out the statistical measurement to calculate the collective features from all visible LNs of each participant.
During the training of tumor-model,82 features were first reduced to 25 by removing insignificant features with Student’st-test.Then the 25 features were reduced to 8 by removing redundant features.Finally,8 features werereduced to 7 features by LASSO algorithm with L1 regularization.The hyperparameter λ=0.0111 is determined by 5-fold cross-validation.The final 7 features in the tumor-model and the corresponding weights are listed inTable 3.They include 1 pre-NCRT features and 6 post-NCRT feature.
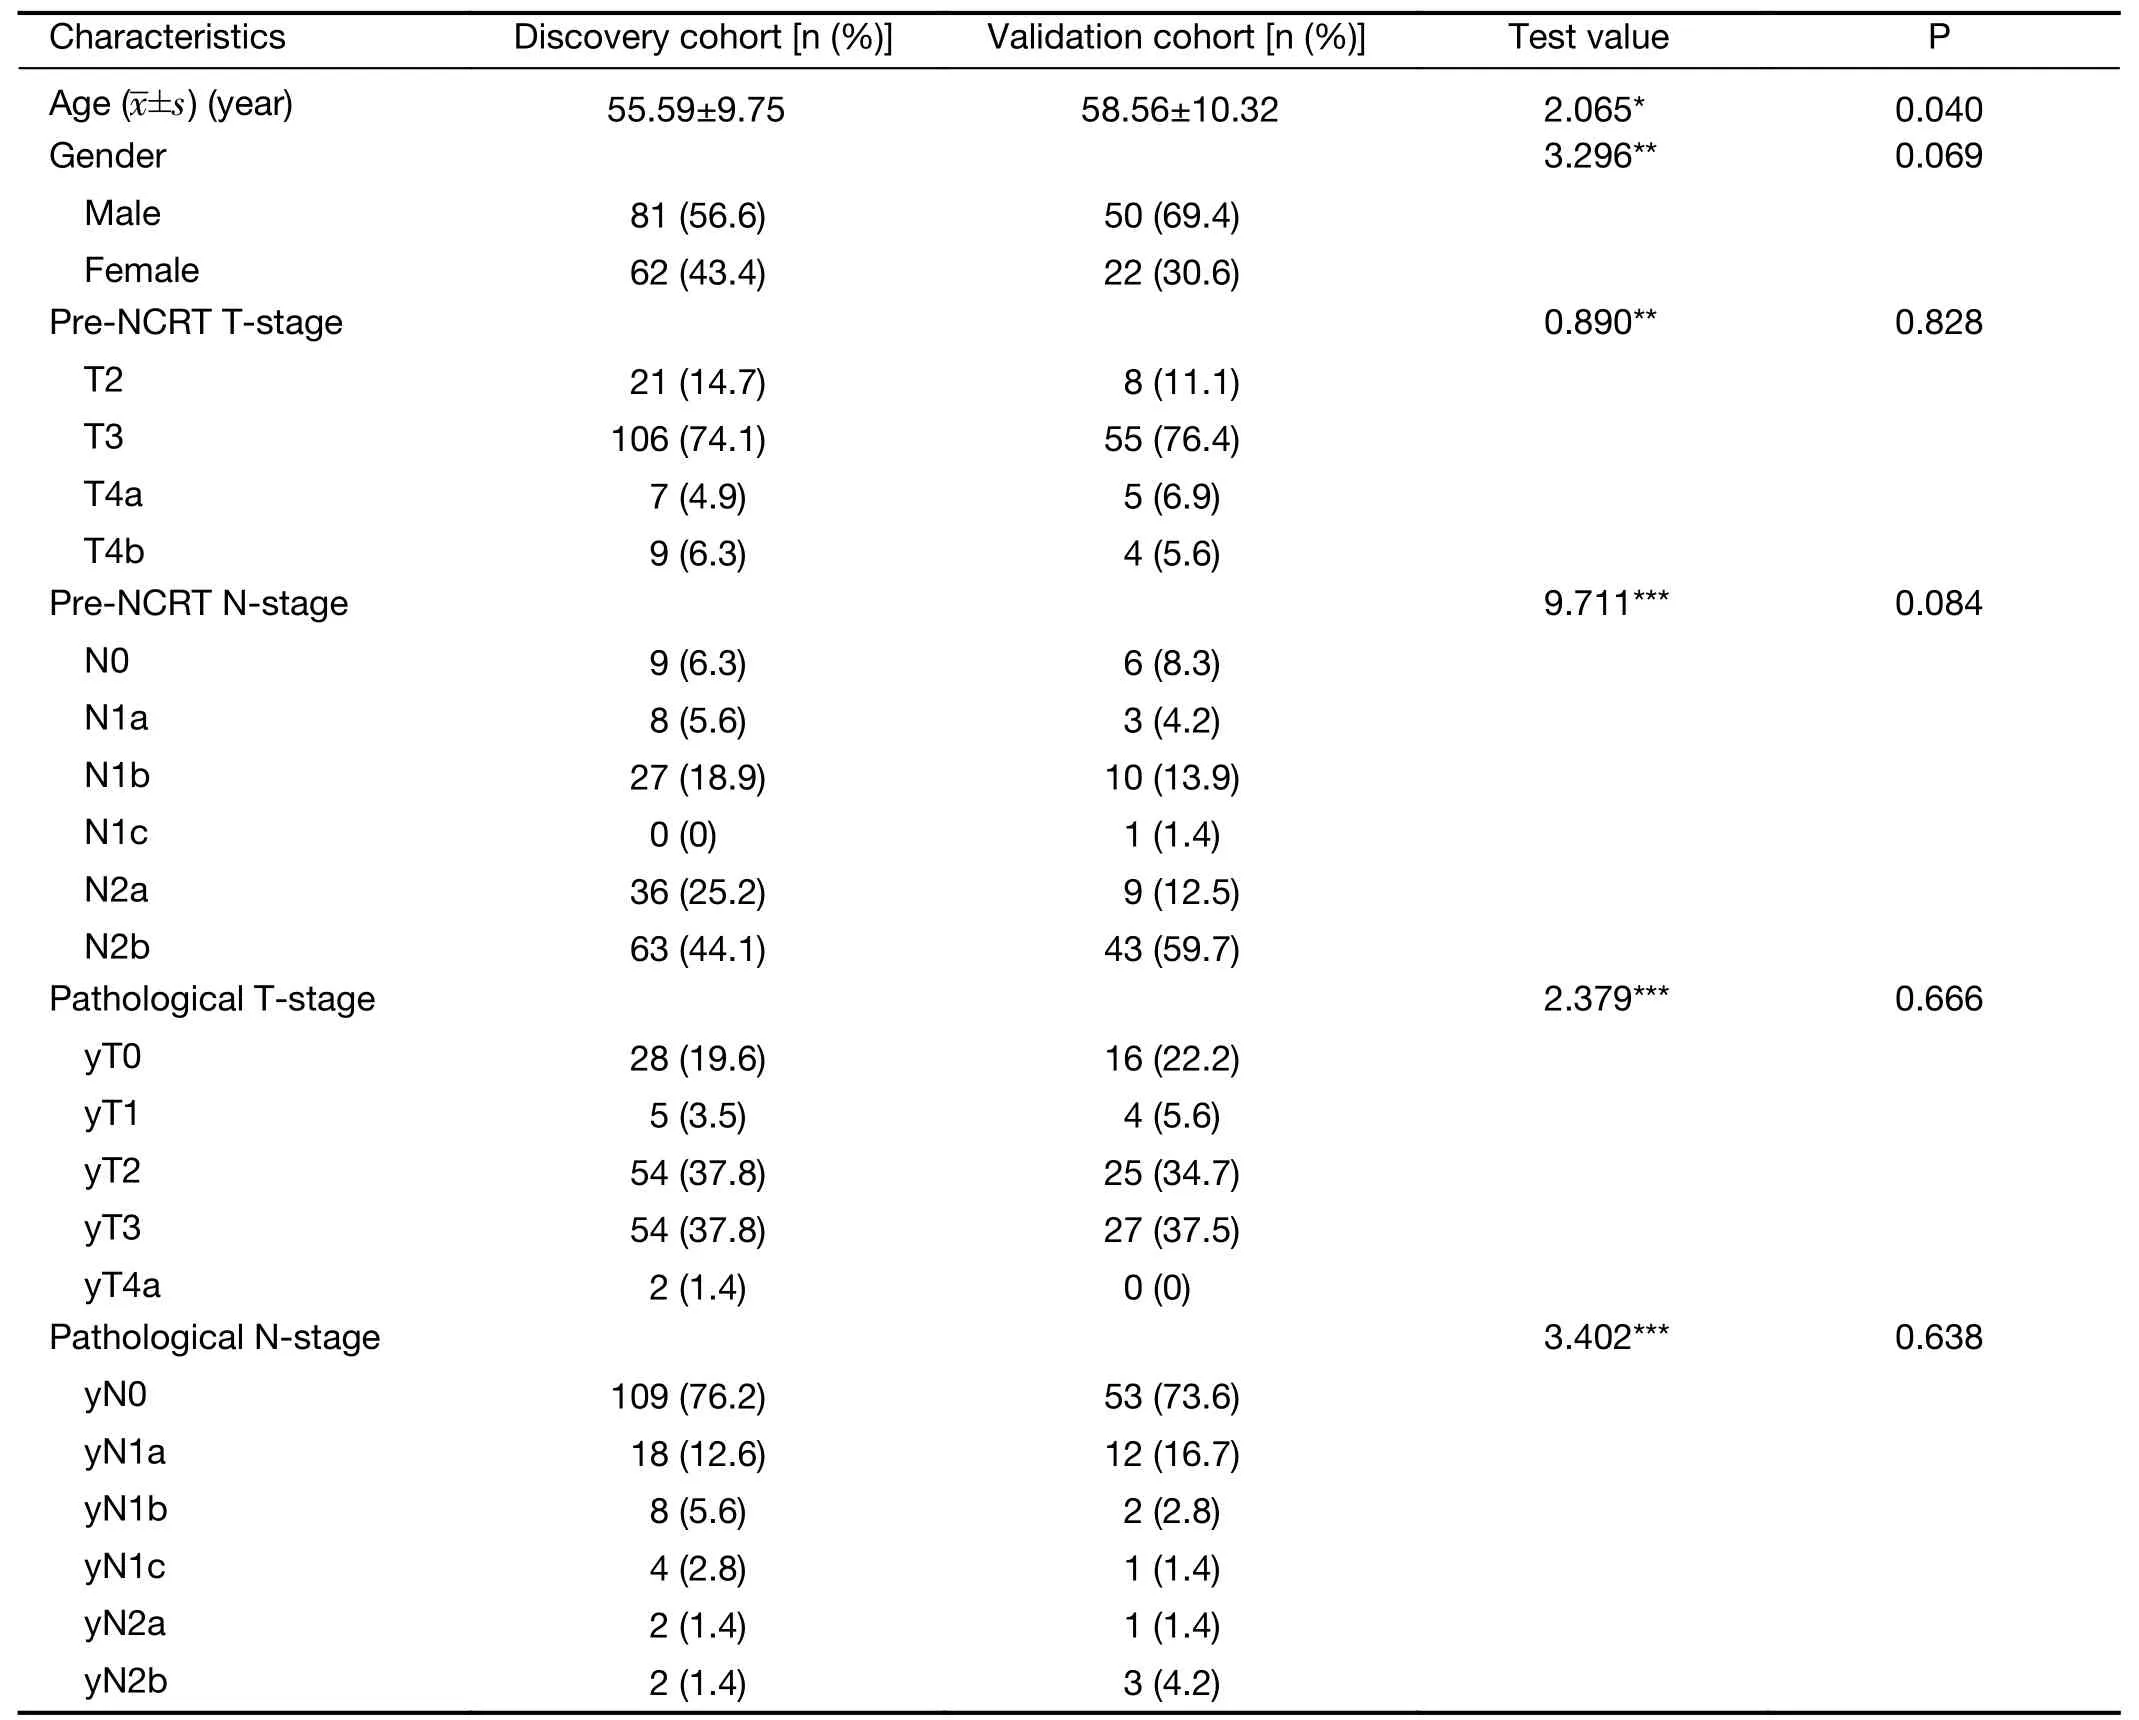
Table 1 Clinical characteristics of patients in discovery cohort and validation cohort
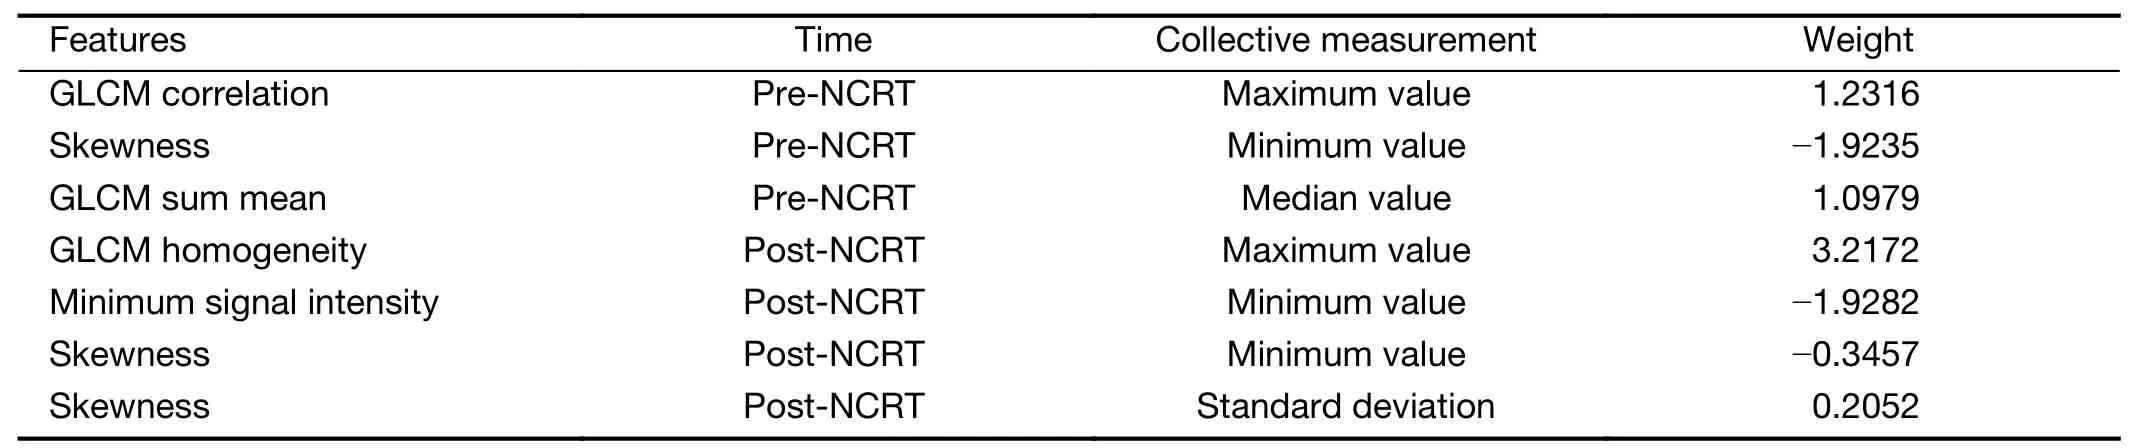
Table 2 Features and their weights included in LN-model
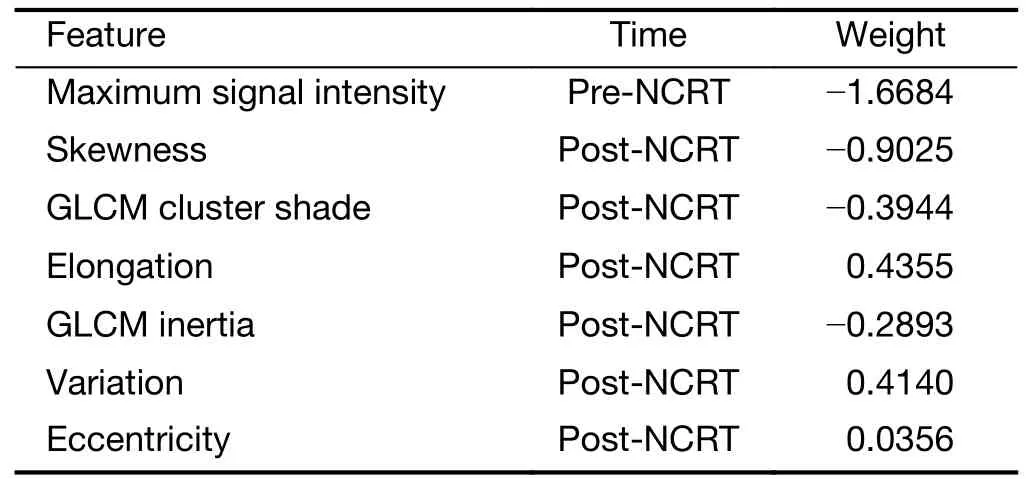
Table 3 Features and their weights included in tumor-model
ROC curves were plotted inFigure 3Aby comparing the predictive scores of 143 participants in discovery cohort with their pathological nodal stage.The AUC value of LNmodel in the discovery cohort is 0.818 [95% confidence interval (95% CI):0.745-0.878),significantly (Z=2.09,P=0.037) larger than 0.685 (95% CI:0.602-0.760) of the tumor-model.The AUC value of subjective evaluation by raters is 0.581 (95% CI:0.496-0.663) in discovery cohort.The corresponding sensitivity,specificity,positive predictive value and negative predictive value are summarized inTable 4.
Validation cohort
The LN-model and tumor-model were tested by the participants in the validation cohort with the features and their weights determined by training.The ROC curves of validation cohort were plotted inFigure 3B.The AUC of LN-model in validation cohort is 0.812 (95% CI:0.703-0.895),significantly (Z=3.106,P=0.002) larger than 0.517 (95% CI:0.396-0.636) of the tumor-model.The AUC value of subjective evaluation by raters is 0.717 (95%CI:0.599-0.817) in validation cohort.The corresponding sensitivity,specificity,positive predictive value and negative predictive value are summarized inTable 5.
Discussion
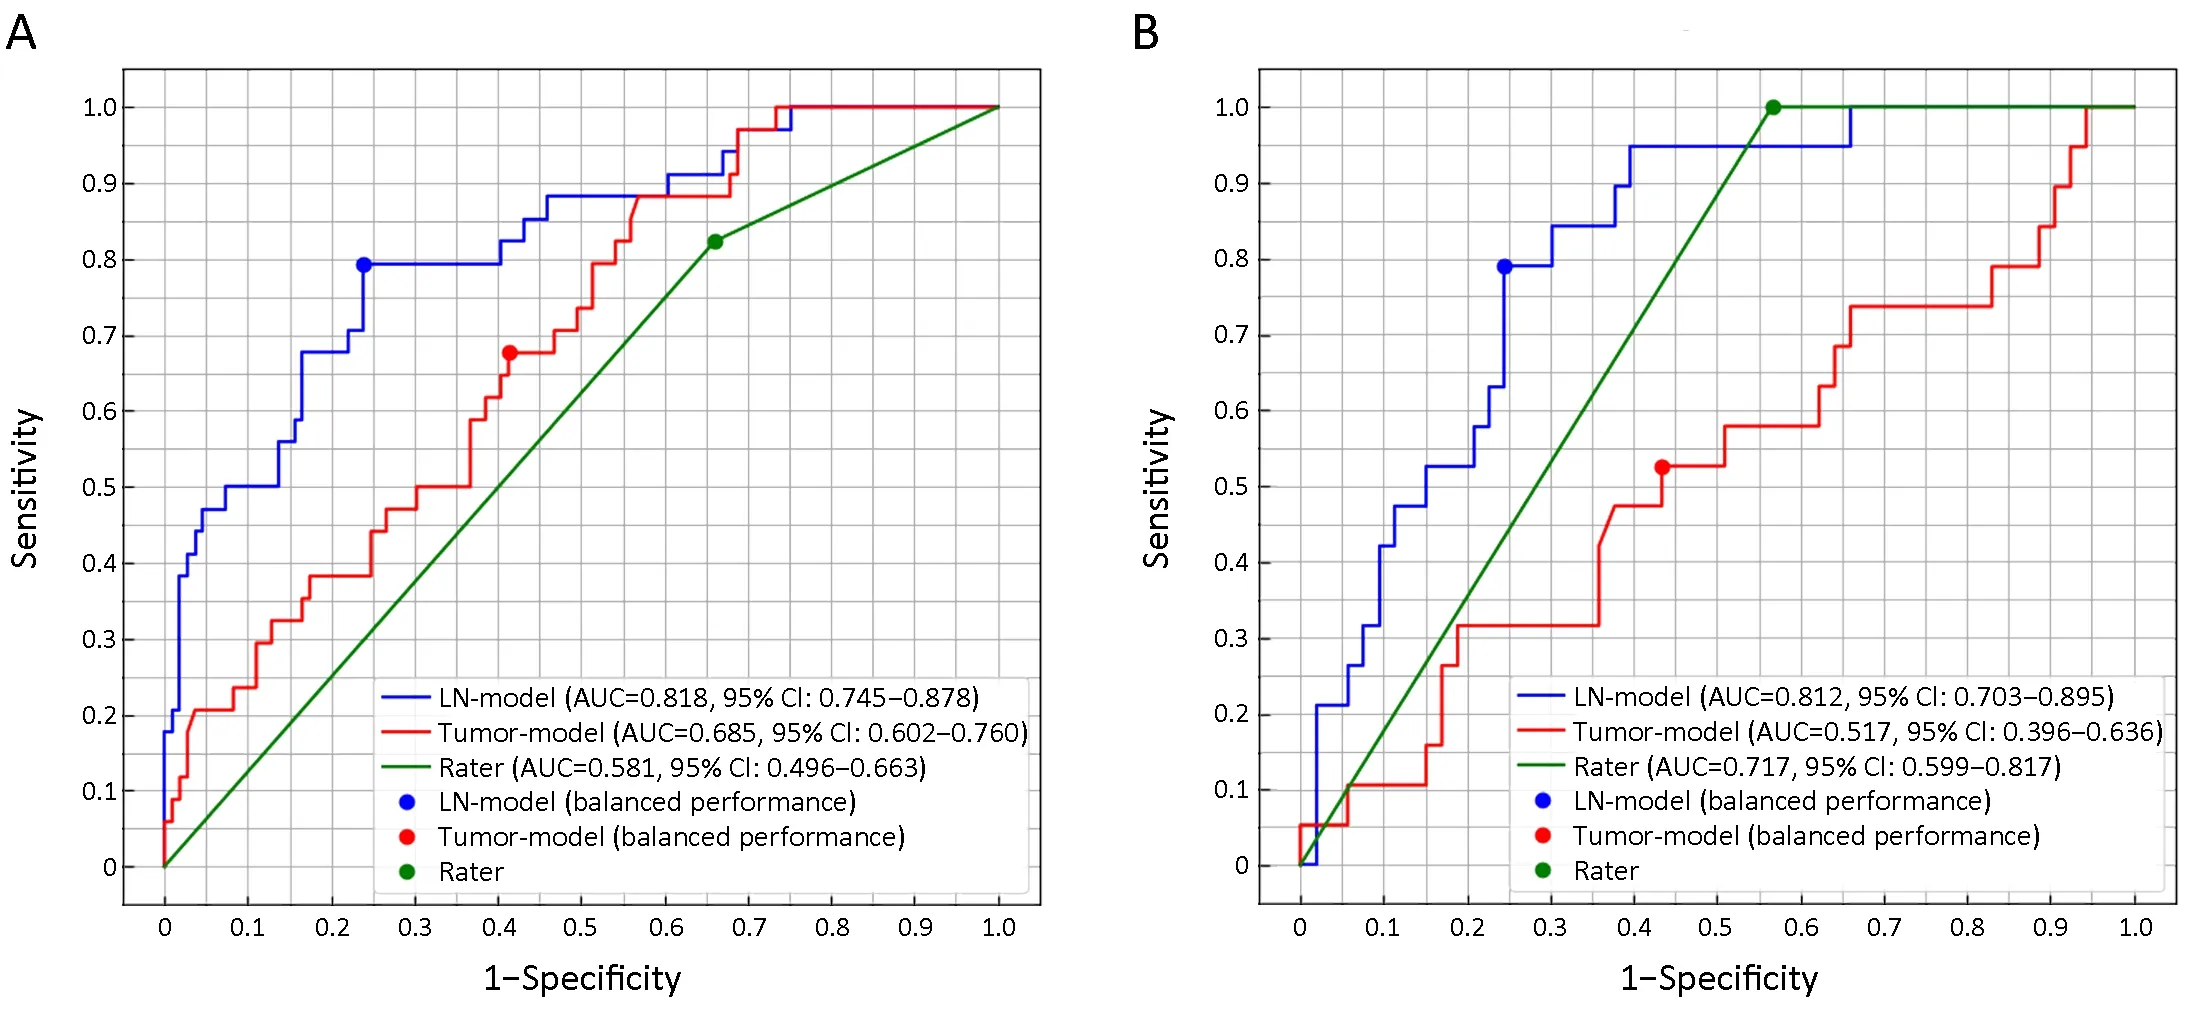
Figure 3 Receiver operating characteristic (ROC) curves for LN-model,tumor-model and rater’s evaluation in discovery cohort (A) and validation cohort (B).
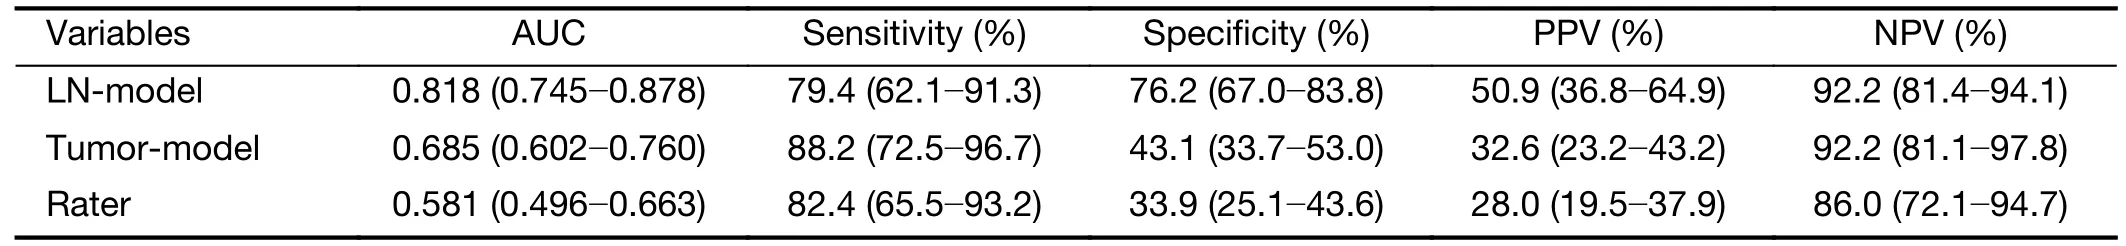
Table 4 AUC,sensitivity,specificity,PPV and NPV of LN-model,tumor-model,raters’ evaluation in the discovery cohort
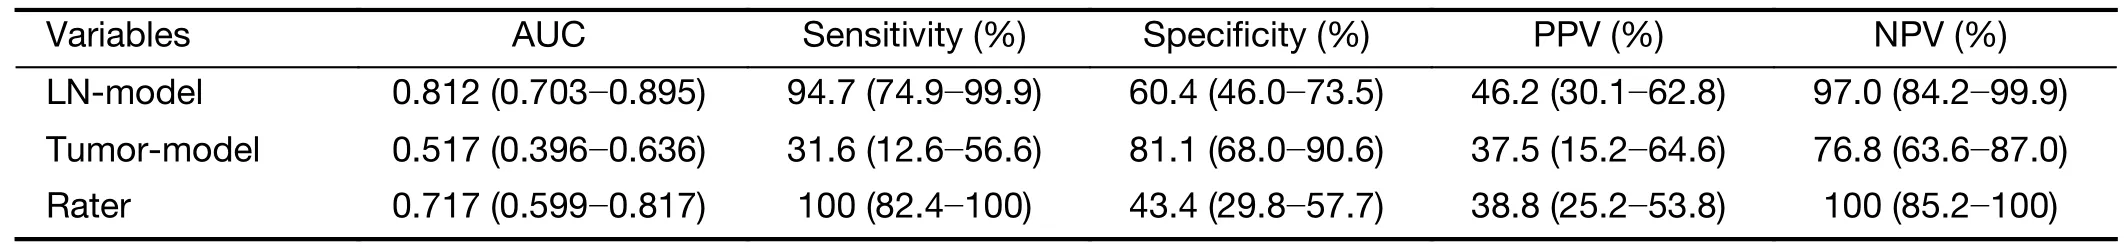
Table 5 AUC,sensitivity,specificity,PPV and NPV of LN-model,tumor-model,raters’ evaluation in the validation cohort
Many studies have established radiomics models to predict pathological complete response,pathological nodal stage or pathological good response,but only the features of primary tumor are included (9-16).It is a challenging problem to utilize LN features in machine learning.A patient pathologically proven as ypN+may have several malignant LNs and several benign LNs,but most retrospective studies may not match the pathological result of each LN with its position in the image.Therefore,all LNs must be viewed as one target with a single pathological nodal stage as a label.It is difficult to include all features from multiple LNs into a radiomics model because the number and position of LNs probably vary a lot among different individuals.To solve the problem,this study proposed to calculate the collective features from multiple LNs.Collective features include the maximum,minimum,mean,median value and standard deviation of each feature from all visible LNs of each participant.Therefore,a fixed number of features can be selected to represent all LNs of each participant.Resultsshow that LN-model has significant larger AUC than the tumormodel to predict ypN0 in both discovery cohort and validation cohort.
In this study,features were first selected byt-test,redundancy test and then by logistic regression with L1 regularization.Overfitting is a challenging problem in machine learning.The recommended number of features in the linear model is between 1/10 and 1/3 of the number of participants in one classification (12).Both LN-model and tumor-model contains 7 features in the logistic regression,which is about 1/5 of the number of ypN+participants (n=34) in the discovery cohort.Table 2shows that two post-NCRT skewness features are included in final LN-model.They are the minimum value and standard deviation of skewness feature extracted from multiple LNs of each participant.It suggests that the abnormality of feature distribution of one’s multiple LNs could be a hint of the existence of malignant LNs.
Accurate prediction of pathological nodal stage is desirable for the treatment of LARC by NCRT.If pathological N0 stage is accurately predicted,the following treatment could be changed to more conservative plans such as local excision or“wait and see”and the patients may benefit from anus preservation or avoidance of surgery.In this study,radiomics model is used to predict pathological N0 stage.The AUC of LN-model is larger than that of the raters’ evaluation in this work or in references (8).Although the sensitivity and specificity of LN-model are still insufficient for clinical diagnosis,it might provide radiologists with a supplementary tool to perform a preoperative individualized prediction of nodal stage for the purpose of personalized medicine.
In this study,only T2-weighted images are used for feature extraction and classification.It is a protocol with reduced field of view and high resolution particularly useful for the visualization of small LNs.T2-weighted images with high resolution are considered by radiologists as the most effective protocol to evaluate rectal tumor and LNs.The other useful protocol is diffusion weighted imaging(DWI).Limited by the resolution,however,some small LNs noticeable on T2-weighted images cannot be found on the corresponding DWI images due to partial volume effect or artifact.Thus,DWI features are not included in this study.Limited by the retrospective nature of this study,the pathological ground truth of each MRI-visible LN is unavailable.As a result,the pathological status of each rectal LN in the image is not predictable.An alternative way is using the agreed diagnosis by several radiologists as the gold standard to build a predictive model (25).However,radiological agreement still cannot replace the pathological ground truth.In order to predict pathological status of each LN,prospective study might be required to identify the same LN in both MRI and histological examination.
Conclusions
The radiomics model using collective features from all visible rectal LNs is more accurate than using tumor features for the prediction of pathological nodal stage of LARC.
Acknowledgements
This study was supported by Beijing Municipal Administration of Hospitals Clinical Medicine Development of Special Funding Support (No.ZYLX201803),Beijing Hospitals Authority’ Ascent Plan (No.DFL20191103),National Key R&D Program of China (No.2017YFC1309101,2017YFC1309104).
Footnote
Conflicts of Interest:The authors have no conflicts of interest to declare.
 Chinese Journal of Cancer Research2019年6期
- Chinese Journal of Cancer Research的其它文章
- Economic evaluation of cervical cancer screening strategies in urban China
- An elevated preoperative serum calcium level is a significant predictor for positive peritoneal cytology in endometrial carcinoma
- Relationship between inter-α-trypsin inhibitor heavy chain 4 and ovarian cancer
- Diagnostic value of negative enrichment and immune fluorescence in situ hybridization for intraperitoneal free cancer cells of gastric cancer
- Stomatin plays a suppressor role in non-small cell lung cancer metastasis
- Genomic dissection of gastrointestinal and lung neuroendocrine neoplasm