A three-year longitudinal study of the relation between left atrial diameter remodeling and atrial fibrillation ablation outcome
Hui-Ling Lee, Yi-Ting Hwang, Po-Cheng Chang, Ming-Shien Wen, Chung-Chuan Chou
?
A three-year longitudinal study of the relation between left atrial diameter remodeling and atrial fibrillation ablation outcome
Hui-Ling Lee1, Yi-Ting Hwang2, Po-Cheng Chang3, 4, Ming-Shien Wen3, 4, Chung-Chuan Chou3, 4
1Department of Anesthesia, Chang Gung Memorial Hospital, Taipei, Taiwan, China2Department of Statistics, National Taipei University, Taipei, Taiwan, China3Division of Cardiology, Department of Internal Medicine, Chang Gung Memorial Hospital, Taipei, Taiwan, China4Chang Gung University College of Medicine, Taoyuan, Taiwan, China
The long-term prognostic influence of left atrial diameter (LAD) remodeling on the status of post-radiofrequency catheter ablation (RFCA) atrial fibrillation (AF) is unclear. This study employed a two-stage model from 3-year echocardiographic data to ascertain whether the two-stage model predicts RFCA outcome more favorably than models using the baseline LAD.Data were retrospectively collected from 263 consecutive patients with drug-refractory AF undergoing RFCA. Regular echocardiographic measurements of LAD were performed at baseline, 1, 3, 6, and 12 months and then every 6 months after RFCA. Sex, age, type of AF, number of RFCA, and AF status were recorded. We obtain the actual (predicted) 3-year LAD using a longitudinal linear mixed model (1ststage). Logistic regression models based on the baseline LAD (Model 1), actual (predicted) 3-year LAD (Model 2) (2ndstage), and observed 3-year LAD (Model 3) were constructed to predict RFCA outcome. The area under the receiver operating characteristic curve (AUC) were used to assess the performance of models.The lowess smoothed curve indicated that the LAD declined over the first three months and remained stable up to 36 months after RFCA. The degree of LAD reduction was significantly influenced by the baseline LAD. Non-paroxysmal AF, large LAD and female gender were significant predictors of AF recurrence. Model 2 had the largest AUC among the three models.This longitudinal study-based two-stage model outperforms the original logistic model using the baseline LAD. Non-paroxysmal AF, larger LAD and female gender are significant predictors of RFCA failure.
J Geriatr Cardiol 2018; 15: 486?491. doi:10.11909/j.issn.1671-5411.2018.07.005
Atrial fibrillation; Left atrial diameter; Longitudinal data; Radiofrequency catheter ablation; Two-stage model
1 Introduction
Echocardiography is widely employed to assess cardiac chamber sizes and function in patients with atrial fibrillation (AF), and the left atrial diameter (LAD) is the parameter most commonly used to represent the size of the left atrium (LA). LA enlargement is an echocardiographic marker of atrial remodeling and has a well-established association with the incidence of AF.[1]In addition, LAD is one of the most favorable predictor of AF recurrence after radiofrequency catheter ablation (RFCA),[2,3]suggesting that a critical mass of atrial tissue plays an important role in the pathophysiological pathway of AF recurrence after ablation. Many studies have used data from only one or two echocardiographic measurements to determine the relationship between LAD and RFCA outcome, but the relationship between the longitudinal changes in LAD after RFCA and RFCA outcome is unclear.[4,5]Because of the repeated observation at the individual level, longitudinal studies take the advantage of being able to exclude time-invariant unobserved individual differences and of observing the temporal orders of events compared with cross-sectional observational studies.[6]However, the longitudinal studies of LAD remodeling and its power in predicting RFCA outcome are insufficient.
Serial measurements of LAD can be obtained from outpatient clinical appointments. Nevertheless, missing data owing to patients being lost to follow-up, and consequences of observed repeated measures (i.e., measurement errors or biologic variations) may occur. To obtain a more accurate evaluation of LAD change and its power to predict AF recurrence three years after RFCA, this study employed a two-stage model suggested by Hwang,.[7]This model employs a random effect mode to identify the actual value of LAD measurement and treats this actual value as a time-dependent covariate in the logistic regression to predict RFCA outcome.[8]Our objective was to ascertain whether the two-stage model predicts the status of AF after RFCA more favorably than models which only analyze the baseline LAD.
2 Methods
2.1 Study population
We retrospectively evaluated 292 consecutive patients who underwent RFCA for drug-refractory symptomatic AF between July 2004 and March 2014 at our institution. Patients who were lost to clinical follow-up after RFCA, who had severe valvular heart disease requiring surgery or previously received surgical MAZE were excluded. As a result, 263 patients were enrolled in the study. Patients who had AF episodes that self-terminated within seven days were classified as having paroxysmal AF, whereas those whose AF episodes lasted longer than seven days were classified as having non-paroxysmal AF. The Institutional Review Board of Chang Gung Memorial Hospital approved the study protocol (approval number: 201700218B0), and written informed consent was obtained from all patients.
2.2 Electrophysiological Study and RFCA
All patients received RFCA under general anesthesia. RFCA was performed using a 3D electroanatomical mapping system (CARTO, Biosense-Webster, Diamond Bar, CA, USA) to support the creation and validation of ablation lesions. A 3.5-mm open-tip irrigated CARTO catheter and a circular catheter (Lasso, Biosense Webster) were percutaneously introduced through the right femoral vein. Radiofrequency energy was continuously delivered to circumferentially encircle the ipsilateral superior and inferior pulmonary veins (PVs), and the end point was the elimination or dissociation of all PV potentials. When non-PV foci were identified, ablation of the earliest activation sites was performed. Additional LA linear ablation was performed at the discretion of the operator after PV isolation. External cardioversion was performed to restore sinus rhythm if RFCA failed to convert AF.
2.3 Echocardiography
On the next day after RFCA, 2D echocardiographic images were obtained in sinus rhythm, which were used as the baseline echocardiographic data. Serial echocardiographic examinations were performed at 1, 3, 6, and 12 months and then every 6 months after RFCA. We retrospectively recorded the LAD at baseline and at 1, 3, 6, 12, 18, 24, 30 and 36 months after RFCA. The 2D echocardiographic examinations were performed using a commercially available ultrasound scanner (Vivid 7 or 9, General Electric Medical Health, Waukesha, WI, USA) with a 2.5-MHz phased-array transducer. LAD was obtained as an anteroposterior diameter in the parasternal long axis view according to the guidelines of the American Society of Echocardiography.[9]
2.4 Follow-up and definition of recurrence
Follow-up was conducted at 1 week, 1 month, 3 months, 6 months, and 12 months and then every 3–6 months and whenever required because of AF symptoms. Serial 12-lead electrocardiograms and a 24-h Holter ambulatory electrocardiogram were recorded after RFCA and when patients exhibited symptoms of palpitation. Recurrence was defined if patients experienced self-reported typical palpitation episodes (> 30 s) or atrial tachyarrhythmia on a 12-lead electrocardiogram, Holter monitoring, or pacemaker/im-plant-able cardioverter-defibrillator interrogation (where available) during a follow-up visit. We defined success as no AF recurrence without antiarrhythmic drugs 3 years after RFCA; other outcomes were defined as failure.
2.5 Statistical analysis
Continuous variables are presented as mean ± SD and categorical variables as absolute numbers and percentages. We divided baseline LAD into three groups as ≤ 38 mm, 38–50 mm and ≥ 50 mm. A chi-square test was used for categorical variables. Avalue of less than 0.05 was considered statistically significant. To analyze changes in LAD over time, we drew a scatter plot and superimposed a locally weighted regression (lowess) smoothed curve to characterize the LAD trend. Because of missing data and consequences of observed repeated measures, the mixed-effect model of the longitudinal data was employed to obtain the true underlying LAD trend. This was called the first-stage model. The Akaike information criterion (AIC) and the likelihood ratio test were used to identify the appropriate mean model. The true (predicted) value of the LAD was obtained using the best linear unbiased predictor. The logistic regression using the true underlying LAD was then used to predict the status of AF three years after RFCA. This was called the second-stage model.[10]A stepwise selection method was employed to identify independent predictors in the logistic regression. The odds ratio and 95% CI were calculated for each variable. The receiver operating characteristic (ROC) curve and the area under the ROC curve (AUC) were used to assess the performance of the different models. The goodness-of-fit for the logistic regression model was assessed through the Hosmer and Lemeshow test. Statistical analyses were performed using the SAS software version 9.4 (SAS institute Inc., Cary, NC, USA).
3 Results
3.1 Patient characteristics
The clinical characteristics of the patients are presented in Table 1. Our study population comprised 263 patients (mean age 58.97 ± 11.83 years, 67.68% men, and 81.37% paroxysmal AF). There were 197 patients who underwent only one RFCA procedure (74.9%). The success rate of RFCA was 77.19 % (= 203) at the 3-year follow-up. As indicated in Table 1, there were significant differences in the percentage of paroxysmal AF (< 0.001) and success rate (< 0.001) among the three baseline LAD groups. That is, the smaller the LAD, the lower rate of AF recurrence after RFCA.
3.2 Longitudinal trend in LAD (the 1st Stage)
The lowess smoothed curve indicated that the LAD declined over the three months after RFCA and remained stable thereafter (Figure 1). When the baseline LAD was divided into three groups (Figure 2), the lowess smoothed curves demonstrated that the larger the baseline LAD, the steeper the curve in the first three months after RFCA. In addition, the lowess smoothed curves showed early LAD decline in both RFCA success and failure groups (Figure 3).
From the lowess curves, AIC and likelihood ratio test, we selected the piecewise linear mixed model to model the mean LAD over time. In particular, we divided the time axis into two segments; each segment had a different slope, but the segments were joined at three months after RFCA. This allowed the mean response to decrease or increase as time proceeds depending on the slopes of the segment. In Figure 2, the longitudinal trend in LAD was influenced by the baseline LAD, which was regarded as a controlled variable in the model. Lettbe the time (in months) after RFCA. To define the slope differently after 3 months, we defined (t-3)+as follows:
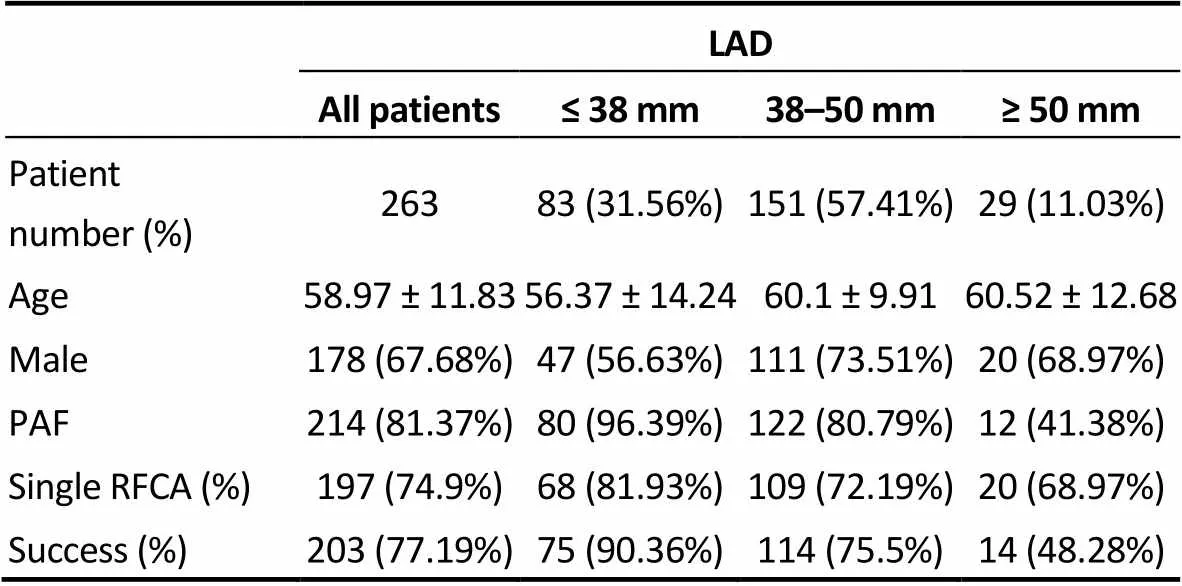
Table 1. Clinical characteristics of patients.
LAD: left atrial diameter; PAF: paroxysmal atrial fibrillation; RFCA: radiofrequency catheter ablation.
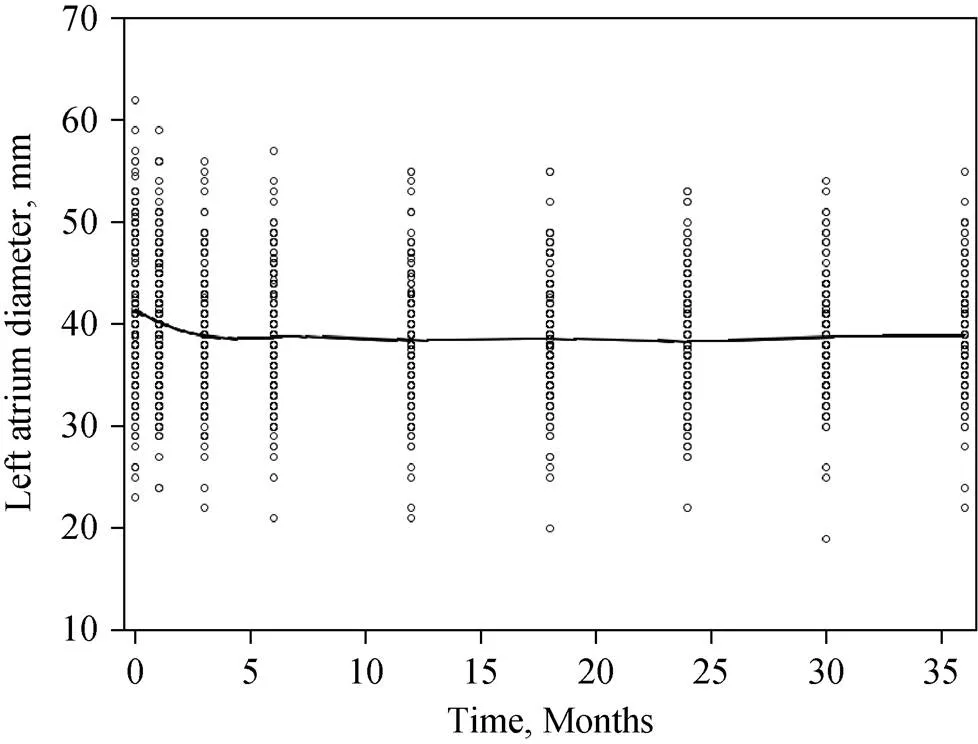
Figure 1. Longitudinal trend in LAD. The lowess smoothed curve of LAD declined over the first 3 months after radiofrequency catheter ablation and then remained stable for up to 3 years. LAD: left atrial diameter.
Figure 2. Longitudinal trend in left atrial diameter (LAD) in 3 subgroups according to the LAD size. The lowess smoothed curve was influenced by the baseline LAD. When the baseline LAD was ≥ 50 mm, the curve was steepest with a largest LAD reduction (from 49 mm to 44 mm); when the baseline LAD was ≤ 38 mm, the curve was almost flat. LAD: left atrial diameter.

where (t-3)+represents the time that had passed since three months after RFCA. LetYdenote the LAD of the-th patient at thettime point andlabasebe the baseline LAD of the-th patient. The piecewise linear model that describes the meanY(E[Y]) attcan be represented as in the fol-lowing equation:
Figure 3. Longitudinal trend in LAD in both RFCA success (black line) and failure (dashed line) groups. In the success group, the lowess smoothed curve of LAD declined in the first 3 months and then remained stable up to 36 months. In the failure group, the lowess smoothed curve of LAD declined in the first 3 months, followed by a “hump”, then declined again since 8 months and remained stable after 12 months. LAD: left atrial diameter.
[Y] =1+2labase+3t+4(t-3)++
5labase′ t+6labase(t-3)+
where1,2,3,4,5, and6denote the regression coefficients. In particular,3+5labaseis the mean slope of the LAD versus time curve for the-th patient in the first three months after RFCA. (3+4)+(5+6)labaseis the mean slope of the LAD versus time curve for the-th patient from 3 months to 36 months after RFCA.
The estimates of these coefficients are presented in Table 2. The estimates of3and5were 1.176 and-0.045. This means that the baseline LAD significantly influenced the mean response curve of the LAD during the first 3 months after RFCA. When the baseline LAD value was larger, the slope of the LAD response curve was steeper. For instance, for patients with a baseline LADs of 35, 45, and 55 mm, the corresponding slopes were-0.399,-0.849 and-1.299, respectively. Furthermore, the estimates of4and6were-1.039 and 0.041. This means that the decreasing trend became less pronounced over time. Nevertheless, the baseline LAD still significantly influenced the mean response curve of LAD after 3 months post-RFCA. Again, for patients with a baseline LADs of 35, 45, and 55 mm, the slopes were-0.003,-0.043 and-0.083, respectively. The best linear unbiased predictor was then used to predict the actual LAD at three years after RFCA for each patient. In our study, we let the estimates of parameter intercept,tand (t-3)+vary randomly among individuals.
3.3 Logistic regression (the Second Stage)
Three logistic regression models based on (1) the base- line LAD (Model 1), (2) the actual (predicted) LAD at three years after RFCA (Model 2), and (3) the observed LAD (Model 3) at three years after RFCA were constructed to compare their power to predict AF recurrence at three years after RFCA, controlling for sex, type of AF, age, and number of operations. The results showed that type of AF, LAD and sex were significant variables in predicting the status of AF three years after RFCA. Tables 3–5 represents the result of Models 1 to 3. According to the odds ratios of these models, female patients, non-paroxysmal AF and a larger baseline LAD had a significantly lower success rate at three years after RFCA. The AUC was 0.747, 0.802, and 0.789 in Models 1, 2 and 3, respectively; and thevalues of Hosmer and Lemeshow test was 0.8096, 0.6328 and 0.4175 in Models 1, 2 and 3, respectively. Because Model 2 had a largest AUC among the three models, it suggests that the actual (predicted) LAD at 3 years after RFCA was optimal for predicting the long-term RFCA outcome.
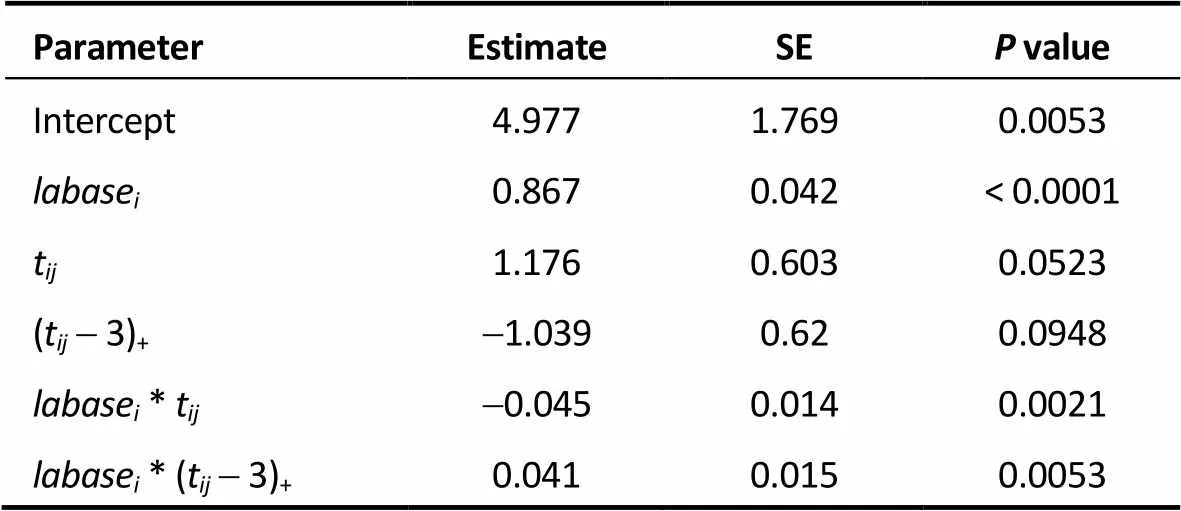
Table 2. Piecewise linear mixed model of LAD.
LAD: left atrial diameter; SE: standard error; labase: baseline LAD; t: time (in month) after radiofrequency catheter ablation; (t-3)+: time that had passed since 3 months after radiofrequency catheter ablation;labase*t: interaction betweenlabaseandt;labase* (t-3)+: interaction betweenlabaseand (t-3)+.

Table 3. Model 1.
SE: standard error; OR: odds ratio; CI: confidence interval; PAF: paroxys-mal atrial fibrillation;labase: baseline left atrial diameter.
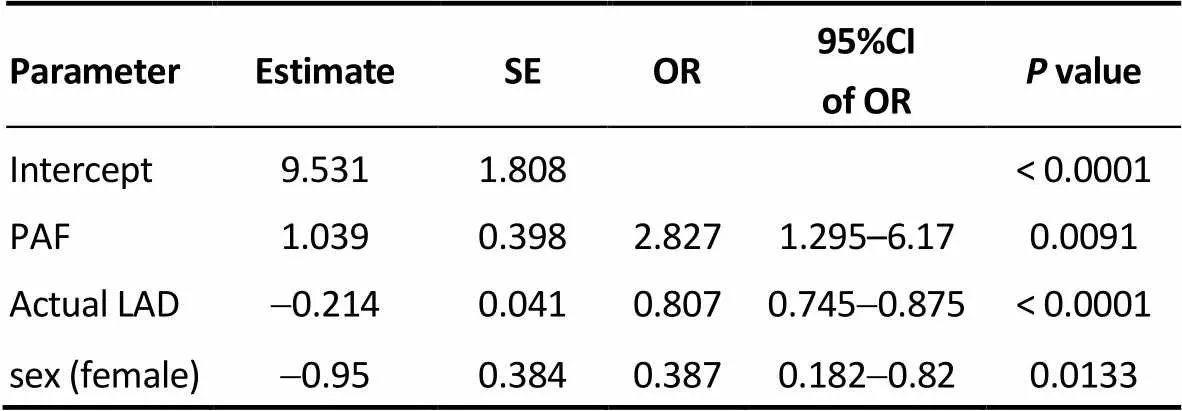
Table 4. Model 2.
CI: confidence interval; Actual LAD: actual left atrial diameter at 3-year after radiofre-quency catheter ablation; OR: odds ratio; SE: standard error; PAF: paroxysmal atrial fibrillation.

Table 5. Model 3.
SE: standard error; OR: odds ratio; CI: confidence interval; PAF: paroxys-mal atrial fibrillation; observed LAD: observed left atrial diameter at 3-year after radiofrequency catheter ablation.
4 Discussion
In this study, we demonstrated that (1) the longitudinal study using a two-stage model has a higher predictive power than the logistic models which only used the baseline LAD or the observed LAD at three years after RFCA; and (2) non-paroxysmal AF, larger LAD and female gender were significant predictors of AF recurrence three years after RFCA. We first obtained the actual (predicted) LAD three year after RFCA using a linear mixed model, which assumed that longitudinal responses depend on a combination of population effects and subject-specific effects. Subsequently, we employed the actual (predicted) LAD value as a time-dependent covariate in the logistic regression to predict the status of AF. The lowess smoothed curves showed LAD declined in the first 3 months after RFCA, and the degree of LAD reduction was significantly influenced by the baseline LAD.
Reant,.[11]demonstrated that LAD had decreased significantly with 2 phases at the 1 year follow-up echocardiographic analysis after ablation. The reduction of LAD occurred during the first phase (0 to 3 months), and then remained stable during the second phase (3 to 12 months). Consistently, our results revealed that LAD declined in the first three months after RFCA, and remained stationary for up to three years regardless of the RFCA outcome. When the baseline LAD factor was considered, the time factor was found to play a role only because of its interaction with the baseline LAD. That is, RFCA results in reduction in the LAD, and this reduction is proportionate to the baseline LAD.
In a meta-analysis, D’Ascenzo,.[12]demonstrated that valvular AF, LAD > 50 mm and recurrence within 30 days were the most powerful predictors of AF ablation failure. Our data evinced that the success rate was only 48.28 % when the LAD > 50 mm, much lower than that for the LAD < 38 mm (90.36 %). AF-induced atrial remodeling includes atrial enlargement, contractility impairment, and altered compliance, and reverse remodeling may occur whenever AF is successfully eliminated.[13,14]However, the reversal of LA dilation after RFCA is achieved not only by a reduced AF burden, but also the RFCA-produced scar. Many studies have attempted to identify the association between the change in LAD and the status of AF after RFCA, with inconsistent results.[4,5]One study reported that LAD was reduced only in the success group,[15]but other studies reported that LAD was reduced significantly after RFCA whether AF recurred or not.[16,17]Our results revealed that LAD was reduced in both the success and failure groups. It seems that LAD reduction itself is not a sufficient indicator of RFCA success.
In addition to the widely used baseline LAD value, we employed a two-stage model with the actual (predicted) LAD at three years after RFCA to predict the RFCA outcome, and this model was demonstrated to outperform the logistic model using the baseline LAD based on the AUC. The two-stage model can be easily applied in clinical practice. When the baseline LAD is obtained, we can utilize the piecewise linear model to calculate the mean actual (predicted) LAD three years after RFCA. For example, the calculated mean actual (predicted) LAD three years after RFCA are 34, 40, and 46 mm when the baseline LAD values are 35, 45, and 55 mm, respectively. Then, we can employ the mean actual (predicted) LAD value, type of AF and gender to fit Model 2 for calculating the mean probability of successful RFCA status at three years after ablation. In the setting of paroxysmal AF and male gender, the mean probabilities of a 3-year RFCA success rate are 96%, 88%, and 67% when the baseline LADs are 35, 45, and 55 mm, respectively. If the setting is changed to non-paroxysmal and female gender, the mean probabilities of a 3-year RFCA success rate are 78%, 50%, and 22% when the baseline LADs are 35, 45, and 55 mm, respectively. The simplicity of Model 2 makes it highly generalizable to a wide variety of populations undergoing RFCA for AF. The two-stage model also provides more accurate information for clinicians and patients to evaluate the necessity of long-term anti-arrhythmic drug or anticoagulant use after AF ablation.
4.1 Limitations
This study was limited by its observational, retrospective design. This was a single-tertiary center study with a limited sample size. Therefore, additional studies with larger samples are needed to confirm our findings. In addition, AF recurrence required ambulatory electrocardiogram documentation at specific time points or when patients exhibited with symptoms; therefore, patients with asymptomatic AF between visits may not have been identified. This may have resulted in an underestimation of the risk of AF recurrence.
4.2 Conclusions
The longitudinal study-based two-stage model had a higher predictive power than the logistic model that included only the baseline LAD. The degree of LAD reduction mainly depends on the baseline LAD, regardless of the RFCA outcome. Non-paroxysmal AF, larger LAD and female gender are significant predictors of AF ablation failure.
Acknowledgements
The authors declare that there are no conflicts of interest regarding the publication of this paper.
1 Vaziri SM, Larson MG, Benjamin EJ, Levy D. Echocardiographic predictors of nonrheumatic atrial fibrillation. The Framingham Heart Study.1994; 89: 724–730.
2 McCready JW, Smedley T, Lambiase PD,. Predictors of recurrence following radiofrequency ablation for persistent atrial fibrillation.2011; 13: 355–361.
3 Miyazaki S, Kuwahara T, Kobori A,. Preprocedural pre-dictors of atrial fibrillation recurrence following pulmonary vein antrum isolation in patients with paroxysmal atrial fibril-lation: long-term follow-up results.2011; 22: 621–625.
4 Jeevanantham V, Ntim W, Navaneethan SD,. Meta- analysis of the effect of radiofrequency catheter ablation on left atrial size, volumes and function in patients with atrial fibrillation.2010; 105: 1317–1326.
5 Xiong B, Li D, Wang J, Gyawali L,. The effect of catheter ablation on left atrial size and function for patients with atrial fibrillation: an updated meta-analysis.2015; 10: e0129274.
6 van der Krieke L, Blaauw FJ, Emerencia AC,. Temporal dynamics of health and well-being: A crowdsourcing approach to momentary assessments and automated generation of per-sonalized feedback.2017; 79: 213–223.
7 Hwang YT, Tsai HY, Chang YJ,. The joint model of the logistic model and linear random effect model - An application to predict orthostatic hypertension for subacute stroke patients.2011; 55: 914–923.
8 Tsiatis A, Degruttola V, Wulfsohn M. Modeling the relationship of survival to longitudinal data measured with error. Applications to survival and CD4 counts in patients with AIDS.1995; 90: 27–37.
9 Lang RM, Bierig M, Devereux RB,. Recommendations for chamber quantification: a report from the American Society of Echocardiography's Guidelines and Standards Committee and the Chamber Quantification Writing Group, developed in conjunction with the European Association of Echocardiography, a branch of the European Society of Cardiology.2005;18: 1440–1463.
10 Fitzmaurice GM, Laird NM, Ware JH. Applied longitudinal analysis: John Wiley & Sons, 2012.
11 Reant P, Lafitte S, Jais P,. Reverse remodeling of the left cardiac chambers after catheter ablation after 1 year in a series of patients with isolated atrial fibrillation.2005; 112: 2896–903.
12 D'Ascenzo F, Corleto A, Biondi-Zoccai G,. Which are the most reliable predictors of recurrence of atrial fibrillation after transcatheter ablation? a meta-analysis.2013; 167: 1984–1989.
13 Yang CH, Chou CC, Hung KC,. Comparisons of the underlying mechanisms of left atrial remodeling after repeat circumferential pulmonary vein isolation with or without additional left atrial linear ablation in patients with recurrent atrial fibrillation.2017; 228: 449–455.
14 Kuppahally SS, Akoum N, Badger TJ,. Echocardiographic left atrial reverse remodeling after catheter ablation of atrial fibrillation is predicted by preablation delayed enhancement of left atrium by magnetic resonance imaging.2010; 160: 877–884.
15 Tops LF, Bax JJ, Zeppenfeld K,. Effect of radiofre-quency catheter ablation for atrial fibrillation on left atrial cavity size.2006; 97: 1220-1222.
16 Toplisek J, Pernat A, Ruzic N,. Improvement of atrial and ventricular remodeling with low atrial fibrillation burden after hybrid ablation of persistent atrial fibrillation.2016; 39: 216–224.
17 Pump A, Di Biase L, Price J. Efficacy of catheter abla-tion in nonparoxysmal atrial fibrillation patients with severe enlarged left atrium and its impact on left atrial structural re-modeling.2013; 24: 1224–1231.
Chung-Chuan Chou, MD, Division of Cardiology, Department of Internal Medicine, Chang Gung Memorial Hospital, 199 Tung Hwa North Road, Chang Gung Memorial Hospital, Taipei 10591, Taiwan, China. E-mail: 2867@cgmh.org.tw
Telephone: +886-3-3281200-8119
Fax: +886-3-3289134
January 6, 2018
April 16, 2018
April 16, 2018
July 28, 2018
 Journal of Geriatric Cardiology2018年7期
- Journal of Geriatric Cardiology的其它文章
- Single-territory incomplete surgical revascularization improves regional wall motion of remote ventricular areas: results from a propensity-matched study
- Particular evolution in a 72-year-old diabetic patient with acute coronary syndrome
- Management of hypertensive crises in the elderly
- C-reactive protein aggravates myocardial ischemia/reperfusion injury through activation of extracellular-signal-regulated kinase 1/2
- Prognostic utility of NT-proBNP greater than 70,000 pg/mL in patients with end stage renal disease
- The effectiveness and safety of the RESTORE? drug-eluting balloon versus a drug-eluting stent for small coronary vessel disease: study protocol for a multi-center, randomized, controlled trial
