Measurement of Attenuation of Ultrasonic Propagating through the Thin Layer Media with Time Delay Spectrum
WANG Xingguo , CHANG Junjie, SHAN Yingchun, TIE Shaodong, YAO Man and XU Jiujun, *
1 School of Materials Science and Engineering, Dalian University of Technology, Dalian 116024, China
2 Transportation & Logistics Engineering College, Dalian Maritime University, Dalian 116026, China
1 Introduction
When ultrasonic travels through a media, sound pressure diminishes with distance. This phenomenon is termed as ultrasonic attenuation. To ideal materials, reduction of sound pressure is related to the propagation distance of the wave. However, to natural materials, there are three causes leading to ultrasonic attenuation[1]: acoustic beam diffusion,scattering, and media absorption.
There are two methods for representing ultrasonic attenuation[2–4]: The first is to introduce multiple reflections at the end of wave. As a matter of fact, the number of bottom reflected waves are observed with the same sensitivity of the testing device under the same thickness of different materials. The more bottom reflected waves, the less sound attenuation in the material. But this method can only approximately estimate attenuation value during the propagation in the different materials. The second is to quantitatively measure the attenuation coefficient by theoretical calculation, which is used to denote the decrement of sound pressure. However, the latter needs to accurately measure the maximum amplitude of the each interfacial echo. It has brought another problem that the measured material should be thick enough to separate multiple reflections. The conventional ultrasonic methods such as the pulse-echo are used to test properties of material with a certain thickness[5–6]. Unfortunately, it is helpless for the thin layer media when they are very thin or have a heterogeneous interface. The mutual superposition of ultrasonic echo derived from the different interfaces makes it difficult to extract the attenuation coefficient by conventional ultrasonic methods. For example, the minimum thickness of thin layer media which can be detected by 1 MHz excitation frequency is about 4 mm.
In this paper, the acoustic characteristics of the thin layer of rubber were evaluated, 0.6 mm in simulation and 1 mm in experiment. An analytical equation was established by the pertinence of two echoes with the thin layer media and without the thin layer media based on time delay spectrum[7]. Acoustic characteristic parameters of the thin layer media can be obtained. Moreover, a new method was proposed to measure the attenuation coefficient of the thin layer media.
2 Ultrasonic Echo Propagation Theory
Fig. 1 shows the model of the system analyzed of ultrasonic wave propagation in the thin layer media, where x, y indicate thickness and width direction of the media,respectively. The system is composed of three medias:substrate (sound velocity v1, wave number k1, density ρ1,acoustic impedance Z1), thin layer media (sound velocity v2,wave number k2, density ρ2, acoustic impedance Z2), air(sound velocity v3, wave number k3, density ρ3, acoustic impedance Z3). The boundaries of three medias are planes parallel to each other; the thin layer media adheres perfectly to the substrate and acoustic impedance Z3of air is zero.
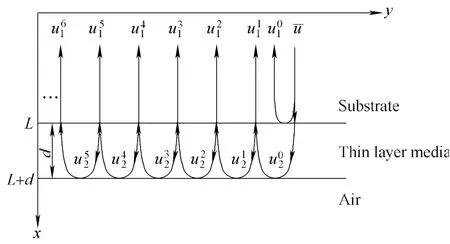
Fig. 1. Model of the system analyzed of ultrasonic wave propagation in the thin layer media
These terms are expressed according to principle of reflection and transmission as follows[8]:
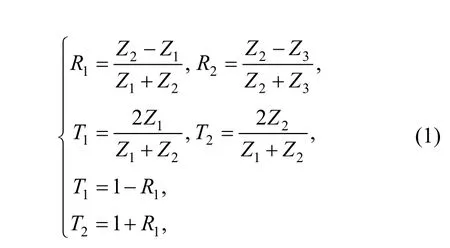
where R1—Reflection coefficients from the substrate to the thin layer media,
R2—Reflection coefficients from the air to the thin layer media,
T1—Transmission coefficients from the substrate to the thin layer media,
T2—Transmission coefficients from the thin layer media to the substrate.
Incident wave is a plane longitudinal wave, which propagates perpendicularly to the interface between the thin layer media and substrate. The equation of the incident wave is expressed as[7]

where A1—Incident wave amplitude,
ω—Angular frequency.
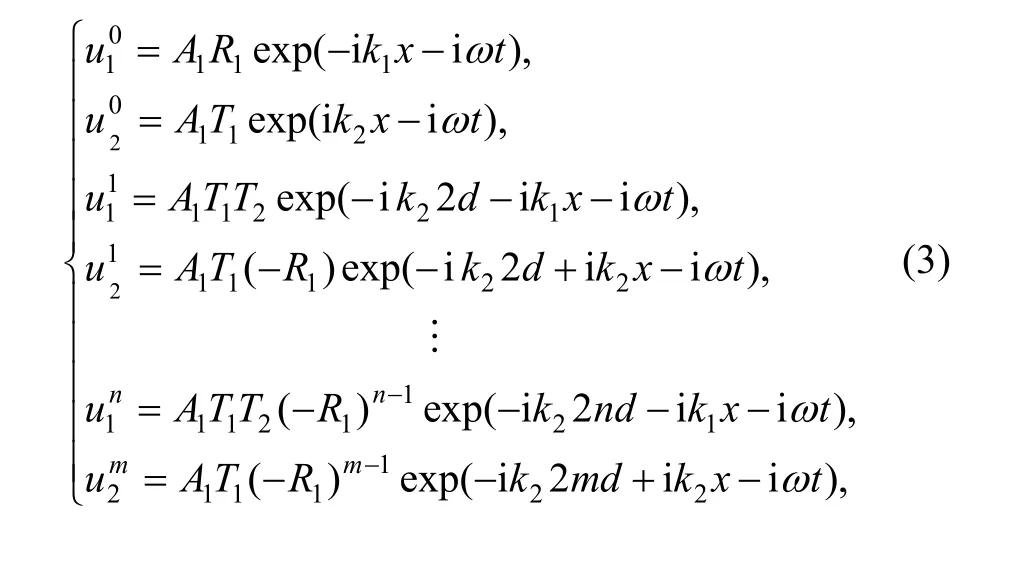
The reflection and transmission waves located at the interface between the substrate and thin layer media, where x=L, are expressed as follows:
3 Establishment of Ultrasonic Propagati on Analytical Model
3.1 Time delay cased by the thin layer media
We do not consider the attenuation coefficient in course of the propagation in the thin layer media for Eq. (3). In fact, ultrasonic energy diminishes with propagation distance. If attenuation factor was considered, the attenuation coefficient caused by the thin layer media is γ(ω) dB/cm, the amplitude of the nth multiple-reflected waveis expressed as


If A(ω)=1 (no energy is absorbed), then, and if A(ω)= 0 (total energy is absorbed), then
Without the thin layer media, a wave reflected on the interface is expressed at an arbitrary location x as[9]

where x′—Propagation distance of the boundary,x′=2L–x,
α(ω) —Attenuation coefficient of the substrate,k1—Wave number of the substrate.
When an ultrasonic incident wave arrives at the interface between the substrate and thin layer media, a part of wave is reflected on the interface firstly, with the reference to Fig. 1, the rest continues to propagate in the thin layer media according to principle of reflection and transmission.If multiple reflected waves came from the interface between the thin layer media and air superimpose successively, the total reflected waves located at the interface x=L are expressed as follows:

where k2is the wave number of the thin layer media. If we put in the above equation, the following equation holds:

where R(ω) is always real, and R(ω)=1 according to Eq. (1). Substituting Eq. (8) into Eq. (7), then

where

θ(ω) contains information on the acoustic properties of the substrate and thin layer media. We could expect to extract these properties by analyzing θ(ω), include sound velocity v2and density ρ2. Group delay time caused by the thin layer media can be derived from group delay theory. If ultrasonic energy isn’t absorbed by the thin layer media, as a result,A(ω)=1 and β=0. The group delay time due to the thin layer media is determined to be

If ultrasonic energy is absorbed by the thin layer media,the attenuation coefficient is introduced into group delay theory. The group delay time due to the thin layer media is determined to be


Two steps are carried out for the purpose of establishing relationship between the attenuation coefficient and the frequency.
(1) The measurement of the attenuation coefficient can be deduced from the time delay spectrum. The basic acoustic parameters, such as sound velocity and acoustic impedance, can be obtained by solving Eq. (10).
(2) The above parameters are introduced into Eq. (11),and relationship between the attenuation coefficient and frequency can be built by analyzing Eq. (11)
From Eq. (10), cosω?τ is a period function, and period is 2π/?τ. ?τ is two times that of ultrasonic travels in the thin layer media. ?τ is unchanged value due to fixed thickness d,ifthe periodic function ?τghas the maximum valueand the minimum value. ?τ is obtained by means of solving the maximum value or the minimum value. Sound velocity v2is determined by Eq.Acoustic impedance and density of the thin layer media are measured according toand ?τ. Elastic modulus E is determined to be

The first term of Eq. (11) represents the group delay of a reflected wave from the thin layer media. The second term to the height of a peak of group delay spectrum is considered to be small compared with the first term. As a result, the second term may be ignored for the sake of simplifying calculation.
If Z1>Z2, Z3=0, that is α<1, and β=[1–A(ω)]/[1+ A(ω)],the maximum values of ?τgare given approximately as

Especially, it is noticeable thatchanges drastically from positive to negative near the frequency in which ω is satisfied with α=β(ω). In experiment, we can calculate group delay spectrum by the complex cross-spectrum between reflected waves with and without the thin layer media. We obtainfrom the maximum of the group delay spectrum.
If Z1<Z2, Z3=0, that is α>1, and β=[1–A(ω)]/[1+A(ω)],the maximum values of ?τgare given approximately as


The attenuation coefficient changes with frequency according to Eq. (15).
3.2 Simulation results
With PZflex finite element analysis software, it was simulated that the thin layer media with thickness of 0.6 mm was tested to acquire the simulation data by ultrasonic echo. Simulation parameters of the sensor center frequency and sampling frequency are 1 MHz and 250 MHz, respectively. Fig. 2(a) shows the reflection in the thin layer media with thickness of 0.6 mm and Fig. 2(b) shows group delay frequency spectrum.
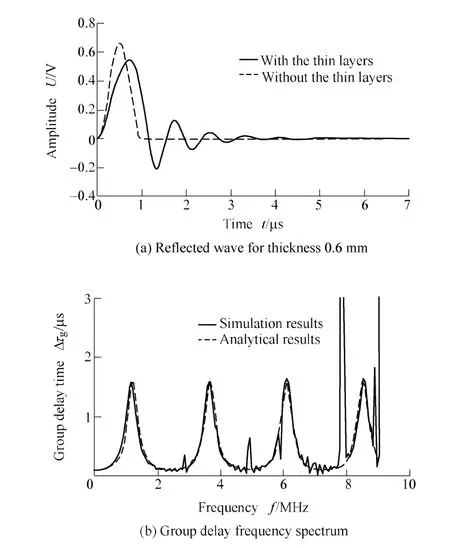
Fig. 2. Reflected wave and group delay frequency spectrum
It can be seen from Fig. 2(a) that multiple echoes reflected by the thin layer media can not be separated.Group delay spectrum is deduced by time domain signal according to Eq. (4)–Eq. (11). In Fig. 2(b), real line denotes group delay spectrum obtained by simulation test. Similarly,broken line denotes group delay spectrum obtained by Eq. (10). It can be seen from Fig. 2(b), that the simulation results are consistent with the analytical results. It is showed in Fig. 3 that the attenuation coefficients are related to the frequency on the basis of simulation results and attenuation phenomenon is not observed. It can be explained that attenuation factor is not taken into account during the propagation in the thin layer media. The maximum delay time is invariable with the change of the period.
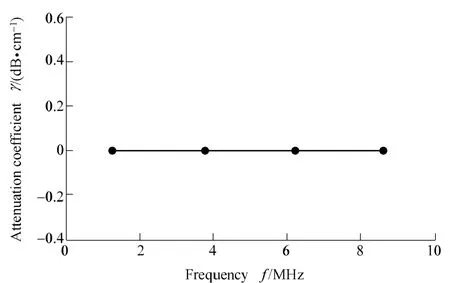
Fig. 3. Relationship between attenuation coefficient and frequency
4 Experiment and Result Analysis
In Fig. 4, ultrasonic wave experiment and analysis system is shown to test characteristics of the thin layer of rubber. Ultrasonic testing device is material superficial sound examine that is manufactured by TOSHIBA, namely,USH-B. Performance parameters of device technology:rectangle pulse, pulser/receiver of frequency spectrum 70–15 MHz, sampling rate 100 MHz. The substrate with thickness of 30 mm is crylic acid colophony and the thin layer media with thickness of 1 mm is Ethylene-Propylene-Diene-Monomer(EPDM). Coupler of the substrate and rubber is water. It is defined that the two sensors to test thin layer of rubber as A resonance sensor (center frequency 1 MHz) and B broadband sensor (bandwidth 1–8 MHz).
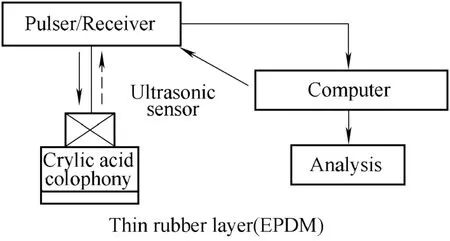
Fig. 4. Ultrasonic wave experiment and analysis system
Fig. 5 and Fig. 6 present two different sensors for detecting echoes for EPDM and group delay spectrums,respectively. Real lines indicate reflected waves with the thin layer of rubber illustrated in Fig. 5(a) and Fig. 6(a).The end of reflected waves show fine clutter due to ultrasonic multiple reflections in the thin layer media,broken lines indicate reflecting waves without the thin layer of rubber, moreover, the end of the broken lines is smoother than real line. Group delay frequency spectrum is illustrated in Fig. 5(b) and Fig. 6(b), where real lines denote group delay spectrum acquired by experiment data processing. Similarly, broken lines denote group delay spectrum acquired by Eq. (10). It can be seen from Fig. 5(b)and Fig. 6(b) that real line and broken line show periodic variation whose periods are 2π/?τ. The maximum group delay time (real lines) obtained by experiment data processing increases with the increase of frequency.According to Eq. (10), without considering attenuation factor in course of the propagation in the thin layer of rubber, the maximum group delay time (broken lines) is invariable with variety of the period. Fig. 7 shows that the attenuation coefficient changes with the frequency by the experiment results. According to comparing group delay spectrums obtained by resonant sensor (center frequency 1 MHz) with broadband sensor (bandwidth 1–8 MHz)detecting echo waveforms for EPDM, it can be inferred that the latter can reflect the change of the attenuation coefficients better. Moreover, the attenuation coefficient increases with the increase of frequency.
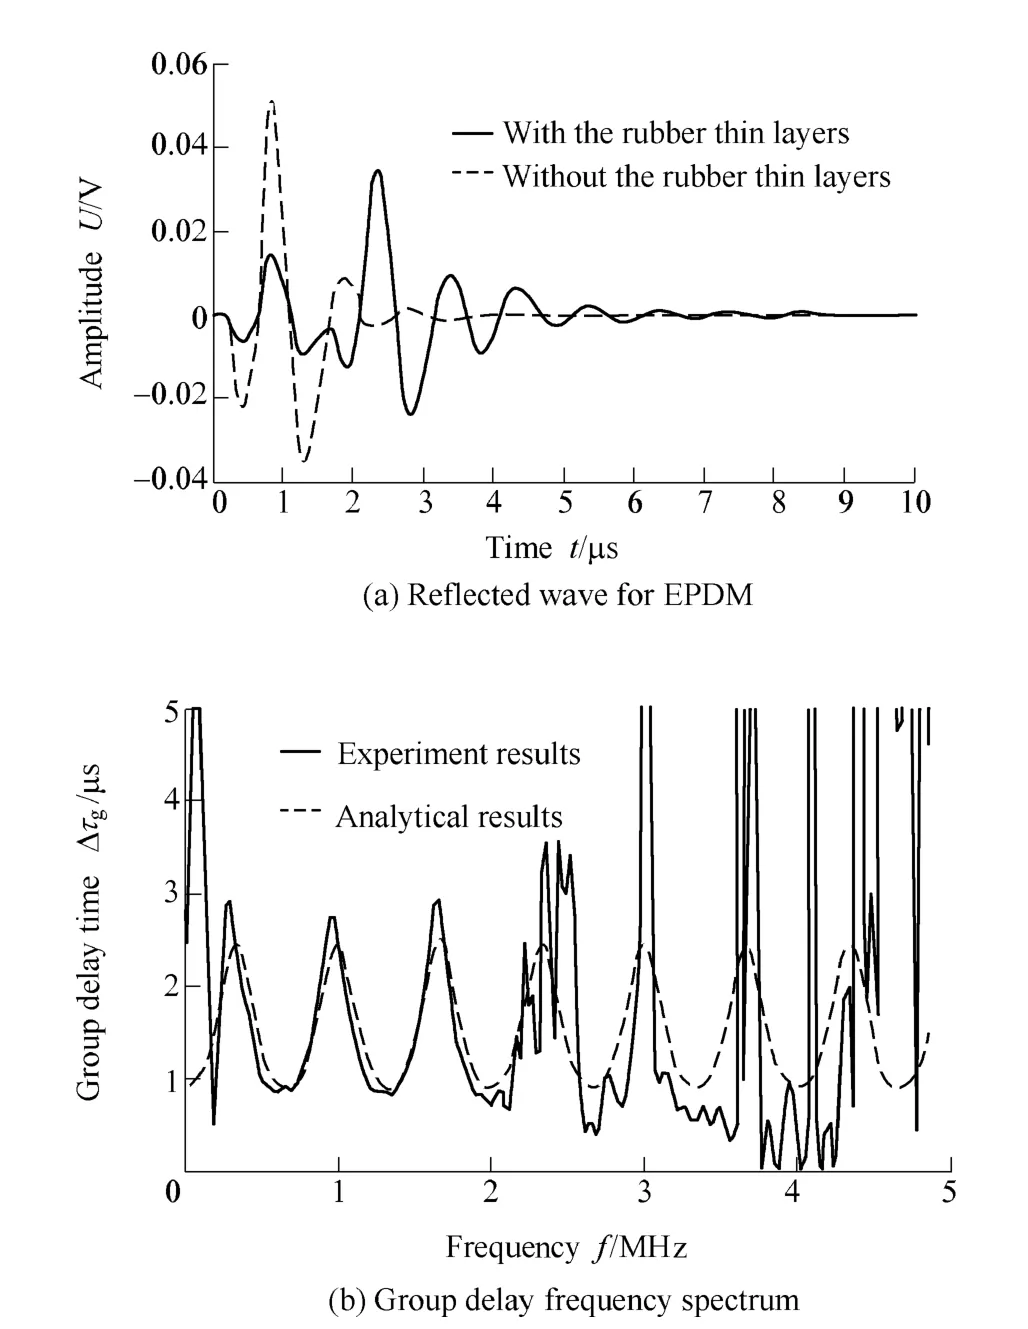
Fig. 5. Reflected wave and group delay frequency spectrum by resonance sensor with 1 MHz
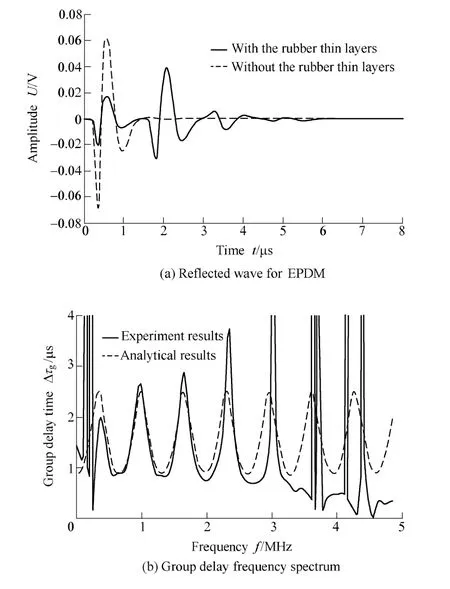
Fig. 6. Reflected wave and group delay frequency spectrum by broadband sensor with 1–8 MHz
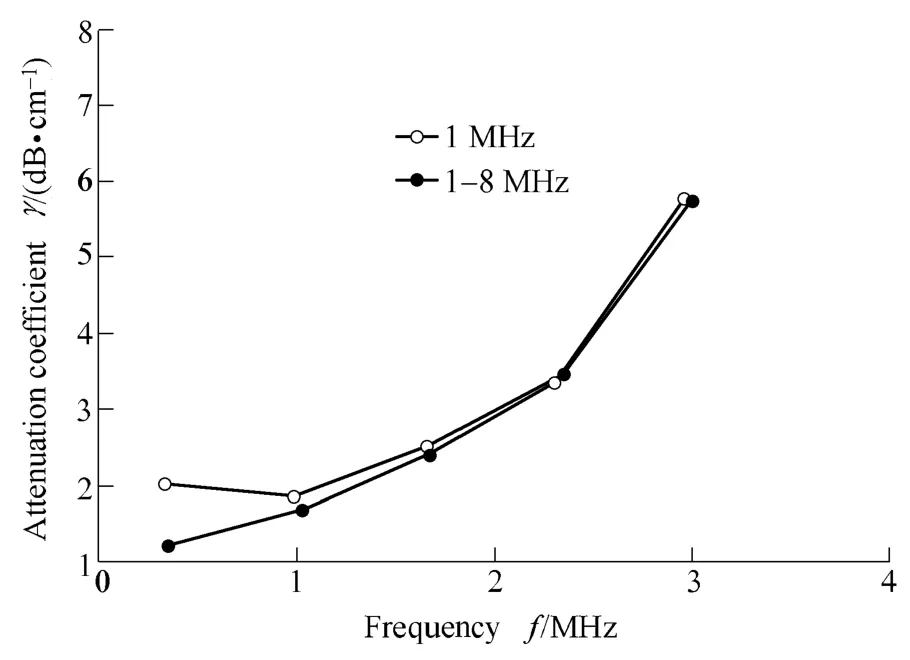
Fig. 7. Relationship between attenuation coefficient and frequency
5 Conclusions
(1) The evaluation mathematics model based on ultrasonic echo testing the thin layer media was established,which can obtain acoustic parameters of the thin layer media, such as sound velocity, acoustic impedance and density. It also reflects the relationship between the attenuation coefficient and frequency.
(2) Compared to the resonant sensor (center frequency 1 MHz), the broadband sensor (bandwidth 1–8 MHz) can obtain group delay spectrum which reflects the change of ultrasonic attenuation coefficients more accurately.Moreover, the attenuation coefficient increases with the increase of frequency.
[1] DONG Zhiyong, HU Jinbang. Researches on the evaluation of material damage using the ultrasonic wave attenuation coefficient method[J]. Chemical Engineering & Machinery, 2007, 34(4):139–143. (in Chinese)
[2] CHANG Junjie, LIN Chengxin, SUN Deping. Evaluation of rubber friction materials viscoelasticity by ultrasonic wave method[J].Lubrication Engineering, 2007, 11(32): 55–58. (in Chinese)
[3] CHE T, HO B, ZAPP H R. Impedance and attenuation profile estimation of multilayered material from reflected ultrasound[J].IEEE Trans. Instrum. Meas., 1991, 40(4): 787–794.
[4] BIRKS A S, GREEN R E. Ultrasonic testing, non-destructive testing handbook[M]. 2nd ed. New York: American Society for Nondestructive Testing Inc., 1991.
[5] KINRA V K, IYER V R. Ultrasonic measurement of the thickness,phase velocity, density or attenuation of a thin viscoelastic plate: Part I: the forward problem[J]. Ultrasonics, 1995, 33 (2): 95–105.
[6] WU P, STEPINSKI T. Quantitative estimation of ultrasonic attenuation in a solid in the immersion case with correction of diffraction effects[J]. Ultrasonics, 2000, 38: 481–485.
[7] CHANG J J, NI Q, IWAMOTO M. Physical properties of thin layer material evaluated by ultrasonic propagation[J]. JSMS Composites,2005, 34: 196–200.
[8] BREKHOVSKIKH L M. Waves in layered media[M]. 2nd ed. New York: Academic Press, 1980.
[9] SUGASAWA S. Measurements of elastics of plasma-sprayed coatings using bulk ultrasonic pulses[J]. Japanese Journal of Applied Physics, 2004, 43: 3 109–3 114.
 Chinese Journal of Mechanical Engineering2010年1期
- Chinese Journal of Mechanical Engineering的其它文章
- Contents and Abstracts of Journal of Mechanical Engineering ISSN 0577-6686, CN 11-2187/TH*
- Effect of Air Injector on the Performance of an Air-lift for Conveying River Sand
- Analysis and Optimization on Factors Affecting Forming Quality of Half Axle Gears Warm Precision Forging
- Innovation in the Computing System of Straightening Force
- Numerical Method Based on Compatible Manifold Element for Thin Plate Bending
- Investigation on Uniaxial Tensile Instability of USIBOR1500 Steel Sheets at Elevated Temperature
