Revisiting the Seasonal Evolution of the Indian Ocean Dipole from the Perspective of Process-Based Decomposition
ZHANG Guangli, FAN Hanjie, HUANG Ke, LONG Tong, SONG Wei, and XIE Qiang
Revisiting the Seasonal Evolution of the Indian Ocean Dipole from the Perspective of Process-Based Decomposition
ZHANG Guangli1),2), *, FAN Hanjie3), HUANG Ke3), LONG Tong2), SONG Wei2), and XIE Qiang2), 4)
1),;,519082,2),,572000,3),,,510301,4),,266237,
The seasonal phase-locking feature of the Indian Ocean Dipole (IOD) is well documented. However, the seasonality tendency of sea surface temperature anomalies (SSTAs) during the development of the IOD has not been widely investigated. The SSTA tendencies over the two centers of the IOD peak in September-October-November are of different monthly amplitudes. The SSTA tendency over the west pole is small before June-July-August but dramatically increases in July-August-September. Meanwhile, the SSTA tendency over the east pole gradually increases before June-July-August and decreases since then. The growth rate attribution of the SSTAs is achieved by examining the roles of radiative and non-radiative air-sea coupled thermodynamic processes through the climate feedback-response analysis method (CFRAM). The CFRAM results indicate that oceanic dynamic processes largely contribute to the total SSTA tendency for initiating and fueling the IOD SSTAs, similar to previous studies. However, these results cannot explain the monthly amplitudes of SSTA tendency. Four negative feedback processes (cloud radiative feedback, atmospheric dynamic processes, surface sensible, and latent heat flux) together play a damping role opposite to the SSTA tendency. Nevertheless, the sea surface temperature-water vapor feedback shows positive feedback. Specifically, variations in SSTAs can change water vapor concentrations through evaporation, resulting in anomalous longwave radiation that amplifies the initial SSTAs through positive feedback. The effect of water vapor feedback is well in-phase with the monthly amplitudes of SSTA tendency, suggesting that the water vapor feedback might modulate the seasonally dependent SSTA tendency during the development of the IOD.
Indian Ocean Dipole; climate feedback-response analysis method; growth rate of the sea surface temperature anomaly; seasonally dependent sea surface temperature anomaly; water vapor feedback
1 Introduction
The Indian Ocean Dipole (IOD) is an ocean-atmosphere coupling process over the tropical Indian Ocean on interannual timescale, characterized as a zonal sea surface temperature (SST) gradient between the southeastern Indian Ocean (SEIO) off Sumatra and the tropical western Indian Ocean (WIO, Saji, 1999; Webster, 1999). The IOD can exert prominent climate impacts not only on the rim of the Indian Ocean but also over remote regions (Ashok, 2003; Guan and Yamagata, 2003; Saji and Yamagata, 2003a, 2003b; Abram, 2007; Cai, 2009, 2012;Schott, 2009; Luo, 2010; Nuncio and Yuan, 2015; Zhang and Han, 2021). Thus, gaining an improved understanding of the IOD is of considerable scientific interest and socioeconomic demand.
Oceanic dynamic processes generally play a dominant role in the development of the IOD (Li, 2002; Rao, 2002; Xie, 2002; Liu, 2011; Yang, 2015; Zhang, 2022). The Bjerknes feedback (Bjer- knes, 1969), which involves interactions between the zonal wind, SST, and thermocline depth displacement, governs the growth of the IOD. Particularly, during a positive IOD event, anomalous cool SST along the Sumatra coast induces low-level easterly wind anomalies on the equatorial Indian Ocean, lifting/depressing the thermocline in the SEIO/WIO. The lifted SEIO thermocline reinforces the SST cooling through the upwelling of cold subsurface water, contributing to the development of a positive IOD event. In addition to oceanic dynamic processes, thermodynamic feedback processes due to air-sea coupling can also contribute to the development of IOD events (Li, 2003; Liu, 2011). Through exciting wind-evaporation-SST (WES) feedback (Xie and Philander, 1994), the low-level southeasterly wind anomalies near the coast of Sumatra strengthen climatological southeasterly wind speed and al- ter surface evaporation in summer, increasing surface latent heat flux loss and cooling the SST. Li(2003) also indicated that SST anomalies (SSTAs) over the tropical Indian Ocean could induce deep convectionwhich ensures SST and cloud anomalies are in-phase over the tropical Indian Ocean. Consequently, the SST-forced cloud anomalies change the downward shortwave radiation and, in turn, dampen the SSTAs. In addition to oceanic dynamicprocesses, latent heat flux, cloud radiative effect and someother feedback processes (for instance, atmospheric dyna- mic processes, surface sensible heat flux and especially water vapor longwave effect) can also lead to changes in SSTAs (Hu, 2016) and may influence the development of the IOD. However, these processes have not been systematically studied because their contributions could not be quantified by mixed layer heat budget analysis, which mainly focuses on the oceanic processes (Kug and An, 2010; Nakazato, 2021).
The seasonality of the IOD is phase-locked to the annual cycle due to the changes in the background state of the Indian Ocean. During boreal summer and fall, when low-level southeasterly winds prevail in the southeastern Indian Ocean, the thermocline off the Sumatra becomes sufficiently shallow to establish the Bjerknes feedback. Con-sequently, the impact of oceanic dynamic is more pronounc- ed in these seasons and less efficient otherwise, which leads to the typical seasonality of the IOD that initiates in summer, peaks in autumn, and decays after winter (Schott, 2009). Anomalous latent heat flux also has a seasonally dependent effect on the IOD (Li, 2003). In summer, the latent heat flux anomalies caused by the New- tonian cooling are weak in response to the small SSTAs; thus, the parts caused by wind speed changes dominate thetotal effect and enhance the SSTAs. In the coming seasons, when SSTAs are large, the Newtonian cooling-related latent heat flux anomalies become strong and dominate the total effect, acting to suppress the SSTAs. Notably, these documented seasonal features are of the SEIO region, and the seasonality of the WIO region, which is also critical to the seasonal phase-locking of the IOD, has not been widely explored. The possibility that WIO SSTAs share similar seasonal evolution with those over the SEIO is of considerable interest. Hong(2008) and Zhang(2020) compared the evolutions of SST anomalies over the WIO and SEIO regions, showing that the warming in the WIO region emerged in June, which was earlier than the SEIO cold SST anomalies by approximately one to two months. Their results indicated that the SST anomalies in the two centers are of different growth rates; however, they have not provided a detailed physical explanation(s). That is, compared with the seasonality of the SSTAs, the seasonality of the SSTA tendency has received less attention. This tendency determines the seasonal growth rates of the IOD and should not be overlooked.
In this regard, the seasonal evolution of the IOD by conducting process-based decomposition of the changes in the SSTAs in the SEIO and WIO regions is checked by a diagnostic approach named the climate feedback-re- sponse analysis method (CFRAM, Cai and Lu, 2009; Lu and Cai, 2009). With this approach, the contributions of individual feedback processes by partial surface temperaturechanges due to radiative (, albedo, water vapor, cloud, solar radiation, and ozone) and non-radiative (oceanic/at- mospheric dynamic processes and surface heat fluxes) factors are distinguished. The CFRAM has been applied to quantify the sources of model uncertainty in greenhouse gas- induced climate warming amplitude (Hu, 2020; Fan, 2021), the impacts of dynamic processes on polar warming amplification (Lu and Cai, 2010), and relative contributions of different processes to the temperature ano- malies associated with the northern Annular Mode (Deng, 2013), El Ni?o (Hu, 2016, 2018) and monsoons (Li and Yang, 2017; Kong, 2022).
This study aims to isolate the contributions of factors that lack understanding (water vapor, atmospheric dynamic, and surface sensible heat flux) to the development of the IOD and diagnose the source of the seasonality of SSTA tendency. This paper is organized as follows. Section 2 describes the data and the applied CFRAM method. Section 3 shows the overall results, including the validity of the CFRAM calculation and the total contributions of indivi- dual processes to the IOD SSTAs. Section 4 focuses on the source of the seasonality of the SSTA tendency. Section 5 presents the summary and discussion.
2 Data and Methods
The data used for the CFRAM analysis are obtained from the fifth-generation European Centre of Medium-Range Weather Forecasts (ECMWF) atmospheric reanalysis (ERA5; Hersbach, 2020). The variables considered include surface and air temperature, specific humidity, ozone mixing ratio, cloud cover, cloud liquid/ice water content, down- ward shortwave radiation at the top of the atmosphere, surface albedo (the ratio of surface upward to surface downward shortwave radiation), and surface sensible and latent heat fluxes. Multilevel variables are defined at 19 pressurelevels from 1000 to 10hPa. All variables are available withmonthly resolution on a horizonal grid of 1?×1?, spanning from 1970 to 2018.
According to the definition of Saji. (1999), eight positive IOD years (1972, 1982, 1994, 1997, 2002, 2006, 2015, and 2018) when the September-October-November (SON for short, similar to other three-month means) Dipole Mode Index (DMI) exceeds 1 standard deviation are selected for subsequent analysis. In addition, the years whenthe absolute value of SON DMI is smaller than 1 are select- ed for constructing climatological/neutral conditions to de- rive anomalies.
The CFRAM is calculated on the basis of the total energy balance in an atmosphere-surface column that comprises multiple atmospheric layers and the surface layer. The difference in the energy balance equation between the two different mean states can be written as follows:


By substituting Eq. (2) into Eq. (1) and rearranging the terms, the following terms are obtained:


which indicates that the total temperature change can be divided into partial temperature changes due to each feedback process separately:
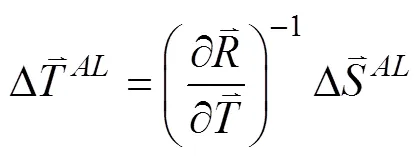


Similarly, the total effects of atmospheric dynamic pro- cesses, which include the changes in the energy flux convergence due to the energy transport by all scales of atmo- spheric motions, can be written as

with the assumption that the heat storage in the atmospheric layers is negligible.
Overall, the non-radiative term in Eq. (4) can be divided into four terms:
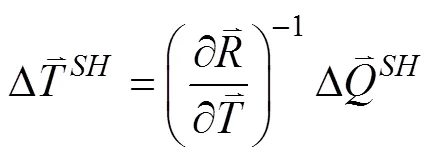


With this framework, the decomposition allows the examination of how the radiative and non-radiative thermodynamic feedbacks modify the seasonal evolution of the (positive) IOD-related SSTAs.
3 Overall Results
3.1 Seasonal Evolution of the IOD
Fig.1 displays the monthly evolution of the pIOD composite SSTAs from AMJ to SON season. In AMJ, the SSTAs over the WIO and SEIO regions are both small but are already showing trends heading for their peak state, that is, being positive over the WIO and negative over the SEIO (Fig.1a). During MJJ and June-July-August (JJA), the SSTAs over the WIO barely increase while those over the SEIO gradually increase yet only locally along the Sumatra coast (Figs.1b, c). In the following, positive SSTAsgrow off eastern Africa after July-August-September (JAS, Fig.1d) and then rapidly over the entire WIO during August-September-October (ASO) and SON (Figs.1e, f). By contrast, the negative SSTAs over the SEIO expand westward since JAS and then continue to grow in ASO and SON (Figs.1d, e, f). Both SSTAs in the WIO and SEIO ge- nerally reach their peak in SON, demonstrating seasonally dependent growth rates.
The monthly SSTA tendency from AMJ to SON distinctly shows the seasonality of the SSTA growth rate (Figs.2a–f). Positive SSTA changes over the WIO before JJA only emerge sparsely over the South Indian Ocean, where the thermocline is shallow (Xie., 2002). Positive changes over the WIO from JAS to ASO broaden and increase, prevailing over the entire WIO. As for the SEIO SSTAs, negative changes are restricted to the east of 90?E before JJA and then extend to 80?E in the following months. Notably, the magnitude of SSTA tendency gradually decreases after JJA despite the continuous growth of negative SSTAs in the SEIO before peak season. The regional means of the SSTA tendency over the WIO and SEIO (boxes in Figs.2b–f) quantitatively display the seasonally dependent growth rates in the two regions (Fig.2a). Notably, the cooling changes over the SEIO extend westward since JJA; thus, the west boundary of the SEIO (east boundary of the WIO) changes from 90?E (in Figs.2b–c, the SEIO is 90?–110?E, 15?S–0?, the WIO is 40?–90?E, 20?S–20?N) to 80?E afterward (in Figs.2d–f, the SEIO is 80?–110?E, 15?S–0?, the WIO is 40?–80?E, 20?S–20?N). Moreover, positive and negative changes in the WIO and SEIO are only considered, respectively. The WIO SSTAs generally grow slowly before JJA and then rapidly, while the growth rate of the SEIO SSTAs increases before JJA (peaks in JJA) and decreases afterward.
3.2 Attribution Analyses of the Seasonal SST Tendency
The WIO and SEIO are coupled by the Bjerknes feedback; thus, the out-of-phase growth rates over the two re- gions must be investigated. Therefore, the CFRAM is adopted to decompose the changes in the SSTAs during positive IOD years. Overall, the sum of partial temperature changes derived by the CFRAM reasonably captures the spatial patterns of the changes in pIOD-related SSTAs (Figs.3b–f). Although the sum of CFRAM-derived partial temperature changes overestimates the changes in SSTAs, especially over the regions with large changes, the regional means of monthly evolution are consistent with the observed SSTA tendency (Fig.3a), validating the CFRAM- based attribution to the seasonal evolution of the IOD.
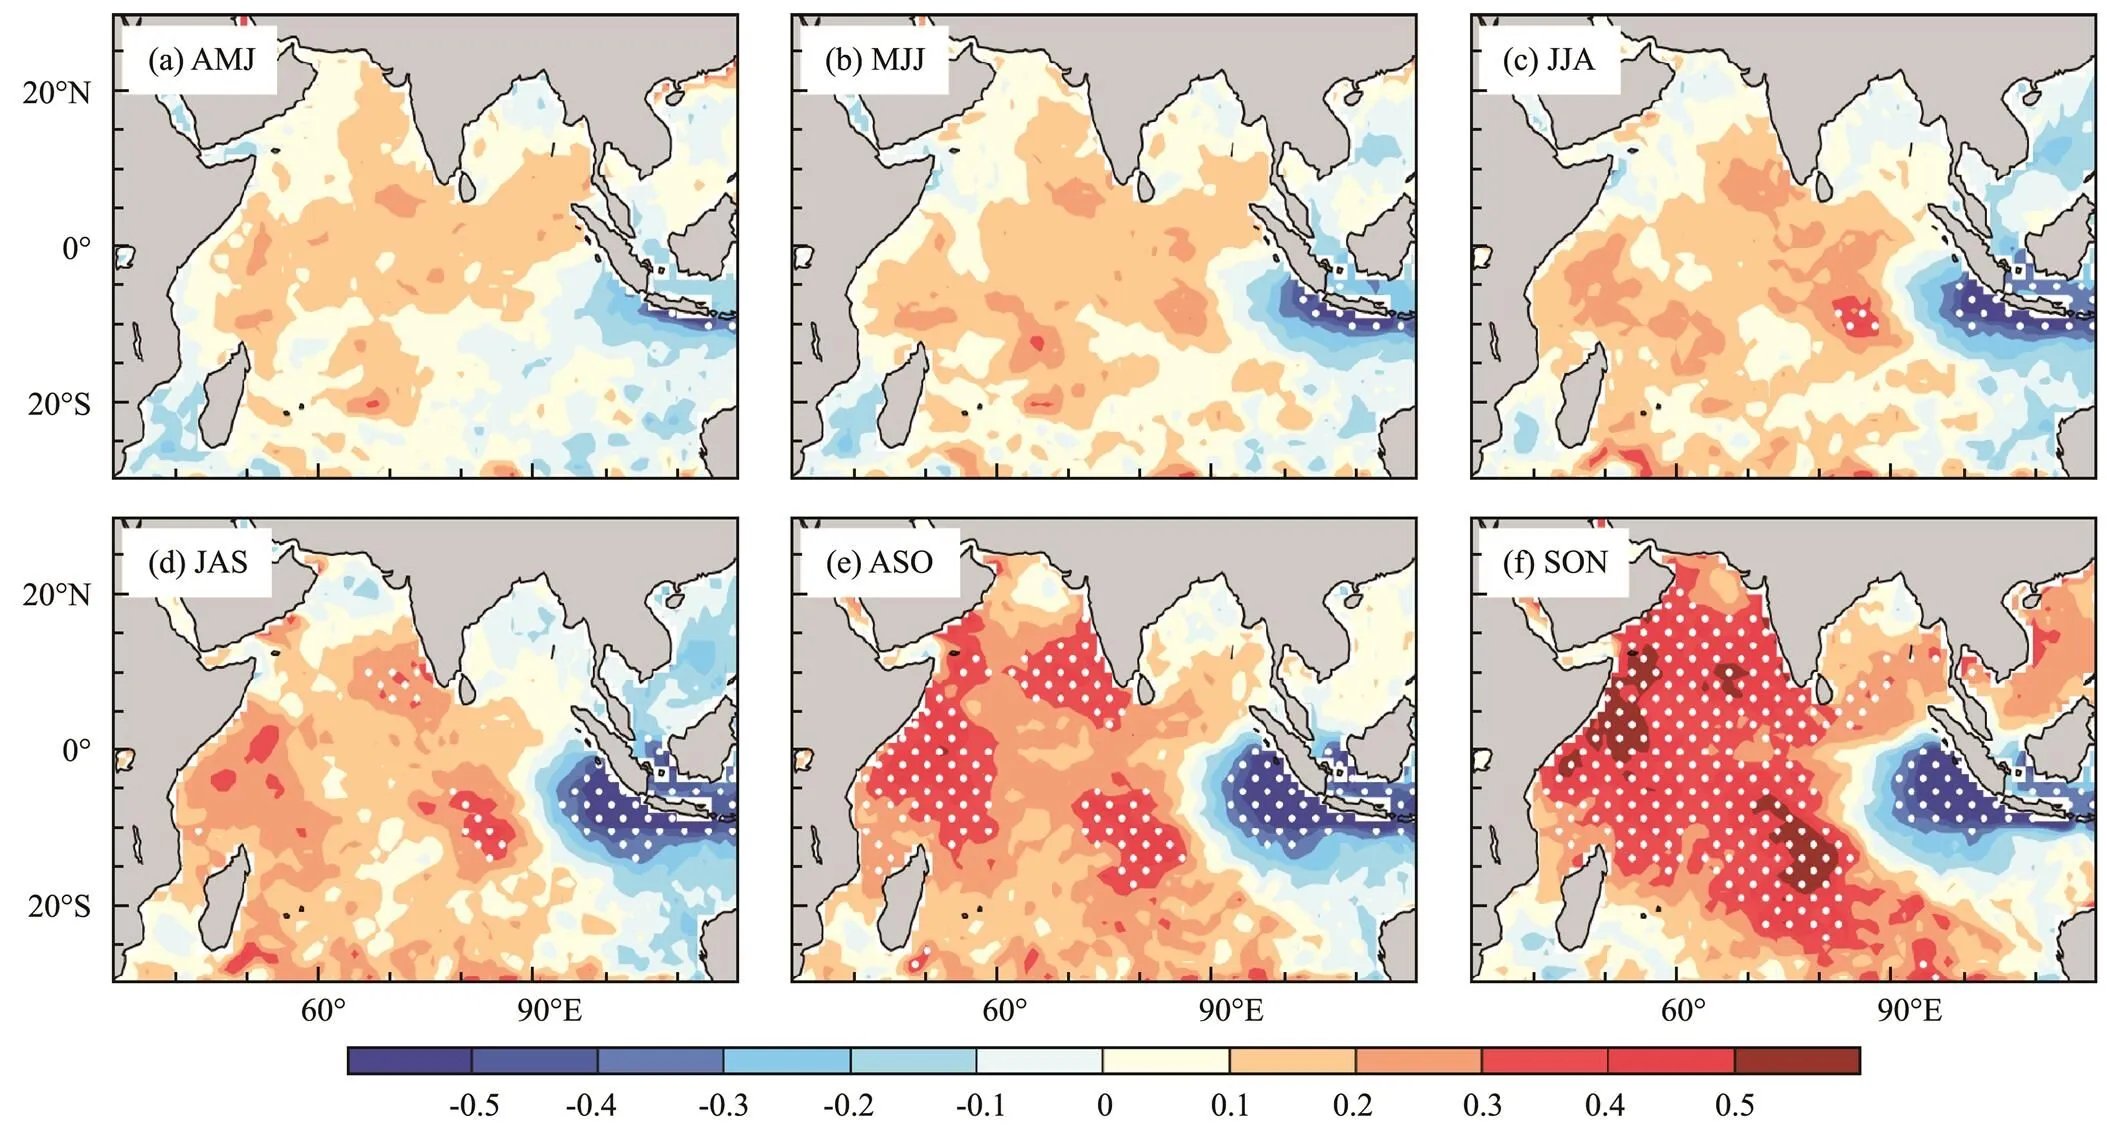
Fig.1 Monthly evolution of three-month mean sea surface temperature anomalies (SSTAs) from April-May-June to September-October-November during positive Indian Ocean Dipole (IOD) years. The dotted areas exceed the 95% significance level based on Student’s t test.
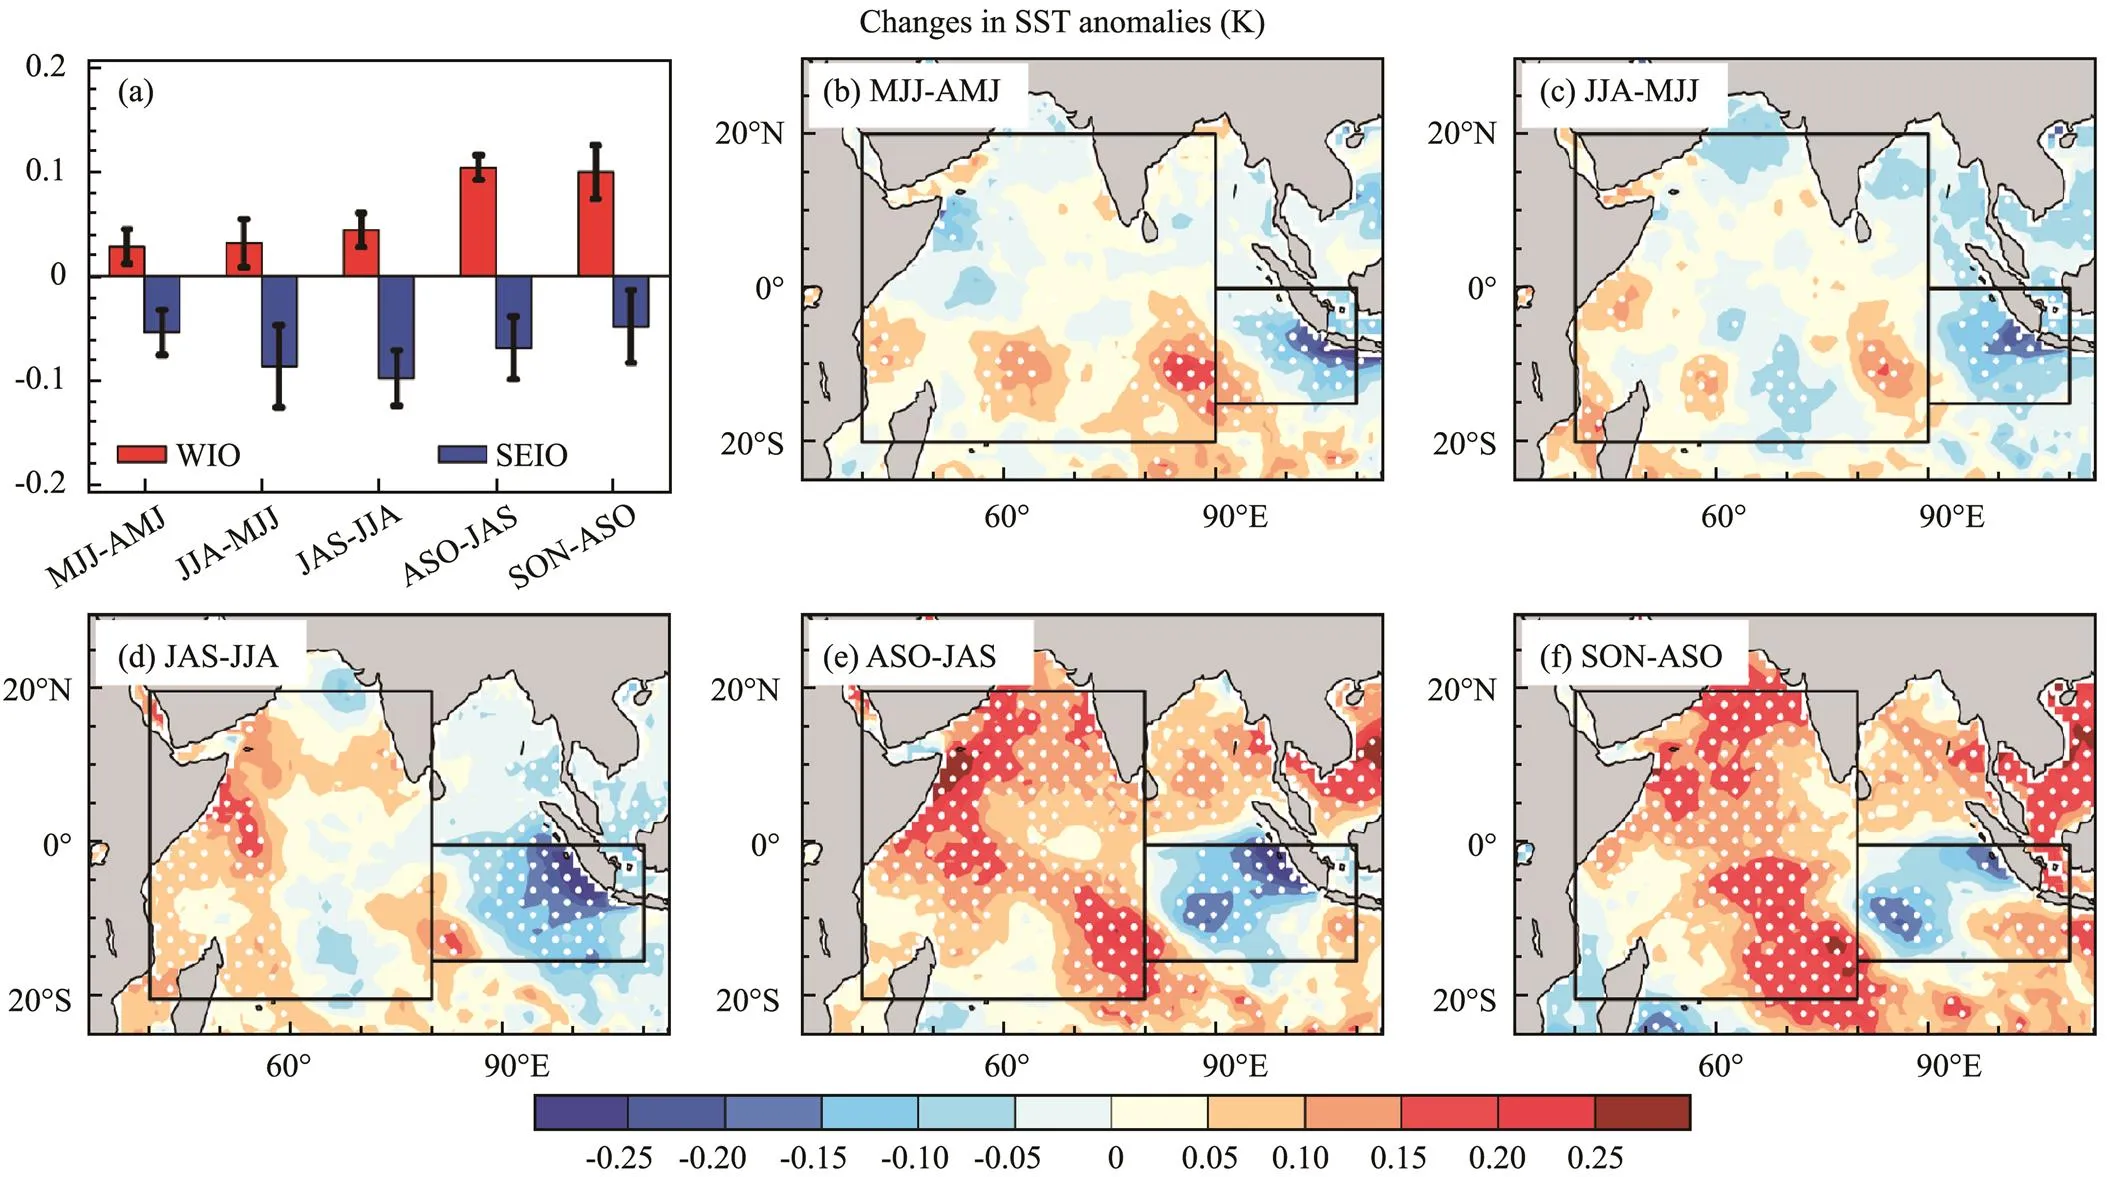
Fig.2 (a) Regional averaged values over the western Indian Ocean (WIO) and southeastern Indian Ocean (SEIO) (error bars are 0.5 standard deviations of each term). (b)–(f) are spatial patterns of the monthly changes in three-month mean SSTAs from April-May-June to September-October-November during positive IOD years. The dotted regions indicate that changes in SST anomalies exceed its 0.5 standard deviations. The black boxes indicate the locations of WIO (20?S–20?N, 40?–90?E in b–c and 20?S–20?N 40?–80?E in d–f) and SEIO (15?S–0?, 90?–110?E in b–c and 15?S–0?, 80? –110?E in d–f).
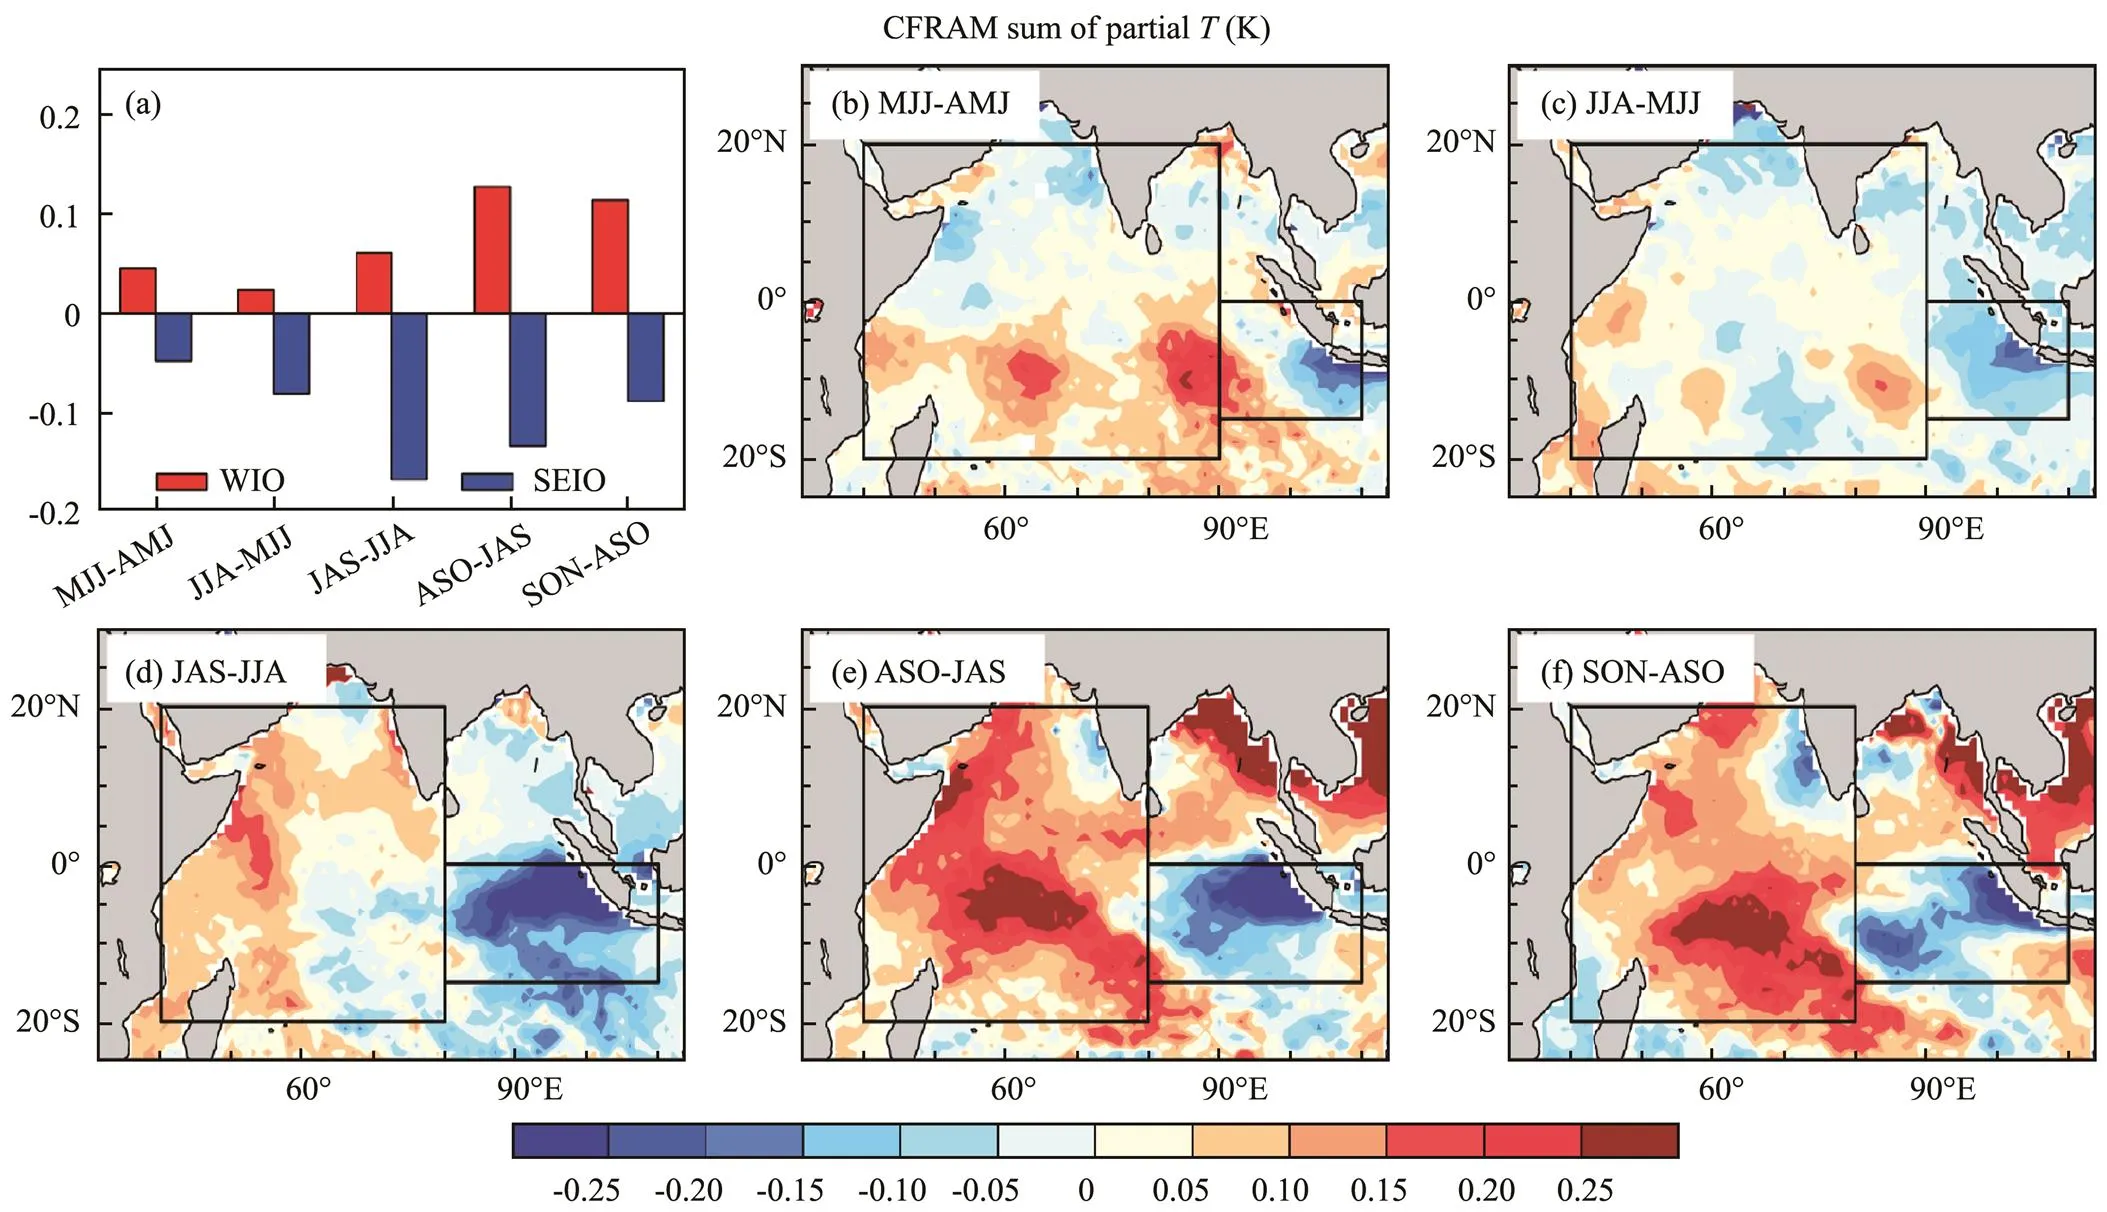
Fig.3 Similar to Fig.2, except for the sum of partial temperature derived from the climate feedback-response analysis method (CFRAM).
The total changes from AMJ to SON are also checked (Figs.4a, b) and confirm that the sum of partial temperature changes effectively reproduces the total SSTA tendency, which provides confidence for the further analysis of individual partial temperature changes. Figs.4c–h show the partial temperature changes of six main contributors to theoccurrence and development of the IOD. Notably, the partial temperature changes due to albedo, external forcing, solar radiation, and ozone are of small magnitude and not considered and shown herein. As the primary contributor, oceanic dynamic processes lead to the cooling along the Sumatra, where the mean upwelling and the thermocline feedback are strong (Fig.4c). Meanwhile, oceanic dynamic processes are also responsible for the WIO warming tendency but are of smaller intensity in comparison and main- ly over the southern Indian Ocean, where the thermocline is shallow (Xie, 2002). In previous studies, the long- wave effect of water vapor, which is suggested to play a nonnegligible role according to our result, is rarely mentioned. Specifically, water vapor feedback is the second important positive contributor, inducing uniform positive/ negative SSTA changes over the WIO/SEIO (Fig.4d). Cloud radiative feedback is the leading negative contributor, as previously indicated (Fig.4e). The negative SSTAs over the SEIO reduce cloud amounts and then increase downward shortwave radiation at the surface, thereby suppressing the negative SSTA andfor the WIO. Atmospheric dynamic processes also act to suppress the SST anomaliesthe adiabatic heating related to anomalous vertical mo- tions (Fig.4f). Of the two heat flux terms at the surface, sensible heat flux purely plays a damping role during theIOD development (Fig.4g). By contrast, the impact of latent heat flux is complicated due to the competing effects of the WES feedback-related anomalies and the New- toniancooling-related anomalies. Overall, the latent heat flux induces cooling changes at the boundary between the WIO and SEIO but warming changes along the equator and the Sumatra coast (Fig.4h). However, providing the details of total changes in the evolution of IOD events is difficult, especially for the aforementioned complicated contributionfrom latent heat flux. The relative contribution of individual terms to the seasonality of the IOD development will be checked in the following section.
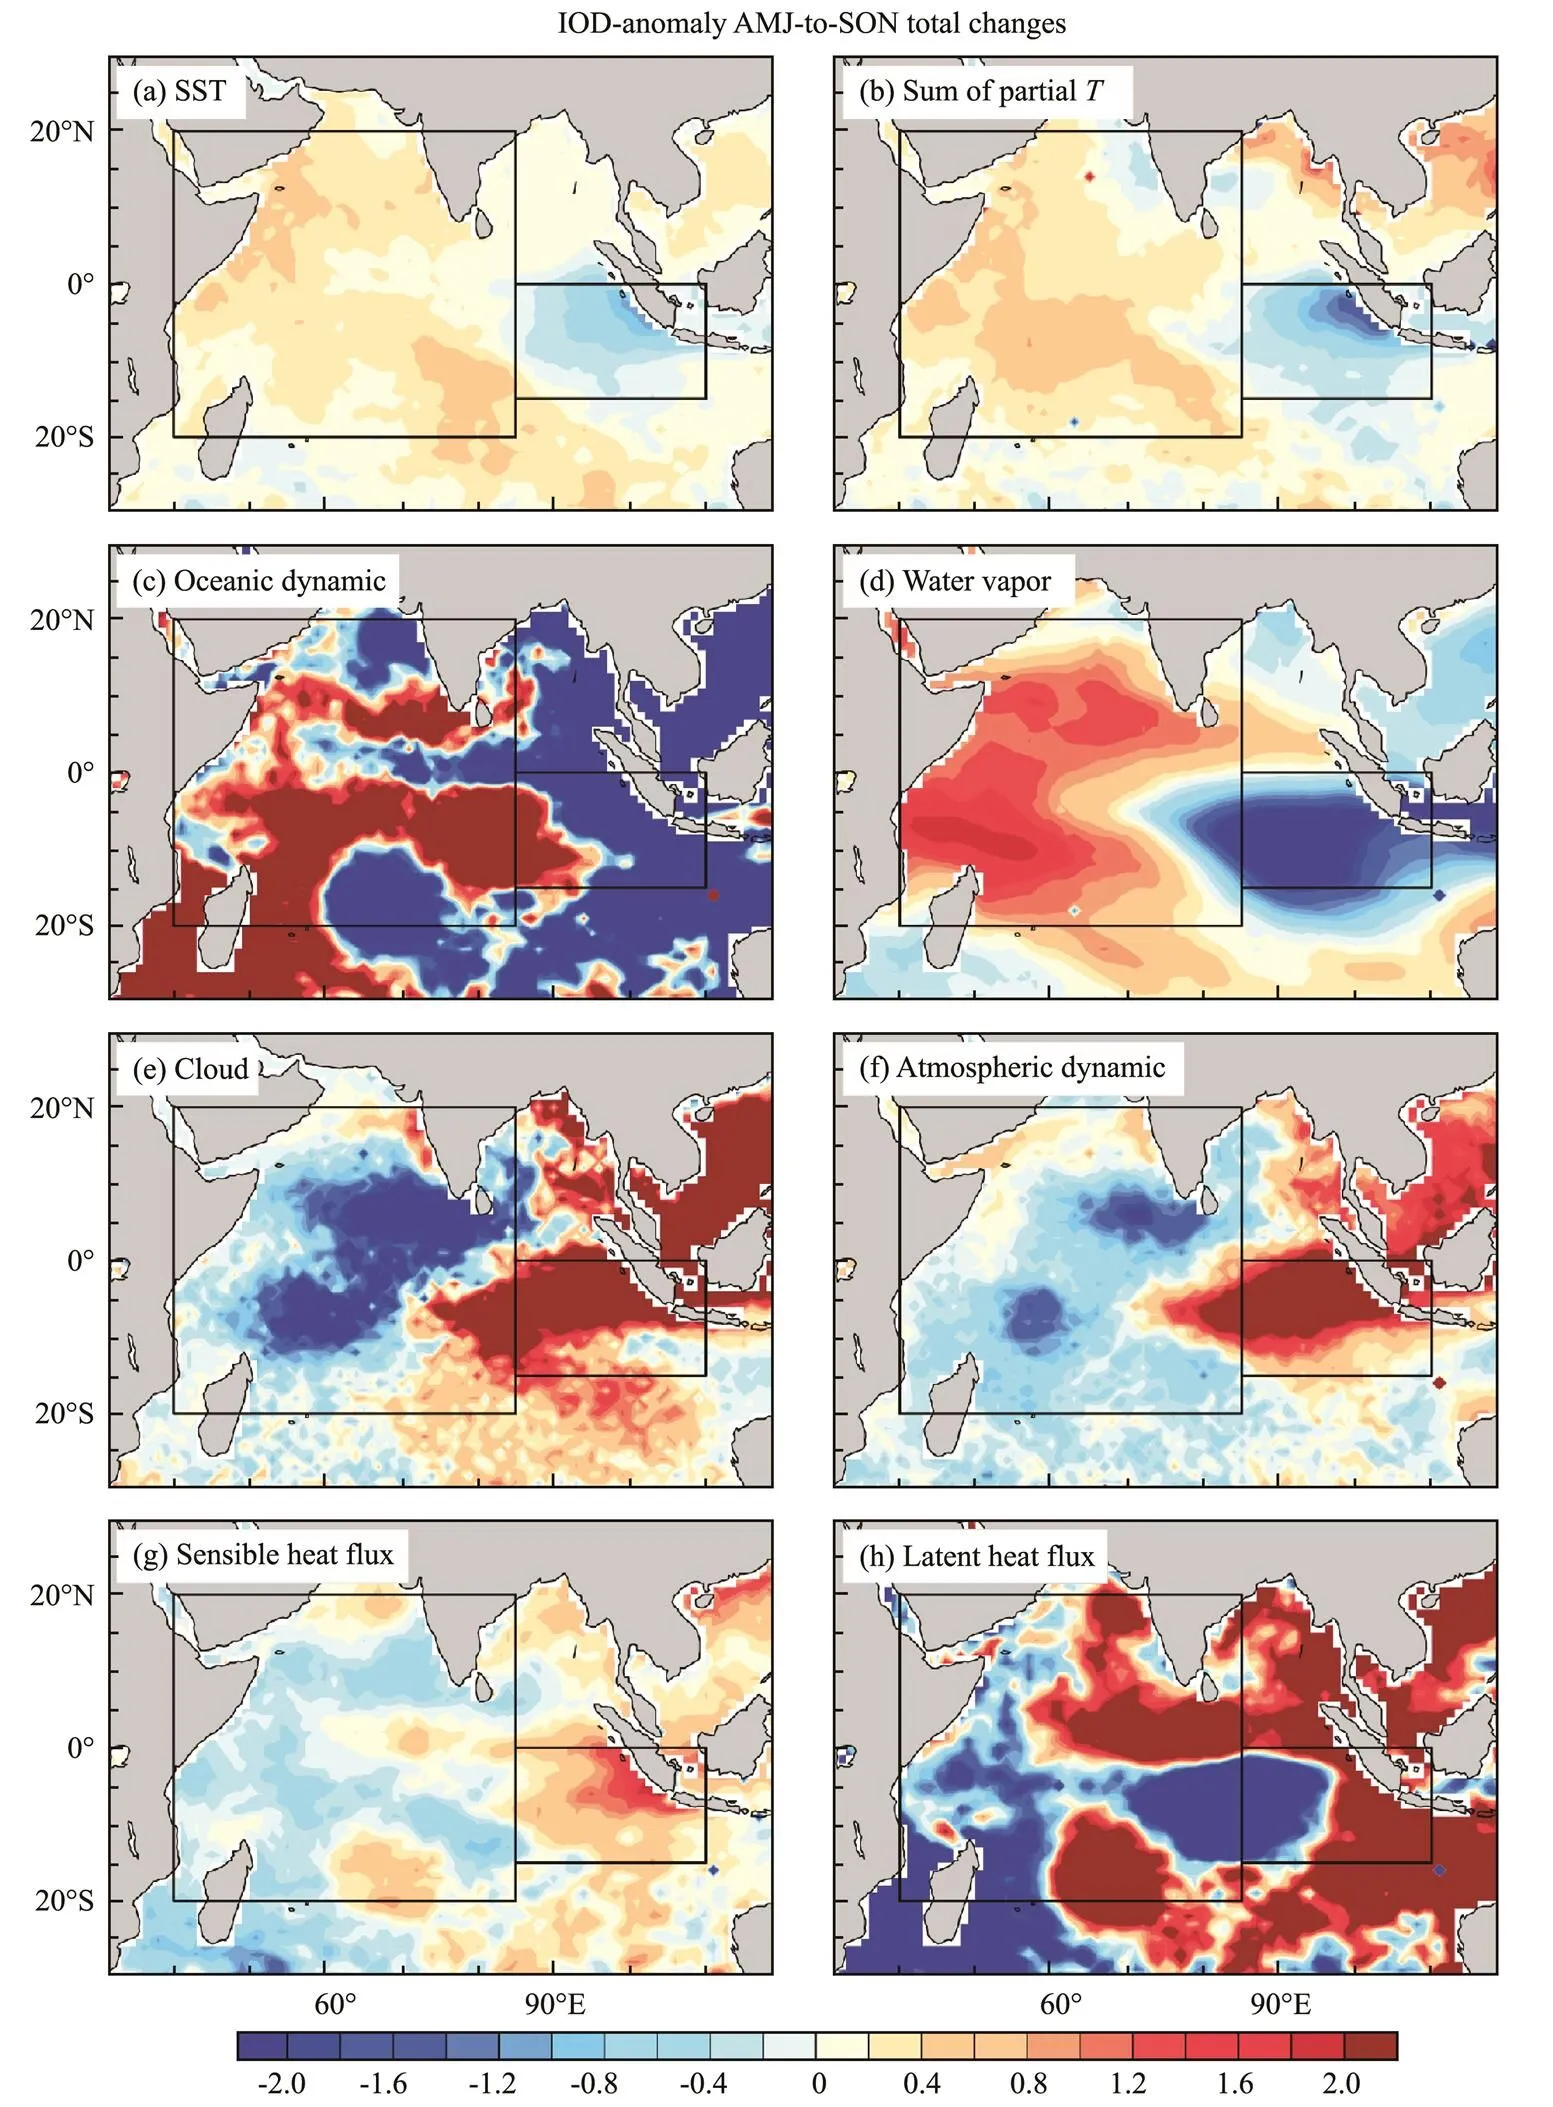
Fig.4 Spatial patterns of total changes in anomalous temperature from April-May-June to September-October-November during positive IOD years: (a), SST from ERA5; (b), the sum of partial temperature, the partial temperature due to (c) oceanic dynamic processes; (d), water vapor; (e), cloud; (f), atmospheric dynamic processes; (g), sensible heat flux and (h), latent heat flux, terms (b–h) are derived from the CFRAM. Considering the seasonal expansion of the cooling SST anomalies over the SEIO, the boundary between the two boxes that denote the WIO and SEIO in this figure is set to 85?E.
4 Attributions of the IOD Seasonal Evolution
The effect of vertical oceanic dynamic processes is the fundamental driver in generating the IOD-related SSTAs (Kug and An, 2010), which is efficient under shallow ther- mocline (Philip and van Oldenborgh, 2006). Therefore, the partial temperature changes due to oceanic dynamic pro- cesses have seasonally dependent intensities along with theseasonal changes in thermocline depth (row 1 in Fig.5 and Figs.6b, 7b). The oceanic dynamic processes in AMJ and MJJ only cause positive SSTA changes over the southern WIO and are incapable of inducing (negative) SSTA changes over the SEIO because the thermocline is still too deep at that time. Hence, the zonal gradient of the SSTAs is quite small and inadequate to estimate the Bjerknes feedback. The prevailing surface winds over the SEIO during JJA change to southeasterlies, which enhance coastal upwelling and shoal the thermocline. Such conditions allow the thermocline anomalies to evoke SSTAs over the SEIO. In response, the Bjerknes feedback is formed, promoting the further changes in SSTAs over the SEIO and WIO. As the thermocline over the SEIO continues shoaling in JAS and ASO, the partial temperature changes due to oceanic dynamic processes become substantially stronger than in the first three months. By contrast, the warming effects over the WIO do not accelerate in JAS and ASO because the seasonal changes in thermocline depth over the WIO are small. Although the oceanic dynamic processes term is strongest and most dominant among the CFRAM-decom- posed partial temperature changes, the SSTA tendency is not in-phase with the oceanic dynamic processes term (Figs. 6a, 6b and 7a, 7b), implying that the seasonally dependent growth rate of the IOD-related SSTAs is modulated by other terms.
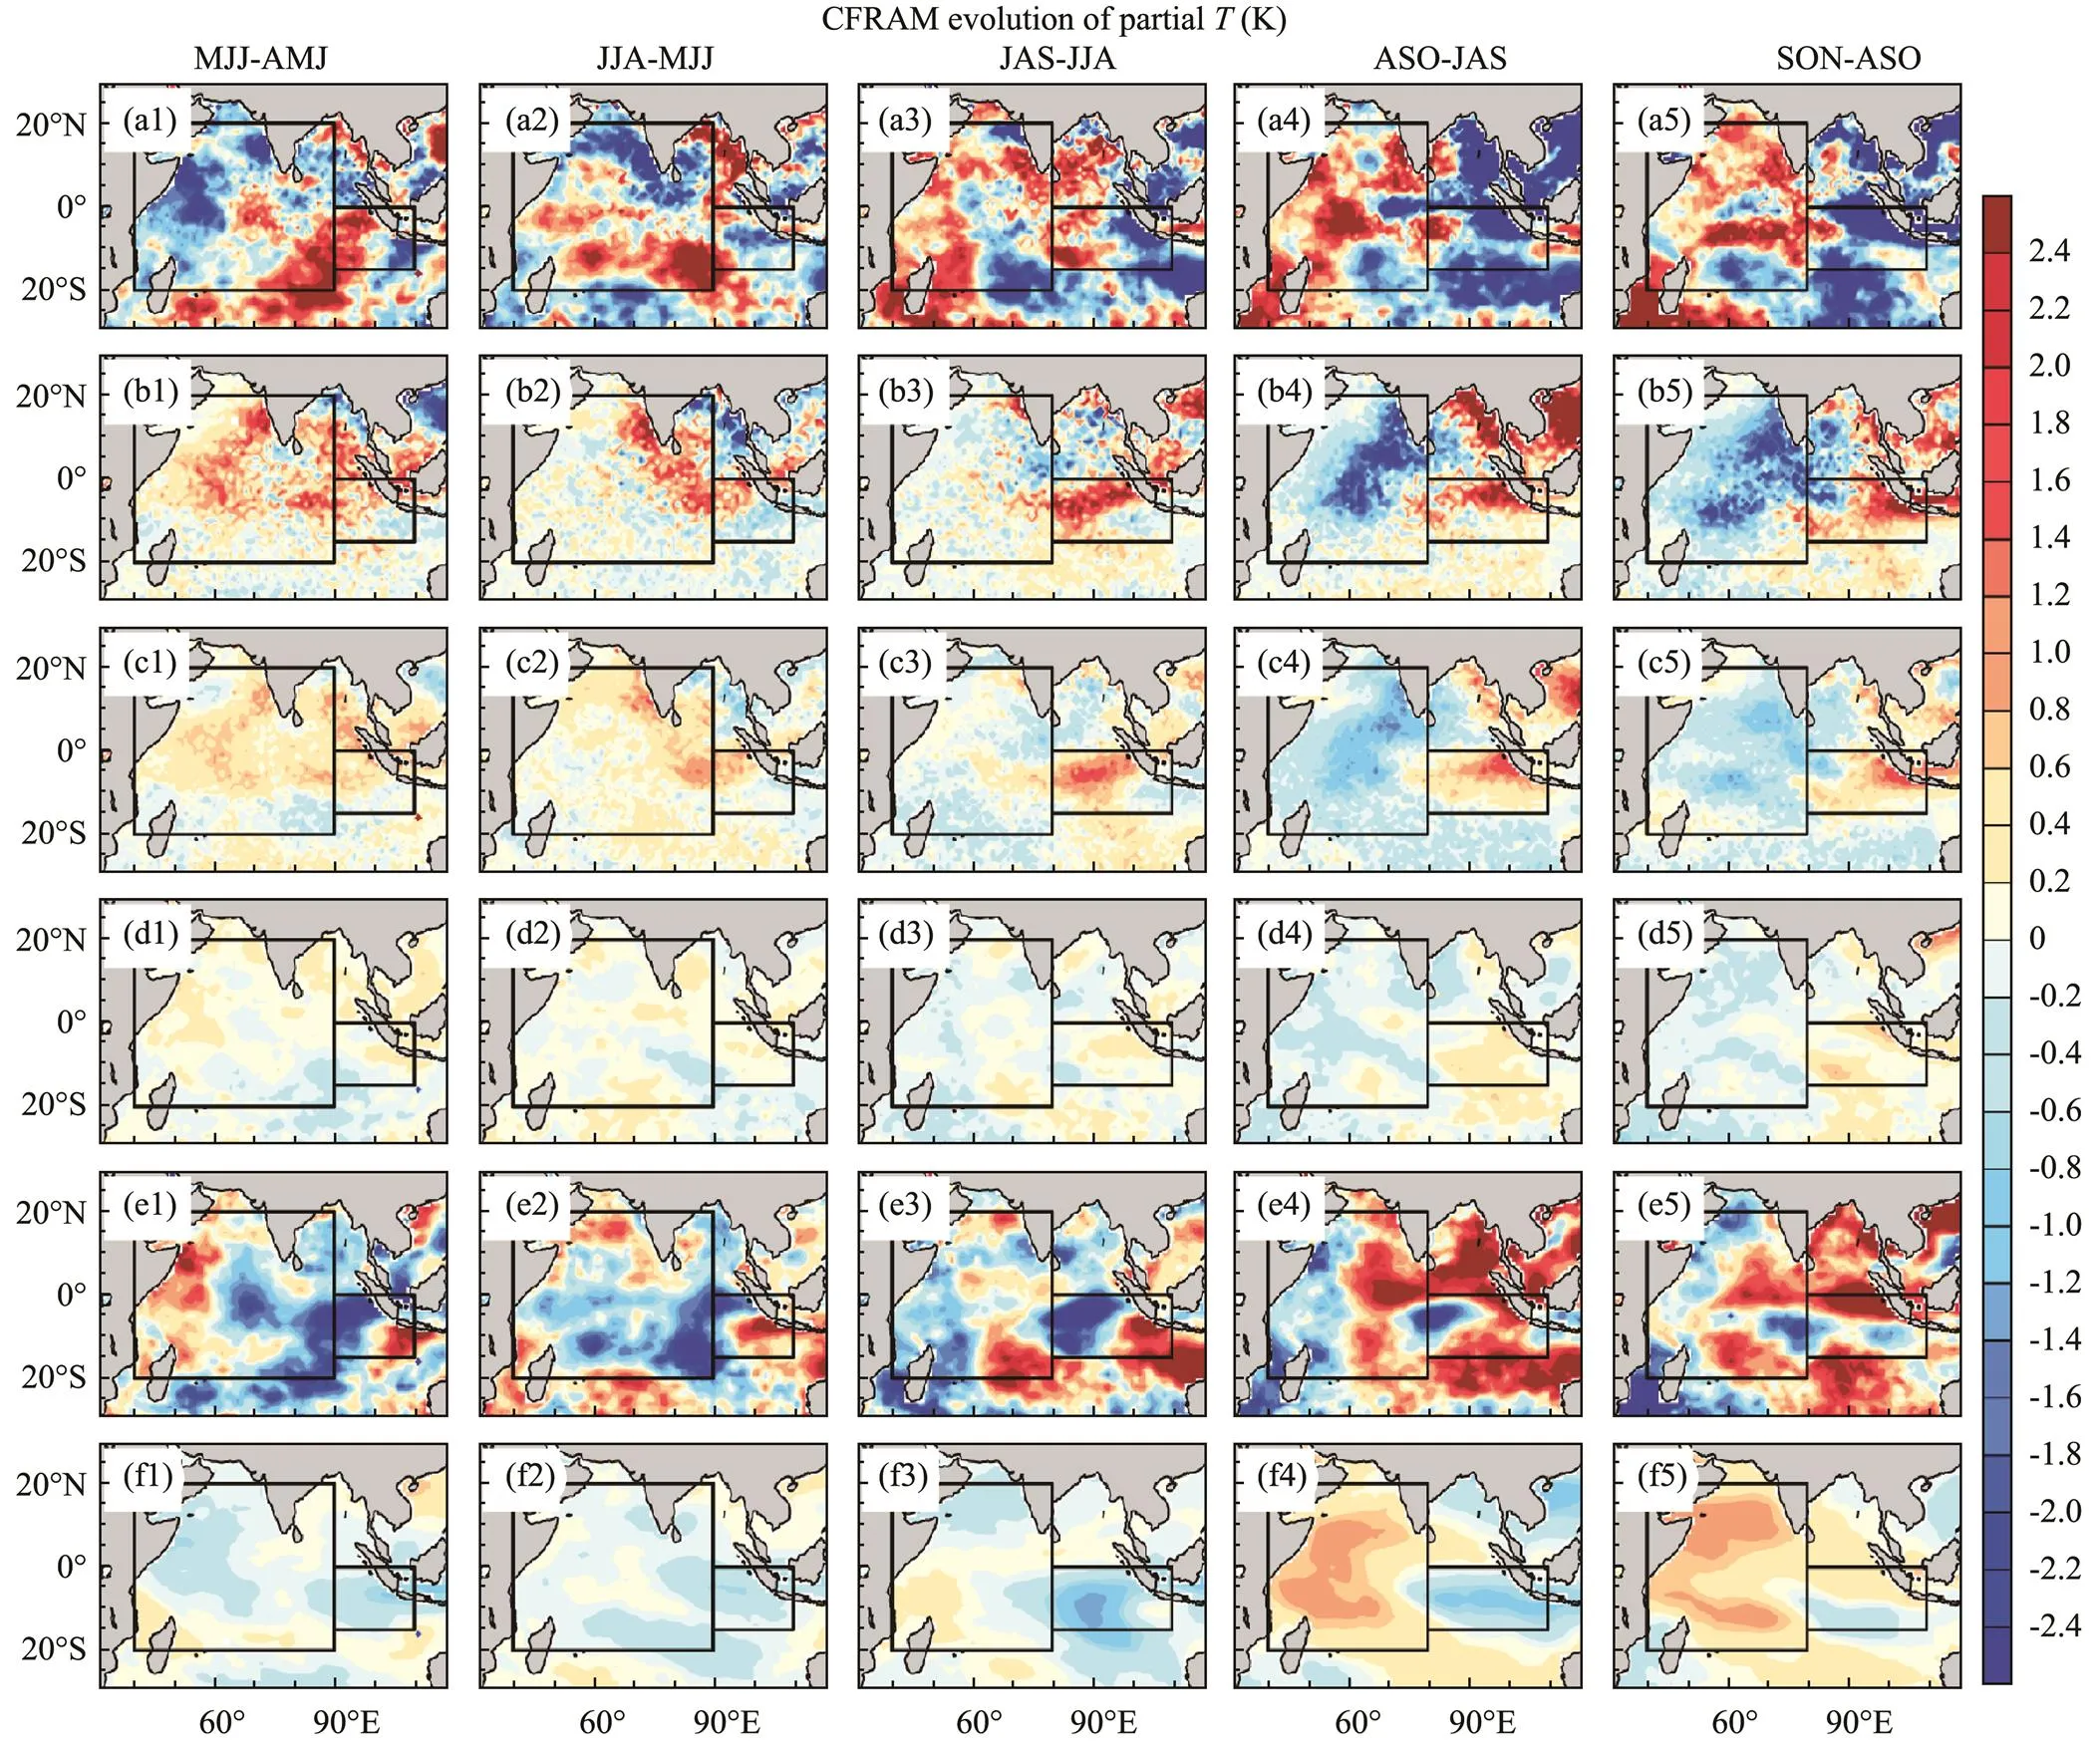
Fig.5 Monthly evolutions of the partial temperature due to (a1–a5) oceanic dynamic process and penetration, (b1–b5) cloud, (c1–c5) atmospheric dynamic process, (d1–d5) sensible heat flux, (e1–e5) latent heat flux, and (f1–f5) water vapor from April-May-June to September-October-November during positive IOD years.
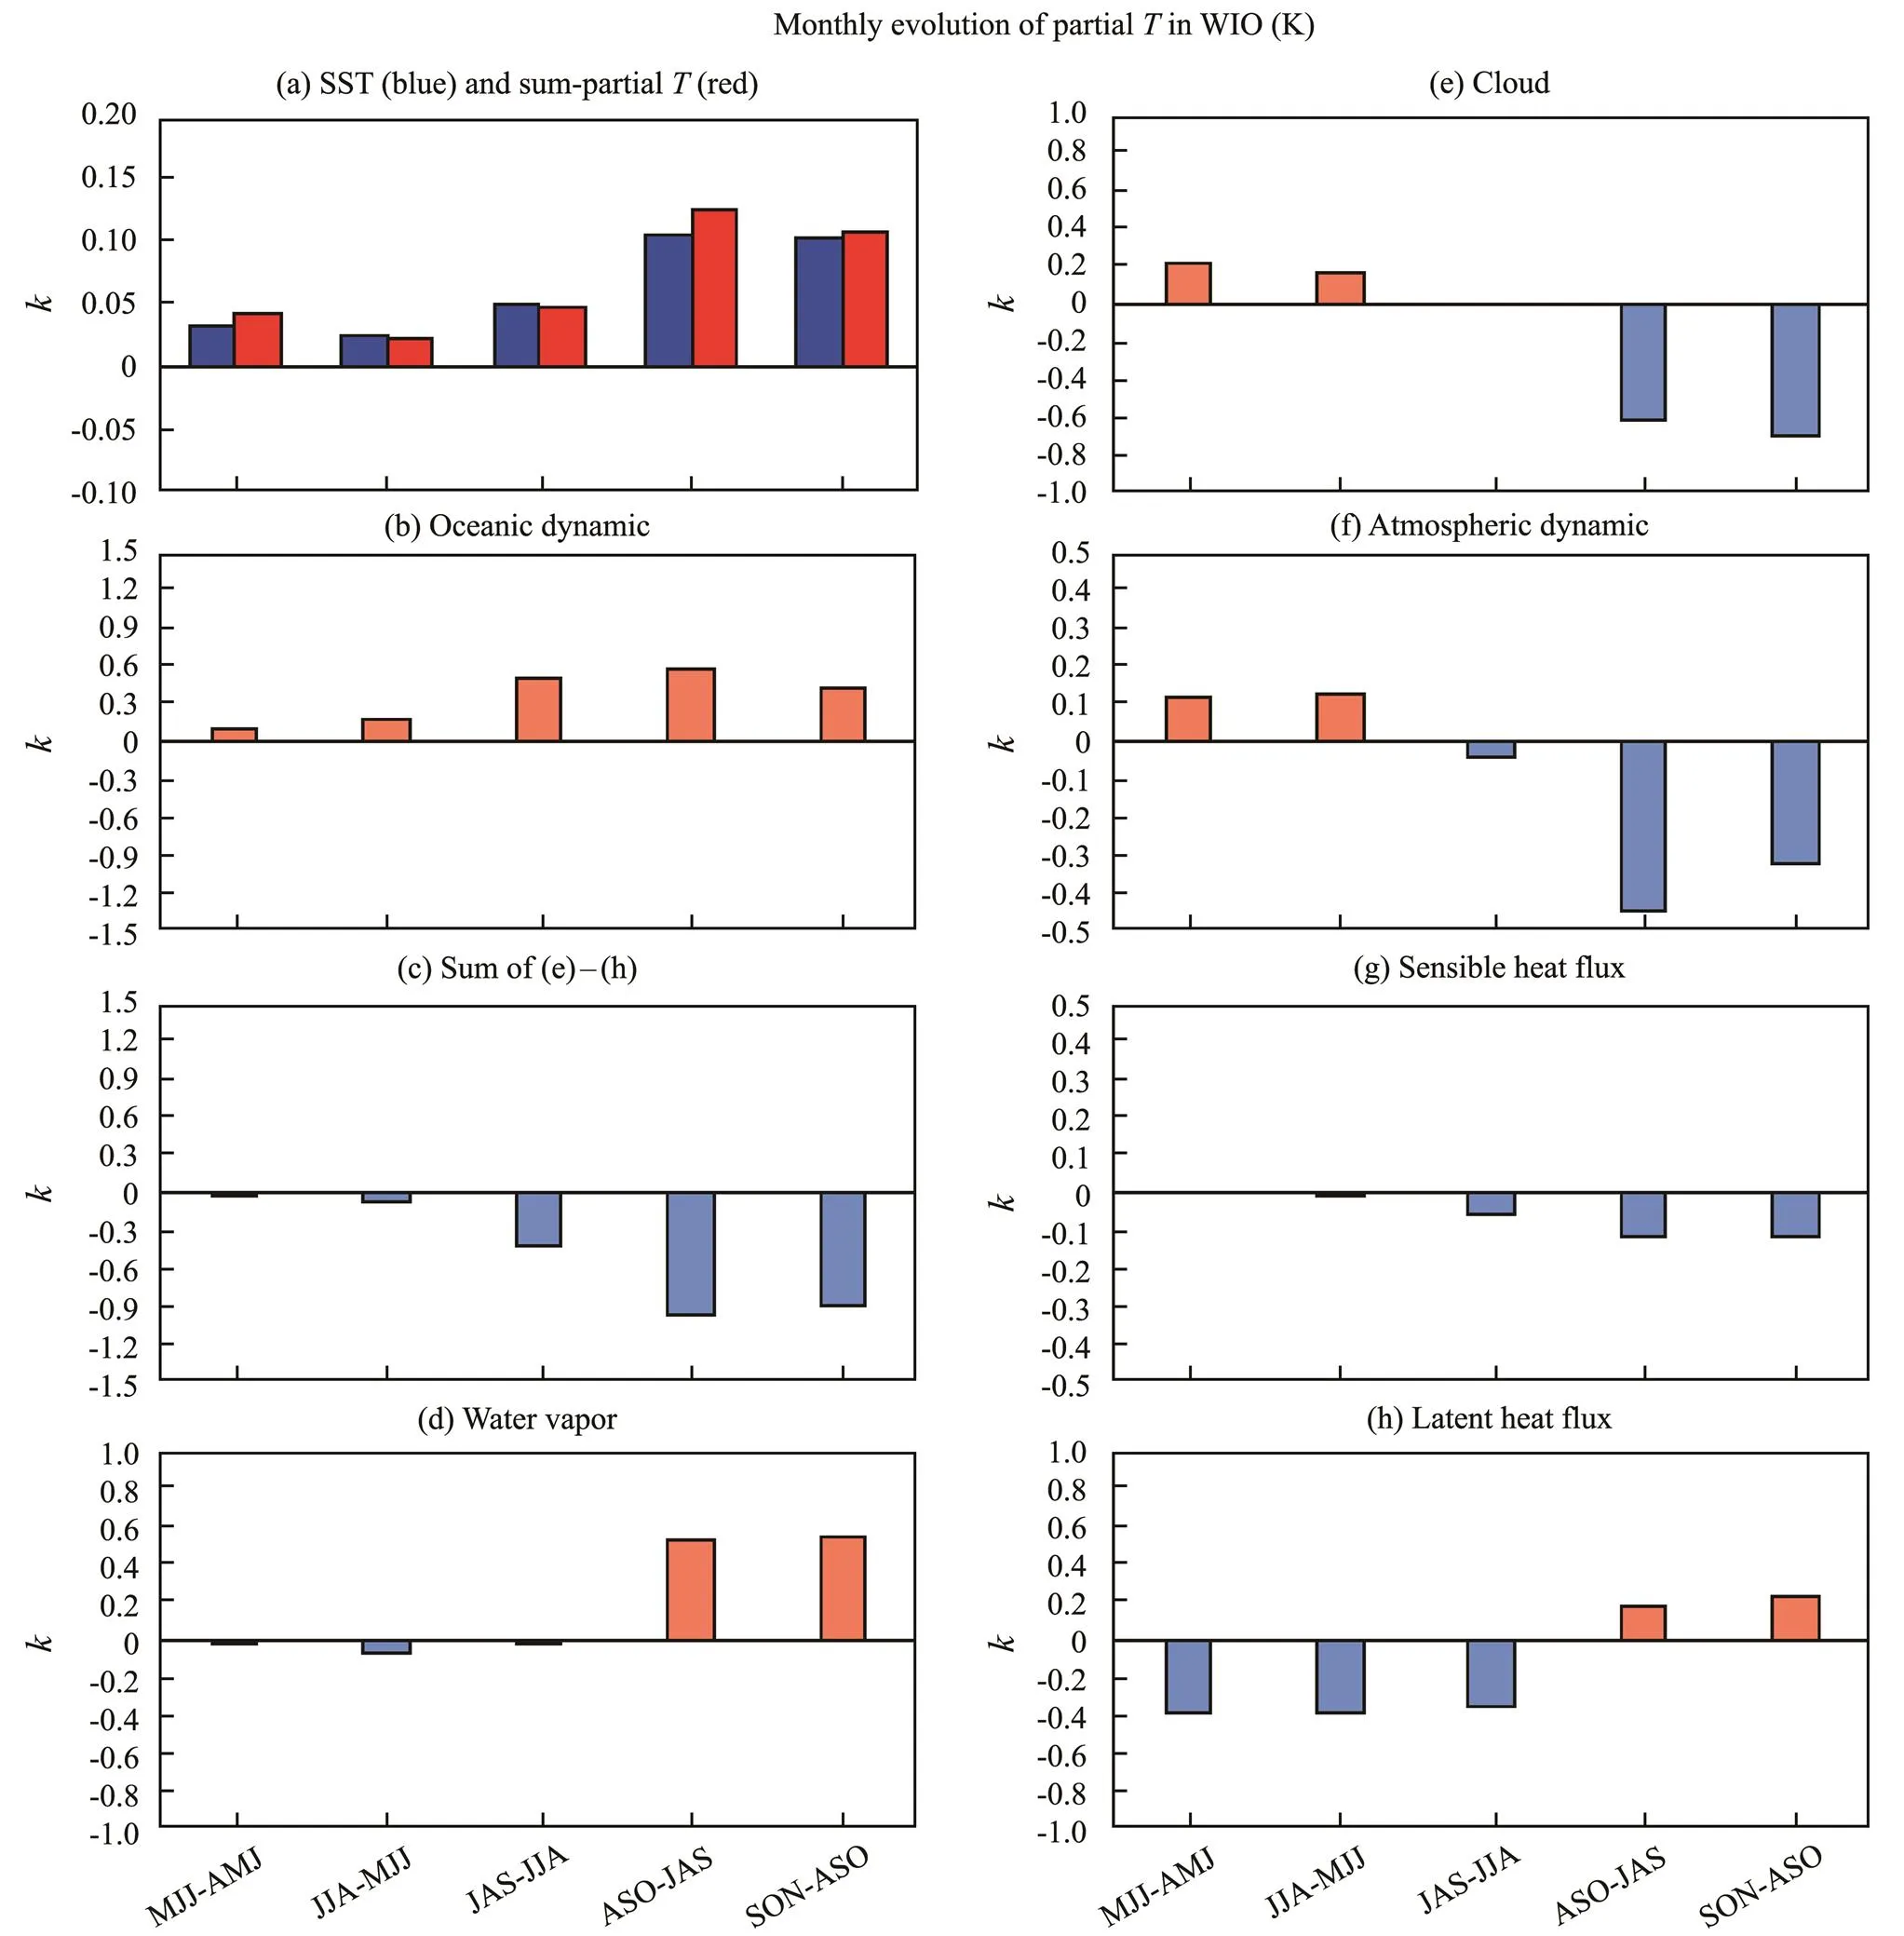
Fig.6 Monthly evolution of regional means of anomalous SST. The sum and individual terms (denoted by the left title) of partial temperature derived from the CFRAM over the WIO region.
We first examine the seasonality of the negative feedback terms. Over the WIO, the cloud feedback (row 2 in Figs.5 and 6e) and atmospheric dynamic processes (row 3 in Figs.5 and 6f) make a large damping impact on cooling in JJA–ASO when the positive SSTAs are sufficiently large to excite anomalous atmospheric convection. Notably, cloud feedback and atmospheric dynamic processes tend to warm up the northern WIO in AMJ and MJJ but are mostly offset by oceanic dynamic processes. The main damping term before JJA is latent heat flux, which conversely acts to warm the WIO in JAS and ASO (Fig.6h). The warming effect in the last two seasons may be associated with the surface wind anomalies and the related changes in evaporation. The sensible heat flux is the only term that continues to play a damping role from AMJ to ASO despite providing the smallest amplitudes. Combining all four negative feedback terms, the monthly amplitudes of their total effect successfully correspond to the SSTA tendency or the sum of partial temperature changes (Fig.6c). In other words, the collective effect of the negative feedback processes causes the strongest cooling in JAS and ASO as a response to the positive SSTAs, hardly contributing to the seasonally dependent growth rate of the SSTAs.
Over the SEIO, the suppressing effects of the cloud feedback and atmospheric dynamic processes peak in JJA and weaken in other seasons (Figs.7e, f), opposite to the SSTA tendency; thus, the two terms are unfavored for the biggest cooling changes in JJA. The sensible heat flux termgradually increases from AMJ to ASO (Fig.7g), effectivelycorresponding to the increasing negative SSTAs. The latent heat flux anomalies enhance cooling during the beginning months, which is a substantially smaller extent than the warming effect in JAS and ASO (Fig.7h). However, the total damping effect of the four negative feedback terms gradually increases from AMJ to JJA but becomes consi- derably large in JAS and ASO (Fig.7c), corresponding to the seasonal variations in the oceanic dynamic processes term. Thus, the negative feedback terms together can explain the decrease in SSTA tendency over the SEIO in JASand SON yet not for the largest cooling changes in JJA be- cause the oceanic processes induce relatively weak cooling before JJA.
We then evaluate the effect of the water vapor feedback term. The changes in water vapor concentrations in response to the SSTAs can further promote the SSTAs via increasing downward longwave radiation or the so-called greenhouse effect. As a secondary process due to SSTAs, the water vapor feedback can also modulate the SSTA tendency. Figs.6d and 7d show the seasonal evolution of the water vapor feedback term over the WIO and SEIO, respectively. Interestingly, the water vapor term goes well in-phase with the SSTA tendency over both regions despite contributing smaller warming/cooling changes over the WIO/SEIO than the oceanic dynamic processes. For the WIO mean, the water vapor feedback term has a distinct seasonally dependent effect that provides nearly no contribution in AMJ, MJJ, and JJA and induces strong warming in JAS and ASO. For the SEIO mean, the negative effect caused by the water vapor feedback term increases from AMJ, peaks in JJA, and then decrease in JAS, especially inASO. The water vapor longwave effect can largely explain the seasonality of the SSTA tendency over the WIO and SEIO. Therefore, the positive water vapor feedback not only further fuels the initial SSTAs but also acts to modulate the seasonality of the SSTA growth rates.
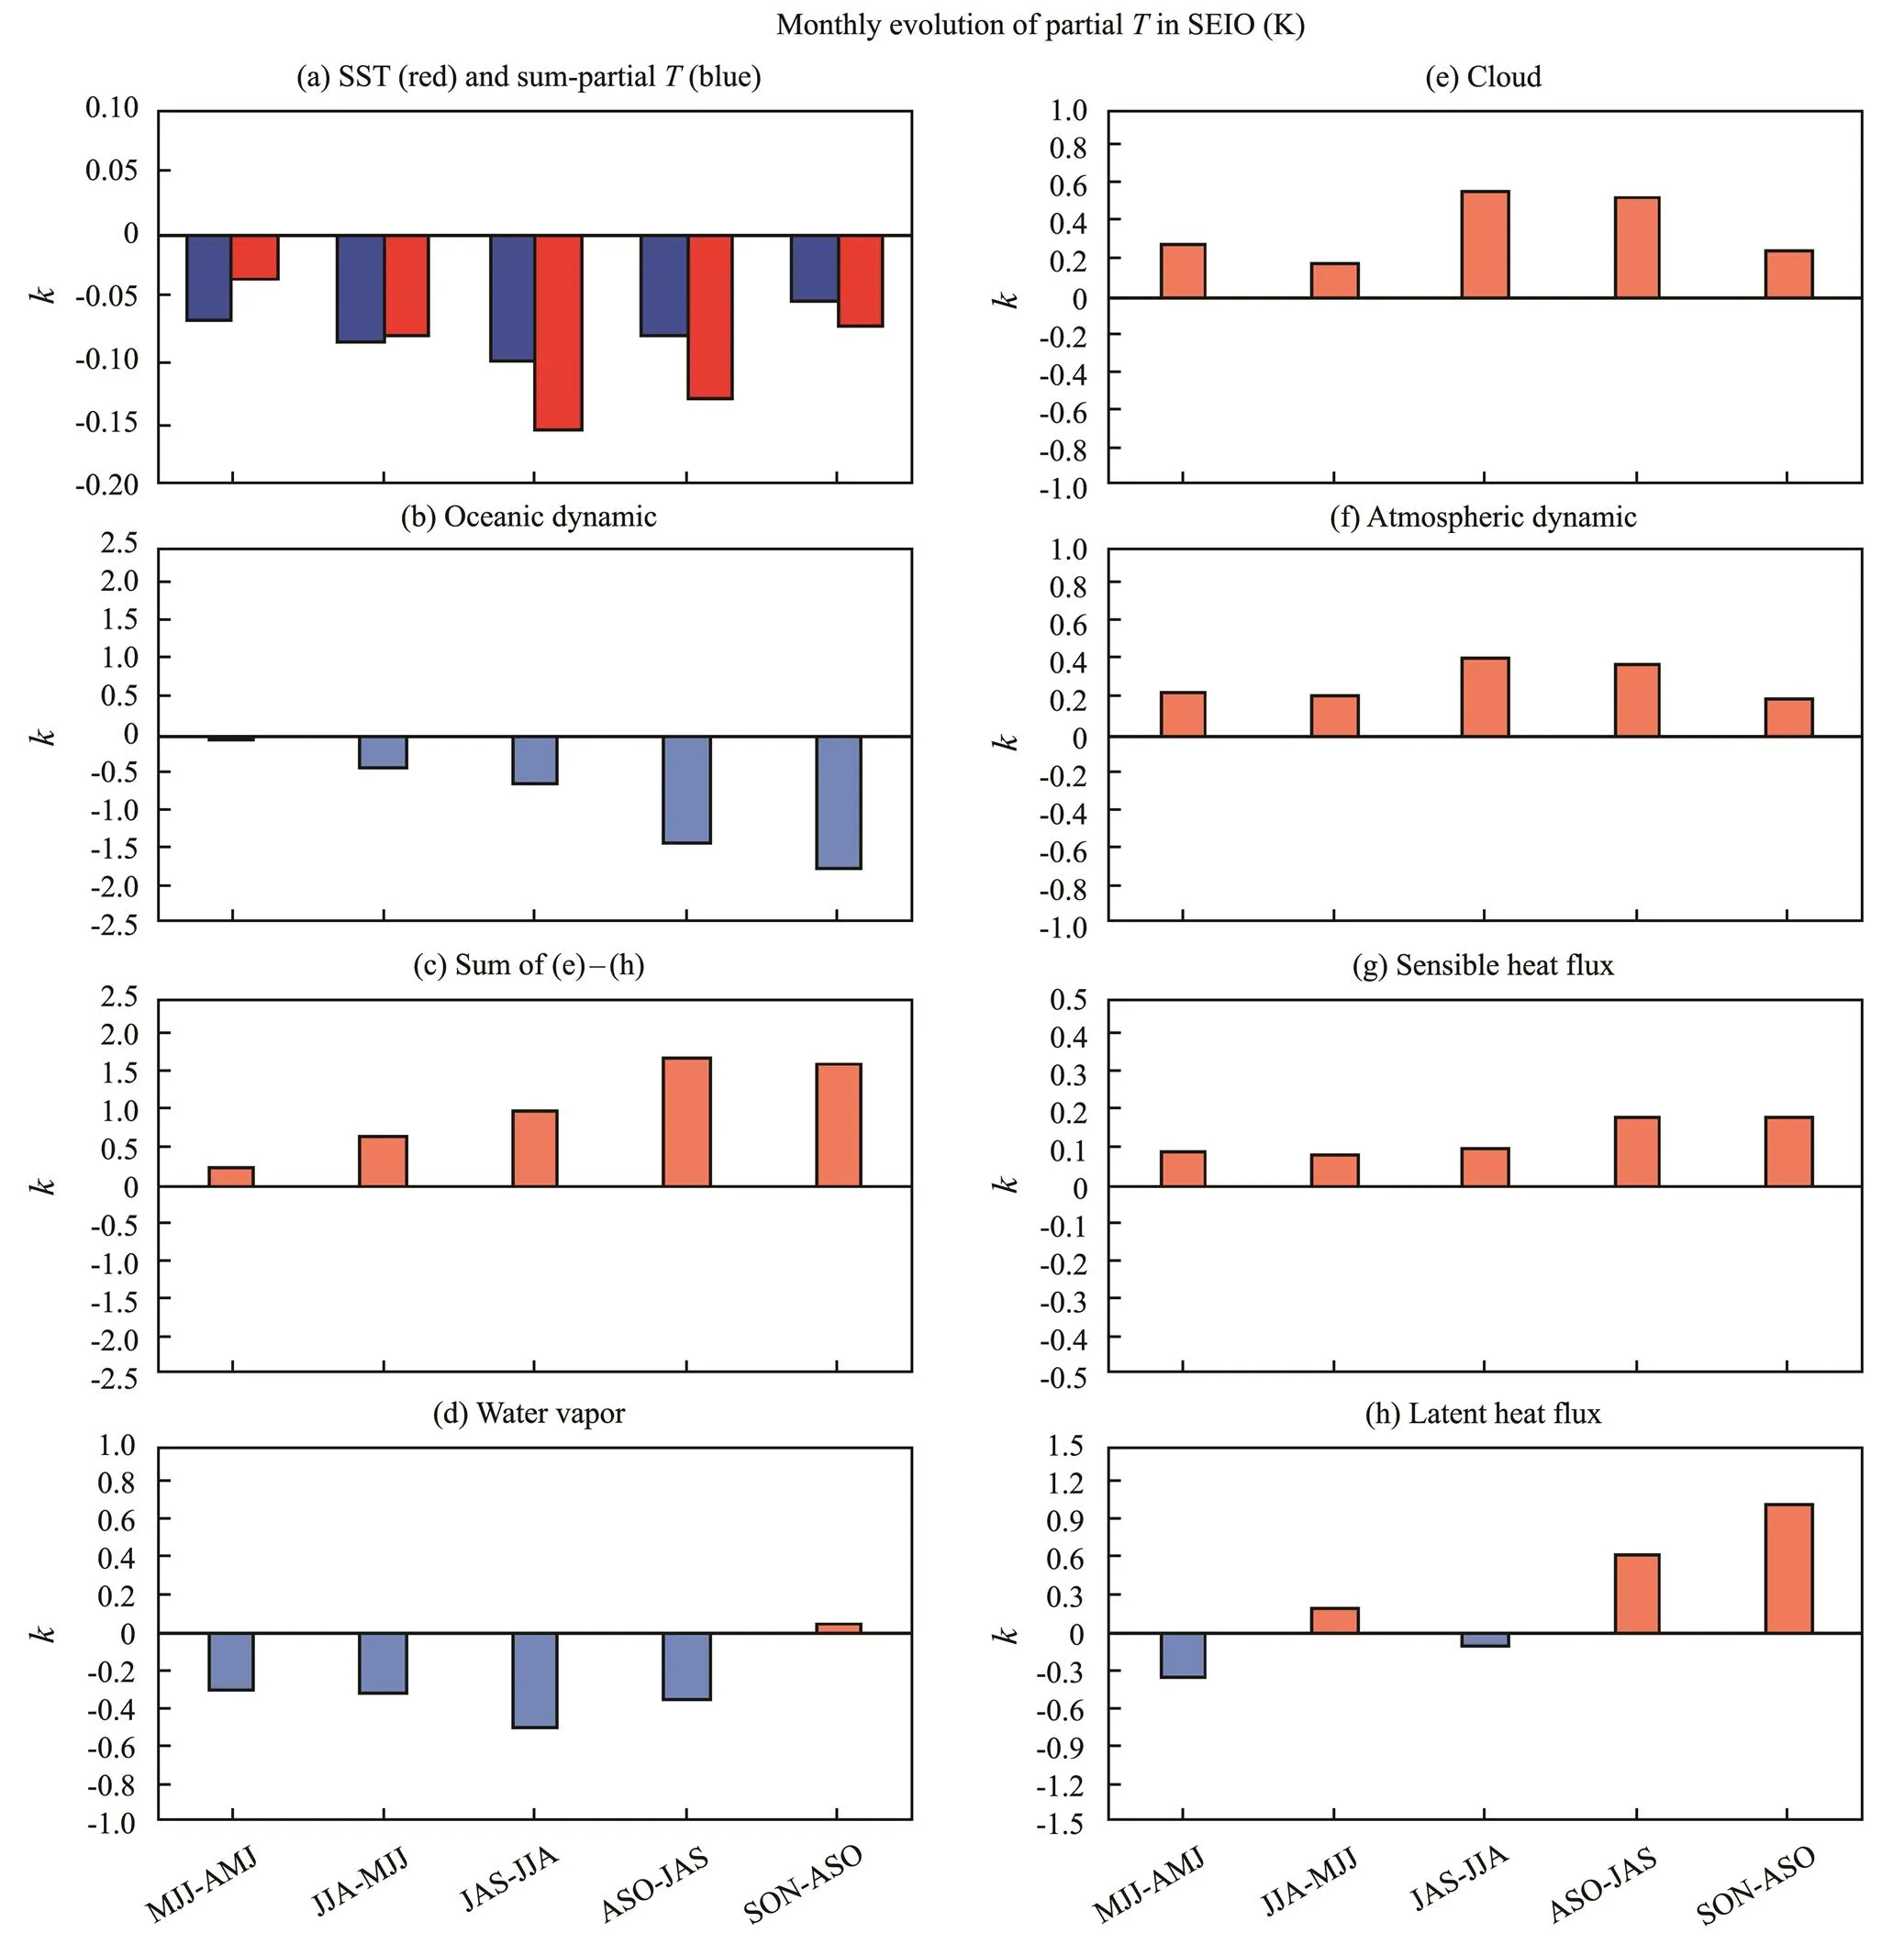
Fig.7 Same as Fig.6, except for the SEIO region.
5 Summary and Discussion
One significant feature of the IOD lies in its seasonal phase locking evolution that onsets in summer, peaks in autumn, and then decays in winter, which is due to the seasonal changes in the background mean state (Schott, 2009). The mean thermocline over the SEIO along the Sumatra coast is sufficiently shallow for the thermocline variations to induce SSTAs only in summer and autumn. Therefore, the positive Bjerknes thermocline feedback is activated to generate IOD events in these seasons. The seasonality of the IOD-related SSTAs has been well documented, but the seasonality of the SSTA growth rate has not been widely investigated and attributed previously. Moreover, less attention has been provided to the seasonality of the WIO compared with that of the SEIO, which also contributes to the seasonal evolution of the IOD.
By conducting a CFRAM analysis, the monthly changesin SSTAs are decomposed into partial temperature changesdue to several radiative and non-radiative processes to diag- nose the seasonality of the SSTA tendency over the WIO and SEIO regions. Notably, although the SSTAs over both regions slightly amplify before the peak season SON, theirmonthly growth rates are of different intensities. In parti- cular, the WIO SSTAs grow slowly from AMJ to JJA and then rapidly afterward, whereas the growth rate of the SEIO SSTAs increases before JJA (peaks in JJA) and decreases afterward. According to the CFRAM decomposition, the oceanic dynamic processes induce the largest partial temperature changes similar to those indicated in the previous studies. Despite its dominant role in the total SSTAs during the development of the IOD, the oceanic dynamic processes term cannot explain the seasonally dependent growth rate over the two SSTA centers. In this case, the seasonality of the other feedback processes is further investigated to determine which factor(s) should be responsible for the temporal mismatch between the total SSTAs and the effect of oceanic dynamic processes.
Over the WIO, the effect of latent heat flux anomalies is strong from AMJ to JJA in suppressing the SSTAs when the damping effects of the cloud feedback and atmosphe- ric dynamic processes are of small amplitudes. During JAS and ASO, the latent heat flux anomalies become decrease while the partial temperature changes due to the cloud feedback and atmospheric dynamic processes increase and play dominant damping roles. The negative effect of the sensible heat flux is weak and oppositely parallel to the SSTAs. Overall, the total effect of the four negative feedbacks effectively corresponds to the SSTA tendency and does not contribute to the seasonally dependent growth rate of the SSTAs. In terms of the combined effect of negative feedback, the situation is similar over the SEIO, peaking in JAS and ASO but failing to modify the monthly amplitudes of the SSTA tendency.
As a secondary response, the water vapor feedback further enhances the initial SSTAs. The partial temperature changes due to the water vapor feedback peak in JAS and ASO over the WIO and in JJA over the SEIO. That is, al- though the IOD seasonal phase-locking feature is related to the seasonal changes in the efficient oceanic dynamic processes, the water vapor feedback should be the sole factor responsible for the seasonality of the SSTA growth rate over the WIO and SEIO. Therefore, considerable efforts should be exerted in the next step to determine the reasons for the seasonally dependent response of water vapor concentrations during the development of the IOD.
Acknowledgements
This study is supported by the Second Tibetan Plateau Scientific Expedition and Research (STEP) Program (No. 2019QZKK0102), and the National Natural Science Foundation of China (No. 42176026). The author Dr. Hanjie Fan is supported by the National Postdoctoral Program of Innovative Talents (No. BX2021324).
Abram, N. J., Gagan, M., Liu, Z., Hantoro, W. S., McCulloch, M. T., and Suwargadi, B. W., 2007. Seasonal characteristics of the Indian Ocean Dipole during the Holocene epoch., 445: 299-302, https://doi.org/10.1038/nature05477.
Ashok, K., Guan, Z., and Yamagata, T., 2003. Influence of the Indian Ocean Dipole on the Australian winter rainfall., 30: 3-6, https://doi.org/10.1029/2003GL017926.
Bjerknes, J., 1969. Monthly weather review atmospheric tele- connections from the Equatorial Pacific., 97: 163-172.
Cai, M., and Lu, J., 2009. A new framework for isolating in- dividual feedback processes in coupled general circulation cli-mate models. Part II: Method demonstrations and comparisons., 32: 887-900, https://doi.org/10.1007/s00382-008-0424-4.
Cai, W., Cowan, T., and Raupach, M., 2009. Positive Indian OceanDipole events precondition southeast Australia bushfires., 36: 1-6, https://doi.org/10.1029/2009GL039902.
Cai, W., Van Rensch, P., Cowan, T., and Hendon, H. H., 2012. An asymmetry in the IOD and ENSO teleconnection pathway and its impact on australian climate.,25: 6318-6329, https://doi.org/10.1175/JCLI-D-11-00501.1.
Deng, Y., Park, T. W., and Cai, M., 2013. Radiative and dy- namical forcing of the surface and atmospheric temperature anomalies associated with the northern annular mode., 26: 5124-5138, https://doi.org/10.1175/JCLI-D-12-00431.1.
Fan, H., Hu, X., Yang, S., Choi, Y. S., and Lee, Y. K., 2021. Process-based analysis of relative contributions to the multi-model warming projection over East Asia., 56: 2729-2747, https://doi.org/10.1007/s00382-020-05614-7.
Guan, Z., and Yamagata, T., 2003. The unusual summer of 1994 in East Asia: IOD teleconnections., 30: 4-7, https://doi.org/10.1029/2002gl016831.
Hersbach, H., Bell, B., Berrisford, P., Hirahara, S., Horányi, A., Sabater, J. M.,, 2020. The ERA5 global reanalysis., 146: 1999-2049, https://doi.org/10.1002/qj.3803.
Hong, C. C., Lu, M. M., and Kanamitsu, M., 2008. Temporal and spatial characteristics of positive and negative Indian Ocean dipole with and without ENSO., 113: D08107, https://doi.org/10.1029/2007JD009151.
Hu, X., Cai, M., Yang, S., and Wu, Z., 2018. Delineation of thermodynamic and dynamic responses to sea surface temper- ature forcing associated with El Ni?o., 51: 4329-4344, https://doi.org/10.1007/s00382-017-3711-0.
Hu, X., Fan, H., Cai, M., Sejas, S. A., Taylor, P., and Yang, S., 2020. A less cloudy picture of the inter-model spread in future global warming projections., 11: 1-12, https://doi.org/10.1038/s41467-020-18227-9.
Hu, X., Yang, S., and Cai, M., 2016. Contrasting the eastern Pacif- ic El Ni?o and the central Pacific El Ni?o: Process-based feed-back attribution., 47: 2413-2424, https://doi.org/10.1007/s00382-015-2971-9.
Kong, Y., Wu, Y., Hu, X., Li, Y., and Yang, S., 2022. Uncertaintyin projections of the South Asian summer monsoon under global warming by CMIP6 models: Role of tropospheric meridional thermal contrast., 15: 100145, https://doi.org/10.1016/j.aosl.2021.100145.
Kug, J. S., and An, S. I., 2010. Ocean dynamics processes re- sponsible for the interannual variability of the tropical Indian Ocean SST associated with ENSO., 20: 211-219.
Li, T., Wang, B., Chang, C. P., and Zhang, Y., 2003. A theory for the Indian Ocean Dipole-zonal mode., 60: 2119-2135, https://doi.org/10.1175/1520-0469(2003)060<2119:ATFTIO>2.0.CO;2.
Li, T., Zhang, Y., Lu, E., and Wang, D., 2002. Relative role of dynamic and thermodynamic processes in the development of the Indian Ocean dipole: An OGCM diagnosis., 29: 25-1-25-4, https://doi.org/10.1029/2002gl015789.
Li, Y., and Yang, S., 2017. Feedback attributions to the dominant modes of East Asian winter monsoon variations., 30: 905-920, https://doi.org/10.1175/JCLI-D-16-0275.1.
Liu, L., Yu, W., and Li, T., 2011. Dynamic and thermodynamic air-sea coupling associated with the Indian Ocean Dipole diag- nosed from 23 WCRP CMIP3 models.,24: 4941-4958, https://doi.org/10.1175/2011JCLI4041.1.
Lu, J., and Cai, M., 2009. A new framework for isolating indi- vidual feedback processes in coupled general circulation cli- mate models. Part I: Formulation., 32: 873-885, https://doi.org/10.1007/s00382-008-0425-3.
Lu, J., and Cai, M., 2010. Quantifying contributions to polar warming amplification in an idealized coupled general circu- lation model., 34: 669-687, https://doi.org/10.1007/s00382-009-0673-x.
Luo, J. J., Zhang, R., Behera, S., Masumoto, Y., Jin, F. F., Lukas, R.,, 2010. Interaction between El Ni?o and extreme In- dian Ocean Dipole., 23: 726-742, https://doi.org/10.1175/2009JCLI3104.1.
Nakazato, M., Kido, S., and Tozuka, T., 2021. Mechanisms of asymmetry in sea surface temperature anomalies associated with the Indian Ocean Dipole revealed by closed heat budget., 11: 1-13, https://doi.org/10.1038/s41598-021-01619-2.
Nuncio, M., and Yuan, X., 2015. The influence of the Indian Ocean Dipole on Antarctic sea ice., 28: 2682-2690, https://doi.org/10.1175/JCLI-D-14-00390.1.
Philip, S., and van Oldenborgh, G. J., 2006. Shifts in ENSO coupl- ing processes under global warming., 33: L11704, https://doi.org/10.1029/2006GL026196.
Rao, S. A., Behera, S. K., Masumoto, Y., and Yamagata, T., 2002. Interannual subsurface variability in the tropical Indian Ocean with a special emphasis on the Indian Ocean Dipole., 49: 1549-1572, https://doi.org/10.1016/S0967-0645(01)00158-8.
Saji, N. H., and Yamagata, T., 2003a. Structure of SST and sur- face wind variability during Indian Ocean Dipole mode events: OADS observations.,16: 2735-2751, ttps://doi.org/10.1175/1520-0442(2003)016<2735:SOSASW>2.0.CO;2.
Saji, N. H., and Yamagata, T., 2003b. Possible impacts of In- dian Ocean Dipole mode events on global climate., 25: 151-169, https://doi.org/10.3354/cr025151.
Saji, N. H., Goswami, B. N., Vinayachandran, P. N., and Yama- gata, T., 1999. A dipole mode in the tropical Indian Ocean., 401: 360-363, https://doi.org/10.1038/43854.
Schott, F. A., Xie, S. P., and McCreary, J. P., 2009. Indian Ocean circulation and climate variability., 47: 1-46, https://doi.org/10.1029/2007RG000245.
Webster, P. J., Moore, A. M., Loschnigg, J. P., and Leben, R., 1999. Coupled oceanic-atmoshperic dynamics in the Indian Ocean during 1997–1998., 401: 356-360.
Xie, S. P., and Philander, S. G. H., 1994. A coupled ocean-atmos- phere model of relevance to the ITCZ in the eastern Pacific., 46 (4): 340-350, https://doi.org/10.1034/j.1600-0870.1994.t01-1-00001.x
Xie, S. P., Annamalai, H., Schott, F. A., and McCreary, J. P., 2002. Structure and mechanisms of South Indian Ocean cli- mate variability.,15: 864-878, https://doi.org/10.1175/1520-0442(2002)015<0864:SAMOSI>2.0.CO;2.
Yang, Y., Xie, S. P., Wu, L. X., Kosaka, Y., Lau, N. C., and Vecchi, G. A., 2015. Seasonality and predictability of the In- dian Ocean Dipole mode: ENSO forcing and internal variability., 28: 8021-8036, https://doi.org/10.1175/JCLI-D-15-0078.1.
Zhang, G. L., Wang, X., Xie, Q., Chen, J. P., and Chen, S., 2022. Strengthening impacts of spring sea surface temperature in the north tropical Atlantic on Indian Ocean Dipole after the mid-1980s., 59 (4): 185-200, https://doi.org/10.1007/s00382-021-06128-6.
Zhang, L., and Han, W., 2021. Indian Ocean Dipole leads to At- lantic Ni?o., 12: 5952, https://doi.org/10.1038/s41467-021-26223-w.
Zhang, Y. Z., Li, J. P., Zhao, S., Zheng, F., Feng, J., Li, Y.,, 2020. Indian Ocean tripole mode and its associated atmospher- ic and oceanic processes., 55: 1367-1383, https://doi.org/10.1007/s00382-020-05331-1.
(February 25, 2022;
April 6, 2022;
April 27, 2022)
? Ocean University of China, Science Press and Springer-Verlag GmbH Germany 2023
. Tel: 0086-756-3668769
E-mail: zhanggli6@mail.sysu.edu.cn
(Edited by Xie Jun)
 Journal of Ocean University of China2023年6期
- Journal of Ocean University of China的其它文章
- Effects of 5-Azacytidine (AZA) on the Growth, Antioxidant Activities and Germination of Pellicle Cystsof Scrippsiella acuminata (Diophyceae)
- Improving Yolo5 for Real-Time Detection of Small Targets in Side Scan Sonar Images
- Wave Radiation by a Floating Body in Water of Finite Depth Using an Exact DtN Boundary Condition
- Underwater Acoustic Signal Noise Reduction Based on a Fully Convolutional Encoder-Decoder Neural Network
- Assessment of Storm Surge and Flood Inundation in Chittagong City of Bangladesh Based on ADCIRC and GIS
- Contraction of Heat Shock Protein 70 Genes Uncovers Heat Adaptability of Ostrea denselamellosa
