
A high-quality genome of Actinidia eriantha provides new insight into ascorbic acid regulation
2023-11-18 09:32:30LlAOGuanglianHUANGChunhuiJlADongfengZHONGMinTAOJunjieQUXueyanXUXiaobiao
Journal of Integrative Agriculture 2023年11期
LlAO Guang-lian, HUANG Chun-hui, JlA Dong-feng, ZHONG Min, TAO Jun-jie, QU Xue-yan,XU Xiao-biao
Institute of Kiwifruit, Jiangxi Agricultural University, Nanchang 330045, P.R.China
Abstract Actinidia eriantha is one of the species of kiwifruit with a particularly high ascorbic acid (AsA) content.However, the molecular mechanism driving AsA richness in fruit remains unclear.In order to reveal the molecular mechanism of AsA richness in A.eriantha, this study constructed a regulatory network related to AsA metabolism by combining genomics,metabolomics and transcriptomics.We assembled a high-quality genome of A.eriantha ‘Ganlv 1’ with only five remaining gaps.The assembly is comprised of 29 pseudochromosomes with a total size of 615.95 Mb, and contig N50 of 20.35 Mb.Among them, 24 of the pseudochromosomes were obtained directly from telomere-to-telomere.The LTR assembly index score and consensus quality value were 21.34 and 39.90%, respectively.Subsequently, 61 metabolites and 2 092 genes were found to be differentially accumulated/expressed during fruit development by metabolome and transcriptome assays, respectively.AsA metabolism and the cyclic regeneration pathway were found to have high expression levels throughout fruit growth and development, suggesting its crucial role in the regulation of AsA.Furthermore, the AsA contents are highly associated with ascorbate peroxidase genes.The genome obtained in this study provides genomic resources for the genetic and breeding research of A.eriantha, and the constructed regulatory network can provide a public data platform for future research on kiwifruit.
Keywords: Actinidia eriantha, ascorbic acid, non-targeted metabolome, gapless genome, transcriptome
1.lntroduction
Actinidiaerianthais a novel berry that is uniquely distributed in China, mainly in the Yangtze River basin,the Yunnan–Guizhou Plateau and the Sichuan basin,at altitudes of 200–2 000 m (Liaoet al.2021c).To date, many excellent kiwifruit cultivars have been bred,including ‘White’ (Wuet al.2009), ‘Ganmi 6’ (Xuet al.2015), ‘Ganlv 1’ (Xuet al.2020), ‘Ganlv 2’ (Liaoet al.2022b) and others.Among them,A.erianth‘White’ was the first cultivar that was bred, and its genome has been sequenced (Tanget al.2019).The genome provides valuable information but requires improvement because of technical limitations of the previous sequencing results.In addition, the ripeA.erianth‘White’ fruit has relatively high starch and titratable acid contents, and there are many deformed fruits, soA.erianth‘White’ has not been cultivated on a large scale.Recently, we bred a newA.erianthcultivar ‘Ganlv 1’ with an extremely high sugar content from wild kiwifruit.The average soluble solid content ofA.erianth‘Ganlv 1’ fruit is 19.05%, and the highest level can reach 21.50% (Xuet al.2020).Actinidia erianth‘Ganlv 1’ has been cultivated on a large scale in Fengxin County, Nancheng County, Xinfeng County and Xunwu County in Jiangxi Province.Assembling the genome of this novel cultivar would provide a theoretical basis for future kiwifruit research.Based on Illumina sequencing, the assembly quality can be improved by using single molecule real-time (SMRT) sequencing technology to obtain more genomic information, and using interaction frequencies of sequences (Hi-C) technology to anchor the scaffolds on chromosomes.This technique has enabled the generation of greatly improved and updated genomes of numerous crops, including rice (Duet al.2017), apple (Daccordet al.2017), tea plant (Xiaet al.2020) and orange (Wanget al.2018).
Fruit ofA.erianthaare well known for their high nutrient contents, especially for their high L-ascorbic acid(AsA) content (Liaoet al.2023).AsA, or vitamin C, has important functions and antioxidant effects in organisms.It is an indispensable nutrient for human growth,reproduction and health.The AsA content inA.erianthagradually declines with the growth and development of the fruit.Many research reports on the regulatory mechanism of AsA content inA.erianthahave appeared recently, and these studies have identified many key genes, includingGGP(Liuet al.2022a),MDHARandDHAR(Liaoet al.2021), and others.Our previous study found that the expression of some key enzyme genes involved in the regulation of AsA metabolism could be regulated by light (Liaoet al.2019).Although the genes for critical enzymes that regulate AsA metabolism inA.erianthaor other kiwifruit species have been identified, the genes and transcription factors (TFs) that regulate AsA metabolism throughout fruit growth and development in kiwifruit remain unknown.
ThreeA.erianthagenomes have been assembled previously (Tanget al.2019; Yaoet al.2022; Wanget al.2023).Here, we provide a gaplessA.erianthagenome for the ‘Ganlv 1’ cultivar with a sweet taste.The genome was generated by assembling long PacBio reads and mapping scaffolds based on Hi-C interaction confirmation.We identified key metabolites, and the genes and TFs that regulate AsA content during the growth and development ofA.erianthafruit.Our findings will be valuable in the future for improving the agronomic traits and molecular breeding ofA.eriantha, including the cloning of regulatory genes for novel traits, gene mapping, and the generation of molecular markers.Furthermore, this study will provide new insights and knowledge for future AsA studies.
2.Materials and methods
2.1.Plant materials and DNA/RNA extraction
TheA.eriantha‘Ganlv 1’ plants were sampled from the Kiwifruit Germplasm Resource Garden of Fengxin County Agricultural Bureau (Jiangxi Province, China).For genome sequencing, we collected fresh young leaves.In our previous study, we obtained the fruits during the growth and development ofA.eriantha‘Ganlv 1’, and these stages were 25 d (S1), 50 d (S2), 75 d (S3), 100 d(S4), 125 d (S5), 135 d (S6), 145 d (S7), 155 d (S8) and 165 d (S9) after full bloom (Liaoet al.2021b).In the S9 period, the soluble solids of the fruit have reached the standard for commercial harvested (6.5%).Three biological replicates were set for each period.All samples were quickly frozen in liquid nitrogen and stored in a–80°C freezer.
Total RNA was extracted with a TRIzol reagent kit(Beijing TSINGKE Biotechnology Co., Ltd., China)according to the instructions of the manufacturer.Leaves were used for DNA extraction following a previously study(Liaoet al.2021b).The quality of the extracted RNA and DNA was evaluated, and only samples with OD260/OD280between 1.8 and 2.0 were used for subsequent experiments.
2.2.Sequencing and library construction
Qualified genomic DNA was isolated for Illumina and PacBio sequencing.For Illumina sequencing, a shortread library was constructed and sequenced using Illumina novaseq6000 (CA, USA).Based on the results of Illumina sequencing, we filtered the raw data using fastp (version 0.18.0) and performed a K-mer analysis using Jellyfish (version 2.2.6) (Chenet al.2018).Finally,GenomeScope (version 1.0.0) was then used to estimate the genome size, genome repeat ratio, and genome heterozygosity (Ranallo-Benavidezet al.2020).
For PacBio sequencing, DNA fragments of >20 kb were selected for library construction using BluePippin (SAGE).The PacBio library was prepared using SMRTbell Template Prep Kit-SPv3, following the manufacturer’s recommendations, and sequenced on the Pacific Biosciences Sequel System at the Gene Denovo Co.,Ltd.(Guangzhou, China) to produce third generation long read data.Then SMRTbell libraries were constructed according to the standard protocol of PacBio using 15 kb preparation solutions (Pacific Biosciences, CA).Finally,the SMRTbell libraries were sequenced on a PacBio Sequel II instrument with Sequencing Primer V2 and a Sequel II Binding Kit (version 2.0) at the Genome Center of Grandomics.
2.3.Genome assembly and quality evaluation
After filtering out the low-quality reads and sequence adapters, the HiFi reads were obtained and assembled using Hifiasm (version 0.15.1-r334) with default parameters(Chenget al.2022).A total of 64.03 Gb of clean Hi-C data was obtained for anchoring the contig onto the chromosome and then the Hi-C reads were aligned to the assembly by BWA (version v0.7.17-r118828) (Li and Durbin 2009).3D-DNA (version v180114) (Dudchenkoet al.2017) was then used to scaffold the draft assembly genome with the Hi-C reads.Then, the sequence was filtered and clustered by Juicer, and the adjustments of the chromosome structure were completed by the Juicer box tool.Finally, the scaffolds were concatenated into 29 chromosomes.Using the specific telomere sequence (CCCTAAA) of plants as a probe, Bowtie2 Software was used to perform telomere analysis and the results were visualized by the RIdeogram package (Langmead and Salzberg 2012).
In order to evaluate the accuracy of genome assembly and sequencing, the Illumina short reads data were realigned to the genome assembly to obtain the key statistical indicators, including mapping rate, genome coverage, depth distribution, and homozygous and heterozygous SNP numbers.In addition, the CEGMA(Core Eukaryotic Genes Mapping Approach) (Parraet al.2007) and BUSCO (Benchmarking Universal Single-Copy Orthologs) (Sim?oet al.2015) pipelines were performed to evaluate the completeness and accuracy of theA.erianthagenome with the embryophyte_odb10 dataset.The consensus quality value and continuity were assessed by Mequery (v1.3) (Rhieet al.2020) and the LTR assembly index (LAI) (Ouet al.2018), respectively.
2.4.Genome annotation
Three main kinds of sequences were annotated, including non-coding RNA (ncRNA), repeat sequence annotation and coding gene annotation, among which the coding gene annotation was divided into coding gene structure annotation and coding gene function annotation.Noncoding RNA annotation mainly annotates RNAs with known functions such as rRNA, tRNA, snRNA, and RNAs with unknown functions.Among them, rRNA was annotated by RNAmmer Software (Lagesenet al.2007), while tRNA regions and tRNA secondary structures were annotated by tRNAscan-SE Software (Chan and Lowe 2019), and sRNA and miRNA were annotated by comparison with the Rfam Database (https://rfam.org/).Repeated sequences include interspersed repeats and tandem repeats.Tandem repeats were annotated by Tandem Repeats Finder (TRF)Software (Benson 1999).Interspersed repeat annotation was performed by a combination of the signature,de novoand homology construction methods.
For coding gene annotation, firstly, based on the Hidden Markov Model (HMM), Augustus (Stankeet al.2006) and GeneMark Software (Lukashin and Borodovsky 1998) were used for genome-wide gene coding gene prediction.Then the complete protein sequences of three published kiwifruit genomes and the SwissProt plant database were used to predict homology and the transcriptome data during the growth and development ofA.eriantha‘Ganlv 1’ fruit were integrated by HISAT2 (Kimet al.2015) and StringTie (Perteaet al.2015) to obtain the predicted gene set of the transcriptome.Finally, the obtained transcriptome evidence, homology evidence andde novoevidence were integrated according to the sequence of transcriptome data>homology evidence>de novoevidence to obtain the final gene set.The coding gene structure annotation mainly counts the length distributions of various gene elements, including gene, CDS, exon, intron, etc.The coding gene function annotation was first used to align the protein sequence of the predicted gene with different protein function databases (NR, SwissProt, KEGG, COG, and GO) by BLAST (version 2.2.29+), and then used the aligned sequence function as a function of the target sequence,and filtered with the threshold of e-value≤1e–5.
2.5.Phylogenetic evolution and gene family analysis
Orthologous gene clusters betweenA.erianthaand other representative plants, includingA.chinensis,A.rufa,Vitis viniferaandCamelliasinensis, were identified using the OrthoMCL program (Liet al.2003).The phylogenetic tree was constructed with IQ-TREE, the optimal replacement model was selected as the “GTR+F+I+G4” model, and rice (O.sativa) was set as the outgroup (Nguyenet al.2015).We estimated the species divergence times using MCMCTREE (v4.0) within the PAML package(Yang 2007).The estimated divergence times forOryza sativa–Arabidopsisthaliana(148–174 million years ago(Mya)),A.thaliana–V.vinifera(113–128 Mya),Solanum tuberosum–C.sinesis(101–120 Mya),C.sinesis–A.chinensis(76–100 Mya) andS.tuberosum–Solanumesculentum(34–40 Mya) in TimeTree (http://www.timetree.org) were used to calibrate the tree.In the gene family expansion or contraction analysis with CAFE (Bieet al.2006), the genes were considered to be significantly expanding/contracting only when “Family-wideP-values”and “ViterbiP-values” were both below 0.05.Variation sites between the genomes ofA.erianthaand the genomes ofA.rufawere detected with TBTools (Chenet al.2020), and the output was set to include only the information for fragments with a size of 30–300 bp.The collinearity between the published kiwifruit genome and our assembled genome was also analyzed by TBTools(Chenet al.2020).
2.6.Synteny and WGD
BLASTP (e-value<1e–5) was applied to perform a homolog search with theA.erianthagenome.MCScanX was employed to screen syntenic blocks (Wanget al.2012), defined as regions with more than five collinear genes between paired genomes.Finally, we determined whole genome duplication (WGD) events inA.erianthabased on the synonymous substitution (Ks) values of paralogous blocks inA.eriantha, which were calculated by FASTK (https://github.com/mrmckain/FASTKs).
2.7.RNA-Seq and non-target metabolome analysis
The constructed cDNA library was sequenced with Illumina nove6000 (Illumina, San Diego, CA, USA).Library construction and computer sequencing were completed by Gene Denovo Co., Ltd.The fruit ofA.eriantha‘Ganlv 1’ throughout growth and development (DAF 75 d, DAF 125 d, DAF 135 d,DAF 145 d, DAF 155 d, and DAF 165 d) were used for RNA-Seq and non-target metabolome sequencing by Gene Denovo Co., Ltd.The genome assembled in this study was selected as the reference genome for data analysis.WGCNA analysis was performed on the Omicsmart platform of the Gene Denovo Co., Ltd., and the trait data used for WGCNA analysis are shown in Appendix A.The identification of gene family members refers to a previous method (Liaoet al.2022a).
2.8.Data analysis
The experimental data were statistically analyzed and processed with Microsoft Excel 2016 and the SPSS statistical package (IBM SPSS Statistics 22.0).Origin 2018 was used to draw the line and column charts.A two-tailed Student’st-test was used to detect significant differences atP≤0.01.
3.Results
3.1.Assembly and annotation of a gapless genome for A.eriantha
TheA.erianthacultivar ‘Ganlv 1’ (Fig.1-A) was used for genome assembly, and the size of the genome was estimated to be 635.44 Mb by 17 K-mer distribution analysis, with heterozygosity of 0.91% (Appendices B and C).Subsequent PacBio sequencing obtained a total of 33 637 534 779 read bases with an average length of 16 792 bp (Appendices C and D).After filtering, a total of 19 284 418 500 clean reads were used for the subsequent analyses.Compared with the survey sequencing results,the PacBio sequencing results were proofread, and a 605.88-Mb genome was assembled with a GC content of 35.98% based on the PacBio sequencing (Appendix E).The Benchmarking Universal Single-Copy Orthologs(BUSCO) was 95.23% (Appendix F).
In total, 69 590 820 900 raw paired-end reads were produced during construction of the Hi-C sequencing library, and 68 754 516 737 clean reads were obtained after filtering (Appendix G).Using EndHic, 96.51% of the draft genome was anchored into 29 pseudochromosomes(2n=58), and there were strong interaction signals between the chromosomes, indicating that the assembled genomes by Hi-C had high quality (Appendix H-a).The final chromosome-level genome assembly ofA.erianthawas 615.95 Mb with contig N50 of 20.35 Mb, and the pseudochromosome lengths ranged from 14.86 to 27.32 Mb(Table 1; Fig.1-B; Appendix I).The orientation rate of the contigs used to assemble the genome was 100%, and 24 chromosomes were directly composed of the contigs.Chr01 was composed of a contig and it was the longest contig.In addition, telomeres were detected on both ends of 19 chromosomes (Appendix H-b).Compared with the previously published genome ofA.eriantha, the assembled genome has the best quality, with only five gaps and a gap size of 5 000 bp (Table 1; Appendices J and K), and there was fine collinearity between the published genome ofA.erianthaand ‘Ganlv 1’ (Appendix H-c and d).Furthermore, the BUSCO was highest,reaching 97.71% (Table 1; Appendix L).All the abovementioned genome indices indicated that thede novoassembled genome forA.erianthais of high quality.
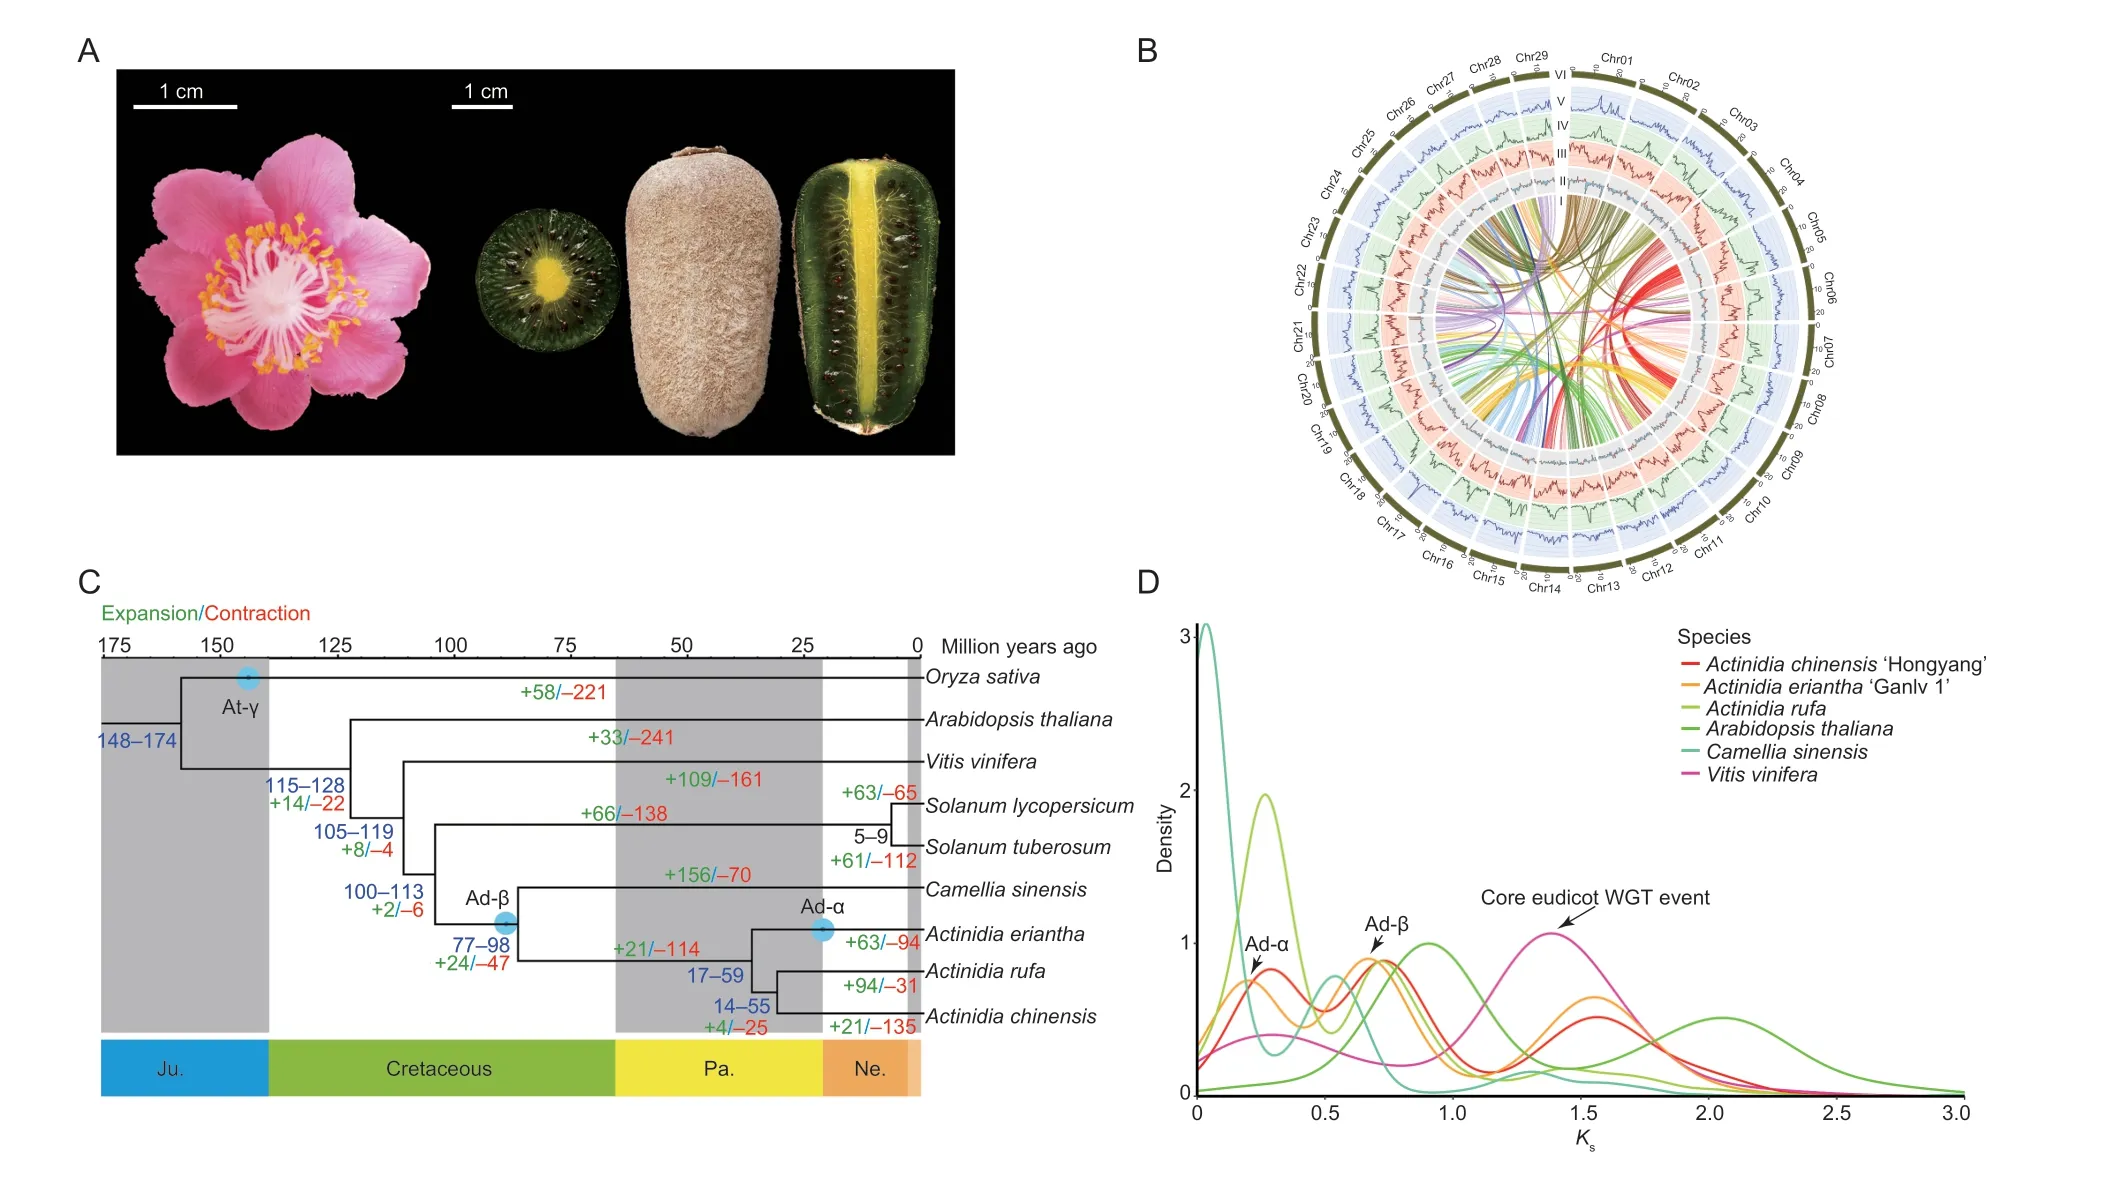
Fig.1 Phylogenetic analysis of the Actinidia eriantha cv.‘Ganlv 1’ genome.A, the flower and ripened fruit (edible state) of A.eriantha cv.‘Ganlv 1’.B, the high-quality genome assembly of A.eriantha cv.‘Ganlv 1’ allows the visualization of genomic details (window size=500 kb).I–VI represent the chromosomes, density of Copia LTR-RTs, density of Gypsy LTR-RTs, gene density distribution, GC content distribution and syntenic blocks across A.eriantha, respectively.C, phylogenetic tree of A.eriantha and other representative plants based on 1 101 single-copy homologous genes.The expansion and contraction of gene families,and potential whole genome duplication (WGD) events among these species are shown on the tree.The green and red numbers mapped to the species phylogenetic tree indicate gene families that have undergone expansion and contraction, respectively.D,distribution of synonymous substitution rates (Ks) for pairs of syntenic paralogs in A.eriantha and five other genomes.
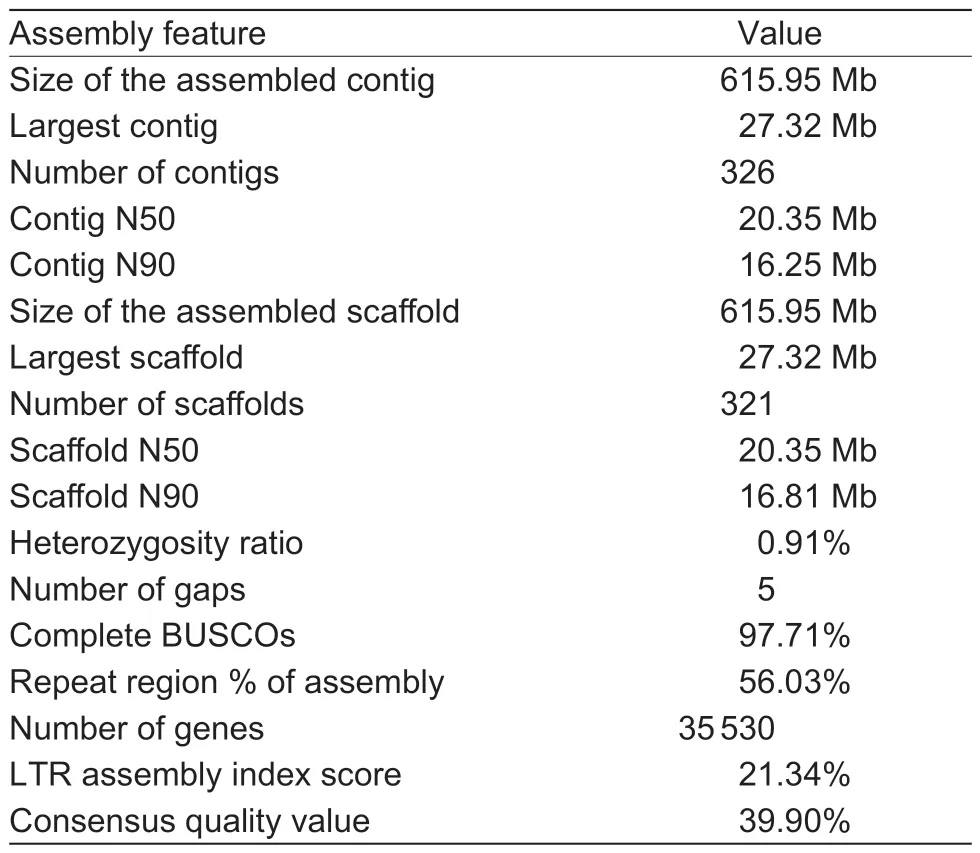
Table 1 Statistics for the assembled genome and published Actinidia eriantha genomes
Based on genome annotation, we predicted 35 530 protein-coding genes, with an average coding sequence length of 1 262 bp and an average exon length of 262 bp (Table 1; Appendix K).Finally, 93.51% of the predicted genes were annotated using various databases(Appendices M and N), and BUSCO analysis of thede novoassembled genome was 96.72% complete(Appendix O).In addition, 791 transfer RNA, 2 907 ribosomal RNA (rRNA), 924 small nuclear RNA, and 520 microRNA (mRNA) genes were predicted (Appendix P).In thisde novogenome, the repeat sequences accounted for 56.03%, with LTR retrotransposons accounting for 21.29% of the genome, 8.22% of which were of thecopiatype and the remaining 13.07% were thegypsytype (Fig.1-B; Appendix Q).The LTR assembly index score and consensus quality value were 21.34 and 39.90%, respectively, indicating the high accuracy of our assemblies (Table 1).
3.2.Evolutionary and comparative genomic analyses
To gain insights into the evolution of theA.erianthagenome, we performed a comparative genomic analysis usingV.vinifera,C.sinensisand threeActinidiaplants.In total, 1 101 shared single-copy homologous genes from these species were identified and used for phylogenetic analysis (Fig.1-C).Based on the known divergence times of rice and tomato, the most recent common ancestor(MRCA) ofActinidiadiverged from the MRCA ofC.sinensis~77–98 Mya, and the MRCA ofA.erianthadiverged from the MRCA ofA.chinensisandA.rufa~17–59 Mya(Fig.1-C).The distributions ofKsanalyses indicated that the established palaeohistory ofA.erianthawas consistent with those reported inA.chinensis, including Ad-α, Ad-β (the two kiwifruit-specific events) and the common core eudicot γ event (Fig.1-D).Further gene family analysis demonstrated that 63 gene families were expanded in theA.erianthagenome, while 94 were contracted (Fig.1-C).Based on sequence homology,11 700 gene families were shared amongActinidia, while 16 110 gene families were shared betweenA.erianthaandA.chinensis, and 16 032 gene families were shared betweenA.erianthaandA.rufa(Appendix R).We finally compared the variation sites between the genomes ofA.erianthawith high AsA content and the genomes ofA.rufawith low AsA content, and found a total of 25 variants of 30–300 bp fragments inA.eriantha.Among these variants, 14 fragments were inserted, and the longest insertion fragment was 225 bp; while 11 fragments were deletions, and the longest deletion fragment was 113 bp (Appendix S).
3.3.ldentification of the metabolites associated with AsA metabolism
Non-target metabolomic technology was used to detect metabolites during the growth and development ofA.erianthafruit, and a total of 7 464 metabolites were detected in positive and negative ion modes (POS and NEG), including 1 818 known metabolites (Appendix T).In addition, we also noted which metabolites were enriched inA.erianthaat the harvest stage.In the NEG mode, theA.erianthafruit was rich in citric acid, AsA and alpha-linolenic acid (Fig.2-A), and in the POS mode, it was rich in L-arginine, (2E)-decenoyl-ACP, 3-hydroxy-2-isobutyrate, and melibiose (Fig.2-B).To determine which metabolites are closely related to AsA metabolism,we adopted a strategy of comparing all stages with the young fruit stage (S3) based on PCA analysis (Fig.2-C),and found a total of 61 differential metabolites (Fig.2-D).According to the expression patterns of these differential metabolites during fruit development, we divided them into six categories (Fig.2-E).Among them, AsA is in the first category, and the metabolites clustered with AsA were very likely to be closely related to the metabolism of AsA.
3.4.ldentification of key candidate genes associated with AsA metabolism
The samples used for the metabolome analysis were also used for transcriptome analysis in order to identify the key candidate genes associated with AsA metabolism.Consistent with the metabolome, the PCA analysis of the transcriptome also found that the S3 period was located in a single quadrant, indicating that the identification of differentially expressed genes in the transcriptome could adopt a metabolome comparison strategy (Fig.3-A).A total of 2 092 genes were found to be co-expressed in all comparisons (Fig.3-B).These genes could be divided into 20 expression patterns according to their expression patterns during fruit growth and development, among which the expression patterns of profile0 and the middle profile19 were significantly correlated with the AsA metabolic pathway (Fig.3-C; Appendix U).In addition,the 37 140 genes detected in the transcriptome were used for WGCNA analysis with 16 indicators of fruit, and these genes could be divided into 20 modules (Fig.3-D).There was a significant positive correlation between AsA and three of the modules, and a significant positive correlation between starch content and seven of the modules(Appendix V).These results will be helpful for future research on the regulation of fruit quality in kiwifruit.
The co-differentially expressed genes could be divided into four modules based on the WGCNA analysis, in which the correlation between AsA content and the blue module was as high as 0.94 (Appendix W).We clarified the mutual regulation coefficients between these differential genes, which can be used to construct an intergenic regulatory network (Fig.3-F).In addition,through KEGG analysis, these DEGs were enriched in 115 metabolic pathways, of which 7 DEGs were enriched in the ascorbate and aldarate metabolism pathway.These genes were in the D-galacturonic acid pathway (1), inositol pathway (4), L-gulose pathway (1)and oxidative degradation pathway (1).Some TFs were highly correlated with the above differential genes and were considered to be critical TFs (Appendix X).As for the cyclic regeneration pathway, we found that the genes of this pathway had high expression levels throughout the fruit growth and development period, but there were no significant differences between the samples (Fig.3-E).
3.5.Metabolome and transcriptome association analysis
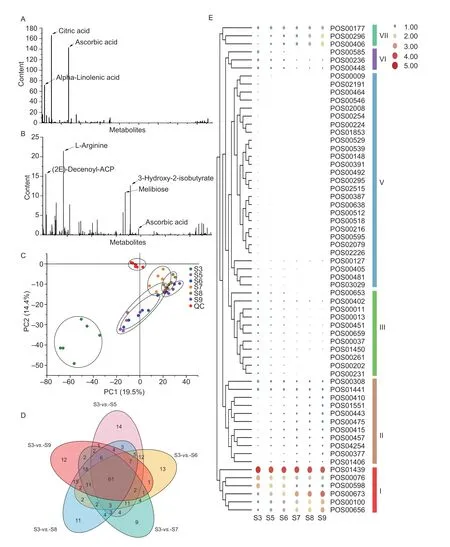
Fig.2 Identification of key differential metabolites.A, statistical results of known metabolites in the negative ion mode (NEG).B, statistical results of known metabolites in the positive ion mode (POS).C, PCA analysis.D, Venn analysis comparing the groups.E, clustering and heatmap analysis of key differential metabolites, where larger circles or redder colors represent higher expression levels.
The two-way orthogonal partial least squares (O2PLS)model was used for the association analysis of the metabolome and the transcriptome.The model contribution results showed that the metabolome and transcriptome explained the total variation to a high degree and could be used for the subsequent association analysis (Appendix Y).In order to determine which metabolites and genes are associated with each other,we drew different omics loading plots for the variables in the joint part.The data in Fig.4-A show that most of the metabolites are strongly associated with genes.In addition, according to the results of the loading values,we screened out the top 25 genes and metabolites based on the square of the first two dimensions of the loading value and integrated the loading map to show the genes and metabolites with the greatest degree of association(Fig.4-B).We performed the association analysis on all differential genes and all metabolites, and selected only the differential genes related to AsA metabolism to map the regulatory network between the genes and metabolites,and found that AsA can be directly associated withAPX11andAPX13(Fig.4-C).In addition, theAPXandMIOXgene members can regulate a variety of metabolites, which may be closely related to the function of AsA.
4.Discussion
4.1.Assembly of a nearly gap-free genome of A.eriantha
In this study, we sequenced and assembled a highquality reference genome ofA.eriantha‘Ganlv 1’, which is a new easy-peel cultivar with high soluble solids content (average is 19.05%) and AsA content (average is 745.37 mg 100 g–1) (Liaoet al.2021c).The current assembly of theA.eriantha‘Ganlv 1’ genome comprises 29 chromosomes with a contig N50 length of 20.35 Mb,which is approximately 11.83- and 38.65-fold greater than the N50 lengths of the previously reportedA.chinensisv3(1.72 Mb) (Wuet al.2019) andA.eriantha‘White’ (539.20 kb)(Tanget al.2019) assemblies, respectively.The number of gaps in theA.eriantha‘Ganlv 1’ genome is only five,which is far less than 14 163 forA.chinensisv1 (Huanget al.2013), 25 310 forA.chinensisv2 (Pilkingtonet al.2018), 646 forA.chinensisv3 (Wuet al.2019), 2 341 forA.eriantha‘White’ (Tanget al.2019) and 709 for wildA.eriantha(Yaoet al.2022).In addition, the repeat sequence and LTR lengths, gene annotation ratio, and BUCSO coefficient of the assembled genome have been greatly improved compared with the genome ofA.eriantha‘White’.This referenceA.erianthagenome sequence provides a solid foundation for elucidating the gene functions and evolutionary trajectories ofA.eriantha,and it also facilitates investigations into the regulatory mechanisms driving some novel traits ofA.eriantha, such as high AsA content, easy peeling, and others.
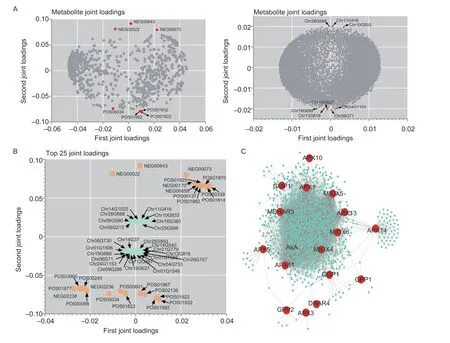
Fig.4 Metabolome and transcriptome association analysis.A, O2PLS loading diagram, where the loading value indicates the explanatory power of the variable (metabolite/gene) in each component, the positive or negative loading value indicates a positive or negative correlation with another omics, and the larger the absolute value of the value, the stronger the association.B, correlation load diagram, where only the top 25 genes and metabolites with the strongest associations are shown.C, regulatory network between ascorbic acid metabolism-related genes and metabolites, with red circles for metabolic genes, and turquoise circles for metabolites.
On the basis of this high-qualityA.erianthagenome,we confirmed that the Ad-β event was shared with tea and kiwifruit, so the Ad-β event occurred before kiwifruit differentiation from tea tree.This is consistent with recent research reports (Weiet al.2018).The size of the assembled genome, and the numbers of gene families undergoing expansion and contraction were also smaller than previously reported (Tanget al.2019;Wuet al.2019; Yaoet al.2022), which is related to the improvement of genome quality, and may also be related to the sampling location of the cultivar which was used for genome assembly.The cultivar used to assemble the genome in this study was collected from the Wuyi Mountains whereA.erianthaoriginated (Guoet al.2022;Zhanget al.2023).The other species used to assemble the genomes were collected from Zhejiang and Hunan provinces.In addition, we also found that many variant fragments existed between the two kiwifruit genomes with great differences in AsA content, and these variants may be related to the regulation of AsA production between these two kiwifruit species.
4.2.Nutritional and aroma-related metabolites are closely related to AsA metabolism
Previous studies have reported thatA.erianthapulp is rich in citric acid and AsA (Liaoet al.2021c), and our study also identified many metabolites that were not previously reported despite being abundant inA.erianthapulp, such as alpha-linolenic acid, (2E)-decenoyl-ACP, 3-hydroxy-2-isobutyrate and melibiose.Among them, alpha-linolenic acid has the functions of softening blood vessels, lowering blood lipids, lowering blood pressure, and promoting fat metabolism, and it is one of the essential fatty acids in the human body (Lorgerilet al.1994).Importantly, alphalinolenic acid has only been reported in kiwifruit seeds (Wanget al.2017), so this is the first report that alpha-linolenic acid is rich in kiwifruit pulp.In addition, we also found thatA.erianthapulp is rich in melibiose, a disaccharide formed by combining glucose and galactose.Although melibiose is widely present in the plant, it is present in very low amounts.In this study, the fruit of kiwifruit was found to be rich in melibiose, which may be one of the important reasons for the unique flavor ofA.eriantha.Finally, according to the cluster analysis of differential metabolites, we found that the metabolites preferentially clustered with AsA were all medicinal, sugars and aldehydes with higher content in the fruits.Among them, the sugars and aldehydes are closely related to the formation of fruit flavor and aroma, which is probably closely related to the role of AsA in plants.The metabolome data in our study will further advance the study of the medicinal mechanism of kiwifruit, and the combined analysis of the metabolome and transcriptome will provide a reference for the identification of key regulatory genes of the metabolites.
4.3.Different pathways may function in different stages during fruit development of kiwifruit
Among the many reports on the regulation of AsA related genes in kiwifruit, few have investigated the regulatory relationships between transcription factors (TFs) and functional genes (Liaoet al.2021a; Liuet al.2022a).In this study, we not only identified the key genes regulating AsA content during fruit growth and development, but also constructed a regulatory network between the TFs and genes.These findings were consistent with previous reports (Liaoet al.2021c; Liuet al.2022), and the functions of these key genes will be validated on the basis of this high-quality genome.
The synthesis, degradation and regeneration pathways of AsA have been fully studied in kiwifruit (Liaoet al.2021a;Liuet al.2022b).Actinidiaeriantharapidly synthesizes AsAviathe L-galactose pathway within 30 d after flowering, but loses the dominant synthesis during the subsequent fruit development period (Liuet al.2022a).Our understanding of the regulatory mechanism of AsA metabolism in the middle and late stages of fruit development is insufficient.There is also some controversy about whether the inositol pathway and L-gulose pathway play a role in the regulation of AsA.Interestingly, we performed RNA-Seq sequencing on fruits in the middle and late stages of development and found that these pathways related to AsA metabolism take over dominant roles during fruit development, except for the L-galactose pathway (Liaoet al.2021a).The inositol pathway and the D-galacturonic acid pathway played a leading role in the middle stage of fruit development,while the L-gulose pathway played a leading role after the fruit seeds turned color, and the oxidative degradation pathway played a leading role in the harvesting stage.As for the cyclic regeneration pathway, the genes involved in this pathway were highly expressed throughout fruit development, suggesting that this pathway plays a role throughout fruit development.Our previous study showed that the AsA content inA.erianthawas regulated by multiple pathways (Liaoet al.2021a), however, the stage of fruit growth and development at which these pathways play critical roles was not clear.The results of this study can provide a new perspective for further exploration of the metabolic mechanism of AsA.
5.Conclusion
This study provided a high-quality genome forA.eriantha, and the assembledA.erianthagenome has clear improvements in contiguity, accuracy, and gene annotation.Combining metabolomics and transcriptomics,we identified a number of key metabolites, genes and TFs that regulate AsA metabolism.The cyclic regeneration pathways play critical roles in AsA regulation throughout fruit development, and nutritional and aroma-related metabolites are closely related to AsA metabolism.
Acknowledgements
We are grateful to Prof.Xu Qiang, Postdoctoral Huang Yue and doctoral candidate Liu Shengjun from Huazhong Agricultural University, China for their help in genome quality assessment.This project was supported by the National Natural Science Foundation of China (32160692 and 31760559), and the Key Research and Development Plan from Jiangxi Science and Technology Department,China (20192ACB60002).
Declaration of competing interest
The authors declare that they have no conflict of interest.
Appendicesassociated with this paper are available on https://doi.org/10.1016/j.jia.2023.07.018
 Journal of Integrative Agriculture2023年11期
- Journal of Integrative Agriculture的其它文章
- Germplasm and molecular breeding in horticultural crops
- Development and application of KASP marker for high throughput detection of the seedless trait in grapevine
- QTL analysis of early flowering of female flowers in zucchini(Cucurbita pepo L.)
- A novel mutation in ACS11 leads to androecy in cucumber
- Comprehensive analysis of the full-length transcripts and alternative splicing involved in clubroot resistance in Chinese cabbage
- Virucidal activity of MICRO-CHEM PLUS against African swine fever virus