
Maize straw application as an interlayer improves organic carbon and total nitrogen concentrations in the soil profile: A four-year experiment in a saline soil
2023-06-07 11:30:06CHANGFangdiWANGXiquanSONGJiashenZHANGHongyuanYURuWANGJingLlUJianWANGShangJlHongjieLlYuyi
CHANG Fang-di ,WANG Xi-quan ,SONG Jia-shen ,ZHANG Hong-yuan ,YU Ru ,WANG Jing ,LlU Jian,WANG Shang,Jl Hong-jie,Ll Yu-yi#
1 Institute of Agricultural Resources and Regional Planning, Chinese Academy of Agricultural Sciences, Beijing 100081, P.R.China
2 The Norwegian Institute of Bioeconomy Research (NIBIO), As 1431, Norway
3 Department of Soil and Plant Microbiome, Institute of Phytopathology, Christian-Albrechts-University of Kiel, Kiel 24118, Germany
Abstract Soil salinization is a critical environmental issue restricting agricultural production.Deep return of straw to the soil as an interlayer (at 40 cm depth) has been a popular practice to alleviate salt stress.However,the legacy effects of straw added as an interlayer at different rates on soil organic carbon (SOC) and total nitrogen (TN) in saline soils still remain inconclusive.Therefore,a four-year (2015–2018) field experiment was conducted with four levels (i.e.,0,6,12 and 18 Mg ha–1) of straw returned as an interlayer.Compared with no straw interlayer (CK),straw addition increased SOC concentration by 14–32 and 11–57% in the 20–40 and 40–60 cm soil layers,respectively.The increases in soil TN concentration (8–22 and 6–34% in the 20–40 and 40–60 cm soil layers,respectively) were lower than that for SOC concentration,which led to increased soil C:N ratio in the 20–60 cm soil depth.Increases in SOC and TN concentrations in the 20–60 cm soil layer with straw addition led to a decrease in stratification ratios (0–20 cm:20–60 cm),which promoted uniform distributions of SOC and TN in the soil profile.Increases in SOC and TN concentrations were associated with soil salinity and moisture regulation and improved sunflower yield.Generally,compared with other treatments,the application of 12 Mg ha–1 straw had higher SOC,TN and C:N ratio,and lower soil stratification ratio in the 2015–2017 period.The results highlighted that legacy effects of straw application as an interlayer were maintained for at least four years,and demonstrated that deep soil straw application had a great potential for improving subsoil fertility in salt-affected soils.
Keywords: straw addition,interlayer,soil organic carbon,soil nitrogen,C:N ratio,saline soil
1.lntroduction
Globally,approximately 1.1×10⁹ha of land is affected by soil salinity (Hopmanset al.2021),which is threatening agricultural production,soil health,and food security (Sahabet al.2020).China,for instance,has approximately 3.6×10⁷ha of saline soils which possess great potential for agricultural utilization after amelioration(Rezapouret al.2017;Yanget al.2022).Saline soil is important in global carbon (C) and nitrogen (N) cycling which are influenced by human intervention (Setiaet al.2011) and more effort is needed to explore the C and N dynamics in saline soils.
Straw return is widely recommended to maintain and increase soil C and N contents (Xiaet al.2018).However,contradictory effects of straw return on soil C and N have been observed with different amounts of straw return (Jinet al.2020),due to differing local climatic conditions,soil properties,and straw management (Haoet al.2022).Soil organic carbon (SOC) content usually increases with the amount of straw input (Louet al.2011;Jinet al.2020),while insufficient straw amendment weakens soil C and N sequestration due to the limited C input (Zhanget al.2016).However,excessive straw return usually results in an undesirable soil C:N ratio (Zhanget al.2015),restricts straw decomposition rate (Shahbazet al.2017),and reduces crop production (Islamet al.2022).Saline soil always has low soil C and N contents (Huoet al.2017),excessive exchangeable Na+content,poor soil structure,and slow C sequestration rates (Heet al.2022).Deep return of straw as a soil interlayer is an effective strategy for saline soil amelioration (Zhaoet al.2013a,b),as it improves soil structure (Conget al.2019),regulates the soil microbial community (Liet al.2016),and boosts crop yield (Zhaoet al.2016).It is important to quantify soil C and N concentration response to straw return in saline soil and explore the effects of straw return on saline soil productivity.
The legacy effect of deep straw return on soil C and N concentration is influenced by the amount of straw input (Zhaiet al.2021).Conget al.(2019) found that the highest SOC concentration in the 20–40 cm soil depth layer in the first year after deep burial occurred when 12 Mg ha–1straw was added,however in the second year it was the highest when 18 Mg ha–1of straw was added.Further investigation is needed in saline soils which have poor chemical and physical protection for SOC (Heet al.2022).Soil C and N concentrations in different soil layers vary widely depending on the straw management(Dikgwatlheet al.2014),and large increases in soil C and N are usually found in soil layers near where the straw is applied (Wanget al.2015;Wuet al.2022).For example,deep straw return at 20–40 cm soil depth increased SOC content by only 8% in the topsoil (0–20 cm),but by up to 27% in the subsoil (20–40 cm) (Zhenget al.2021).Deep soil straw return resulted in low stratification ratio of SOC,indicating uniform SOC distribution in the soil profile (Franzluebbers 2002).Furthermore,the increased stratification ratio of SOC may be related to the rate and amount of SOC sequestration (Zhaoet al.2015;Liuet al.2021).Compared to SOC content,similar or opposite responses of soil total nitrogen (TN) content to straw return have been detected (Xiaet al.2018;Wanget al.2021),which led to varied soil C:N ratios.Thus,it is necessary to determine the impacts of deep straw return on SOC,TN,C:N ratio,and stratification ratio,as well as the influence of experimental length (Berhaneet al.2020),soil depth (Liuet al.2021),and the amount of straw input(Conget al.2019) on these parameters.
We conducted a four-year field experiment with four input levels of straw interlayered at 40 cm depth in the moderately saline soil of Hetao Irrigation District,China.We hypothesized that: (1) deep straw return as an interlayer at 40 cm soil depth would increase the SOC and TN concentrations in the soil above (20–40 cm) and below(40–60 cm) the straw interlayer,resulting in a more uniform distribution of SOC and TN in the soil profile,and (2) a greater application rate of straw would be conducive to greater SOC and TN accumulation in the year after straw burial.We aimed to: (1) quantify the effects of different rates of straw application as an interlayer on SOC and TN within the 0–80 cm soil depth in the four years after straw burial;and (2) determine the optimal rate of straw application as an interlayer in the semi-arid saline soil.
2.Materials and methods
2.1.Study site
The field experiment was conducted in 2015–2018 at Yichang Irrigation Station (41°07′N,108°00′E,1 022 m a.s.l.),in Wuyuan County,Inner Mongolia,China.This region has a semi-arid climate,with annual active accumulated temperature (≥10°C) of 3 100°C.The average annual precipitation is~200 mm,whereas potential evaporation is~2 200 mm,indicating severe water deficit for crop production (Zhanget al.2019).Precipitation mainly occurs in summer and autumn,and the accumulated precipitation during the crop growing season (i.e.,May–October) was 77,150,104,and 136 mm in 2015,2016,2017 and 2018,respectively(Fig.1).The soil is classified as chloride-sulfate moderate saline soil (4.0 g salt kg–1soil) and has a silty loam texture.Basic chemical properties in the 0–20 cm layer were: SOC 6.6 g kg–1,TN 0.6 g kg–1,total phosphorus 0.7 g kg–1,alkaline hydrolyzed nitrogen 57.3 mg kg–1,available phosphorus 10.2 mg kg–1,and available potassium 139 mg kg–1.Soil nutrient concentrations in deeper soil layers (20–100 cm) are shown in Table 1.More information of the study site has been provided in Zhanget al.(2020).
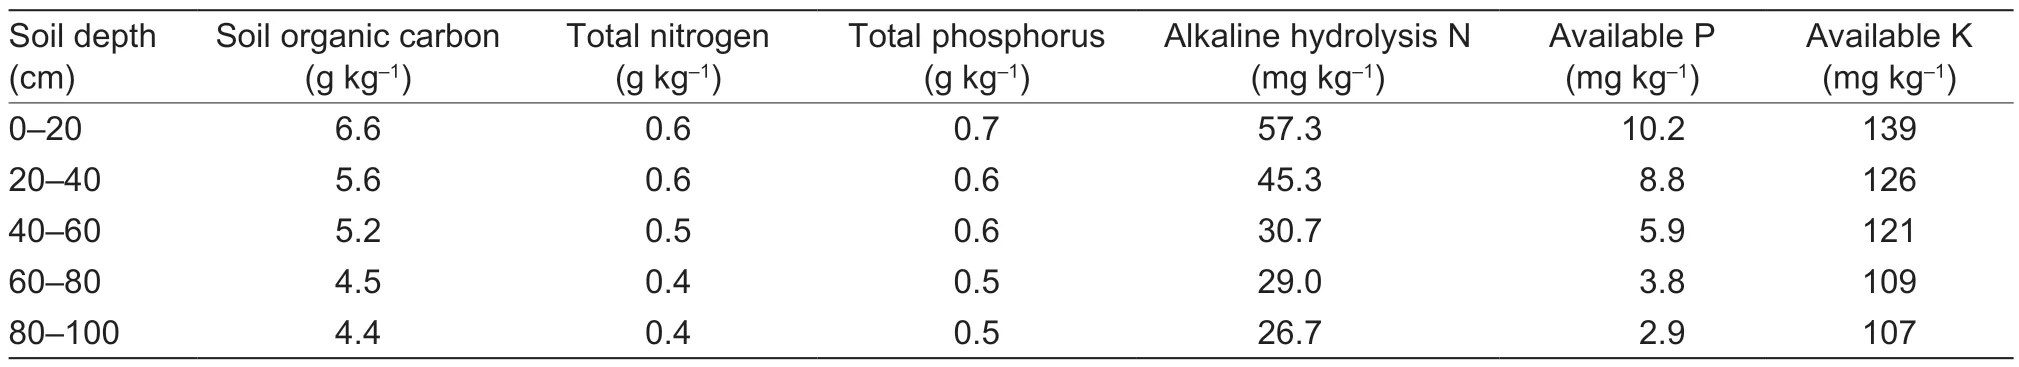
Table 1 Nutrient concentrations in the 0–100 cm soil layer of the experimental plots measured before starting the field experiment(May 2015)
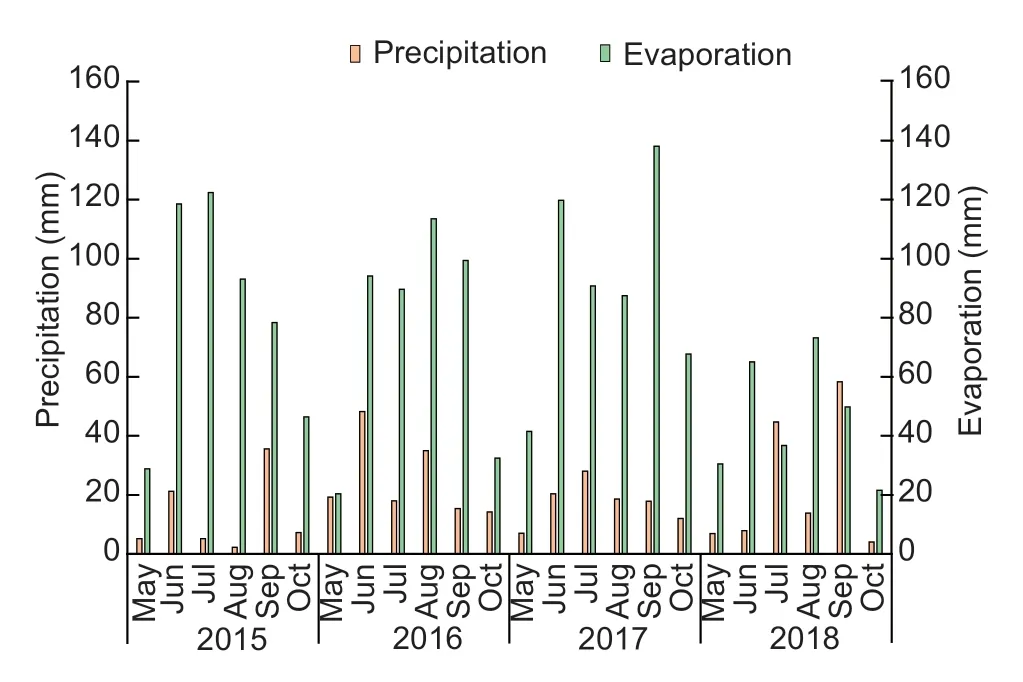
Fig.1 Monthly precipitation and evaporation in the growing period (2015–2018).
2.2.Experimental design
Four straw interlayer treatments were arranged in a completely randomized design with three replications.The four treatments consisted of different straw application rates of 0,6,12,and 18 Mg ha–1(CK,SL6,SL12,and SL18,respectively) (Fig.2).Each plot was 3.24 m2(1.8 m×1.8 m) and separated from adjacent plots using double-plastic sheets buried from the soil surface to a soil depth of 100 cm to ensure no salt or water transport between adjacent plots.The top 40 cm of soil was removed in 20 cm deep layers using a spade and the soil was placed aside chopped maize straw (C=42%,N=0.7%) as an interlayer material was uniformly placed at the 40 cm depth according to the amount required for each treatment in the first year.The removed soil was then replaced layer-by-layer and compacted according to the original soil bulk density.No additional straw was applied in subsequent years.The soil plots without a straw interlayer (i.e.,CK) was removed and replaced in a similar manner to ensure similar soil disturbance.The plots were fertilized with 180 kg N ha–1,53 kg P ha–1,and 62 kg K ha–1as base fertilizers,applied as urea (N=46%),diammonium phosphate (N=18%,P=20%),and potassium sulphate(K=41%).The mixed fertilizers were strip applied to the sowing row at a depth of~10 cm.All plots were mulched with plastic film at a width of 70 cm and a spacing of 20 cm every year,and flood irrigated with 185 mm water from the Yellow River (salt concentration 0.58 g L–1) per plot before sowing.The test crop used was sunflower (Helianthus annuusL.),which was manually seeded during May 18–31 at a row spacing of 60 cm and a plant spacing of 20 cm with plastic film mulching.The crop was harvested by manual removal of sunflower heads in September 19–24.Other field management practices are shown in Appendix A.
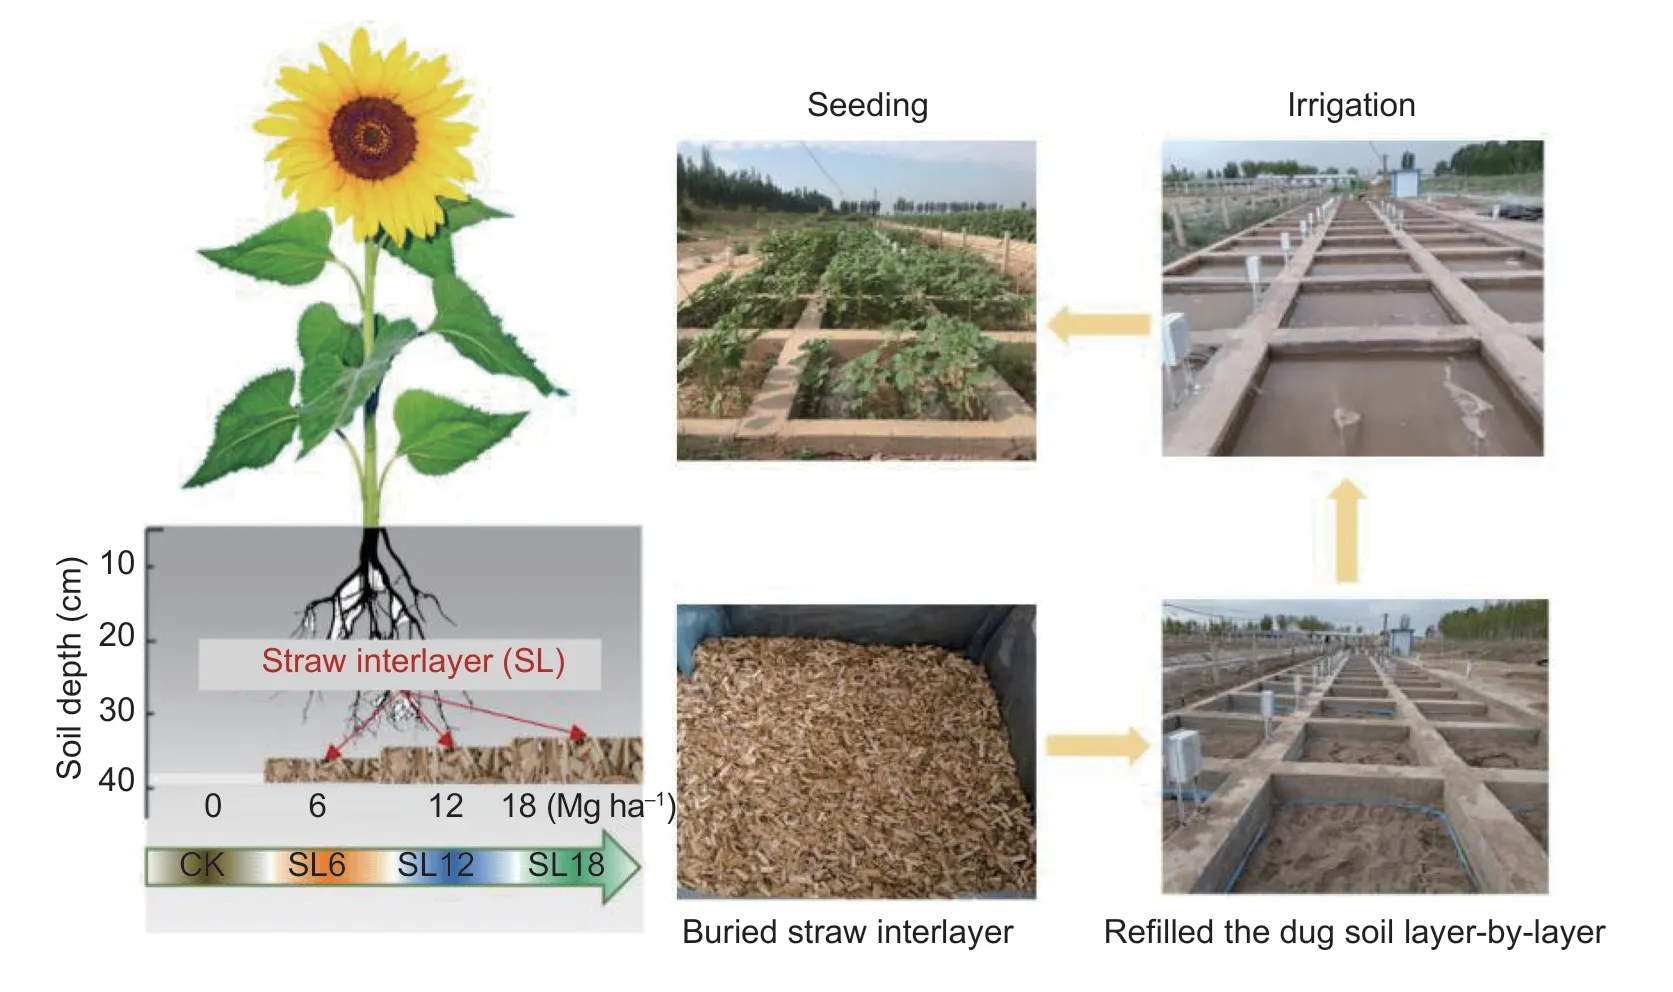
Fig.2 Field planting and management showing straw interlayer burial,irrigation and sowing.
2.3.Soil sampling and measurements
Each year,soil samples were collected in 0–20,20–40,40–60,and 60–80 cm layers between the two rows of sunflower using a soil auger at the sunflower harvest stage.The soils were naturally air-dried,and manually sieved (0.149 mm) for SOC and TN determination.SOC(g kg–1) was measured by K2Cr2O7-FeSO4oxidation,and the TN (g kg–1) was determined using the Kjeldahl method (Bao 2007).SOC and TN storage (Mg ha–1) were determined as below:
where BDi,Hi,and 10 represent the soil bulk density (g cm–3),depth (m) and conversion factor,respectively.
The C:N ratio was determined by dividing the SOC concentration by the TN concentration.The stratification ratios were calculated from the SOC and TN concentrations at 0–20 cm depth divided by those at 20–60 and 60–80 cm depths (Franzluebbers 2002).The soil moisture content was determined by oven-drying subsamples.Soluble salt content (g kg–1) was calculated by multiplying electrical conductivity of soil extracts (ms cm–1)by 3.0111 (Zhanget al.2020).
2.4.Yield sampling and measurements
At harvest,all sunflower heads in each plot were manually removed and threshed,and the grain was air-dried until a constant weight and then weighed to determine the grain yield per plot.
2.5.Statistical analysis
Data processing system (DPS) was used to perform statistical analyses.A three-way analysis of variance(ANOVA) together with the LSD test was carried out to analyze the effects of experimental year (four levels:2015,2016,2017 and 2018),soil depth (four levels: 0–20,20–40,40–60,and 60–80 cm),and straw rate (four levels:0,6,12,and 18 Mg ha–1) on SOC and TN concentrations,and soil C:N ratio (Appendix B).SOC concentration was significantly influenced by the interaction among these three factors.Therefore,a two-way ANOVA was performed to compare the effects of soil depth and straw rate on soil parameters in each year,and another twoway ANOVA was performed to examine the influence of experimental year and straw rate on soil parameters in each soil layer.When significant interactions were observed between experimental year and soil depth and straw rate,one-way ANOVA was conducted between straw rate in the same experimental year and soil depth.The Pearson’s correlation coefficients between SOC/TN and soil salinity/crop yield were calculated using IBM SPSS Statistics 20.0 (SPSS Inc.,ILZZ,USA).Figures were plotted with Origin 2020.
3.Results
3.1.SOC
The relative changes of SOC concentration in treatments where straw was applied compared to the CK treatment were influenced by straw application rate,and experimental year×straw application rate interaction (P<0.05) (Fig.3-A).The relative changes of SOC concentration decreased with experimental year for the SL6 and SL12 treatments,while it increased with experimental year for the SL18 treatment.The greatest SOC changes were found in the 20–40 and 40–60 cm soil depths which had changes of 14–32 and 11–57%,respectively.In the first two years of straw addition,the relative change in SOC in each soil layer was the largest in the SL12 treatment,but in later years the SL18 treatment had the greatest increase in SOC.In 2018,the relative change in SOC in the SL18 treatment was the largest among all treatments.
The SOC concentration gradually decreased with soil depth and increased in the treatments with straw added(P<0.05) (Fig.4-A).In 2015,the SOC concentration in the SL12 treatment was 19–57% (P<0.05) greater than where there was no straw interlayer.In 2016,the SOC concentration in straw treatments was significantly greater,by 24–31 and 32–35% (P<0.05),respectively,at the depths of 20–40 and 40–60 cm,compared with the CK treatment.Near the end of the study (2017–2018),the SOC concentration in the SL18 treatment was greater than in other treatments,the greatest differences being found at the depths of 20–40 and 40–60 cm.
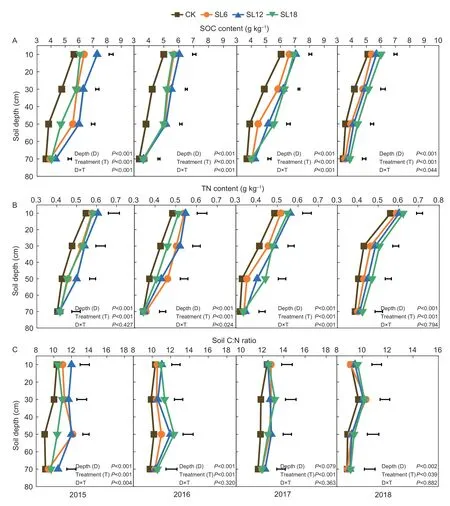
Fig.4 Soil organic carbon (SOC;A) and total nitrogen (TN;B) concentrations,and C:N ratio (C) in the soil profile with four rates of straw applies as an interlayer in 2015–2018.CK,no straw;SL6,6 Mg straw ha–1;SL12,12 Mg straw ha–1;SL18,18 Mg straw ha–1.The error bars in the figure represent the minimum significant differences (LSD) at the P<0.05 level.
Straw addition significantly affected SOC storage(P<0.05) (Fig.5-A).From 2015 to 2018,the SL6,SL12 and SL18 treatments had 8–22,14–34,and 16–23%greater SOC storage,respectively,in the 0–80 cm soil depth than the CK treatment.The SL12 treatment had the greatest SOC storage in the years 2015–2017.
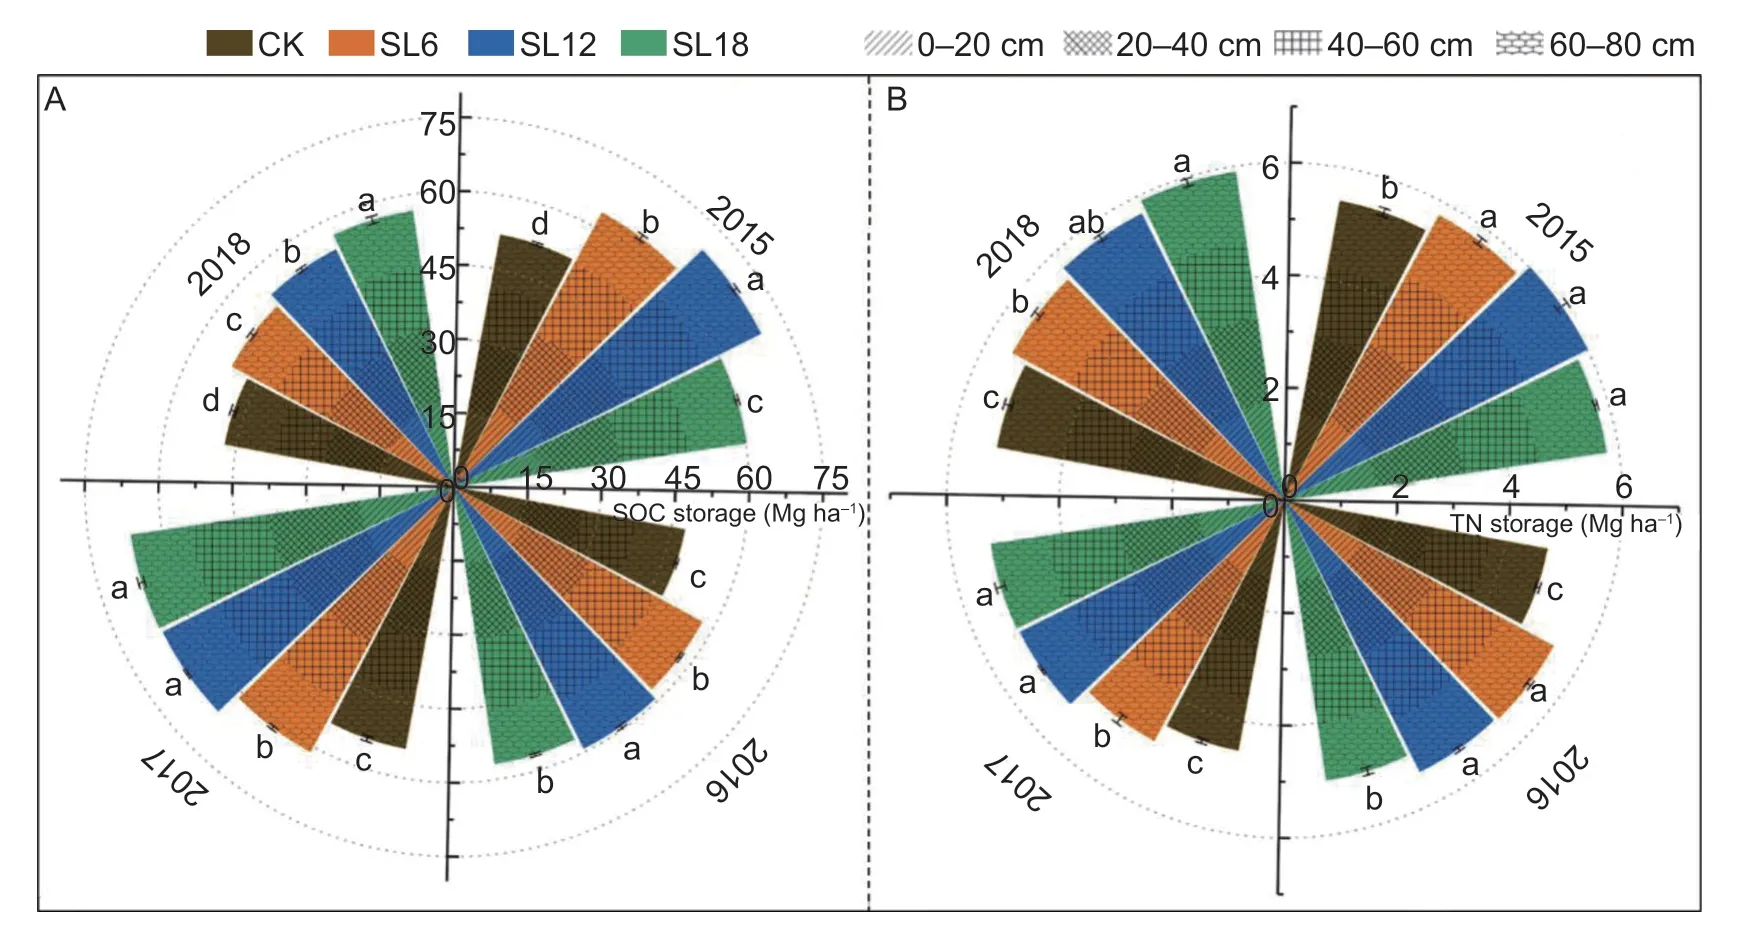
Fig.5 Storages of soil organic carbon (SOC;A) and total nitrogen (TN;B) under four rates of straw application as an interlayer in 2015–2018.CK,no straw;SL6,6 Mg straw ha–1;SL12,12 Mg straw ha–1;SL18,18 Mg straw ha–1.Values are mean±SE (n=3).Within years,different small letters show significant differences (P<0.05) between straw application rates.
3.2.TN
The relative changes in soil TN concentration in the 0–60 cm soil depth were significantly influenced by straw addition (P<0.01),and experimental year×straw addition interaction (P<0.01) (Fig.3-B).Soil TN in treatments where straw was added (6–18 Mg ha–1) was by 8–22 and 6–34% greater in the 20–40 and 40–60 cm soil depths,respectively,than in the CK treatment.The relative changes in TN concentration were the greatest for the SL12 treatment in the first three years of the experiment(2015–2017) but the greatest for the SL18 treatment in 2018.
All straw addition treatments increased soil TN concentration (Fig.4-B).In 2015,soil TN concentration was the greatest in the SL12 treatment,being 13 and 17% greater in 20–40 and 40–60 cm depths,respectively,than the CK treatment (P<0.05).Similarly,in 2016 the TN concentrations in the SL6 and SL12 treatments were 18 and 22% greater in the 20–40 cm layer,and 23 and 15%greater in the 40–60 cm layer than in the control (P<0.05).In 2017,the differences in soil TN concentration between the control and the SL12 and SL18 treatments increased with soil depth,with the increase being 16–22 and 13–34%,respectively.In 2018,TN in the SL18 treatment was greater than in the other treatments.
Straw addition significantly increased soil TN storage(P<0.05) (Fig.5-B).Compared with the CK treatment,straw addition increased TN storage by 6–17% in the years 2015–2018 (P<0.05).
3.3.C:N ratio
The relative changes in soil C:N ratio in straw addition treatments compared to the CK treatment were higher in the early stages of the study (2015–2016),especially in the 20–40 and 40–60 cm soil depths,where soil C:N increased by 9–12 and 19–26%,respectively.Subsequently,the relative changes in soil C:N ratio between treatments fluctuated slightly (Fig.3-C).
The soil C:N ratio increased at the beginning while subsequently decreased with soil depth (Fig.4-C).In 2015,treatments SL6,SL12 and SL18 had greater soil C:N ratios than the control,by 12,17 and 9%,respectively in the 20–40 cm soil layer,and 36,34 and 16% respectively,in the 40–60 cm layer (P<0.05).In 2016,all straw addition treatments had greater soil C:N ratios than the control by 6–15% in the 20–40 cm layer,and the SL12 and SL18 treatments had greater C:N ratios than the control,by 17 and 21%,respectively,in the 40–60 cm layer (P<0.05).In 2017,straw addition (6–18 Mg ha–1)boosted soil C:N ratios by 8–11 and 6–9% in 20–40 cm and 40–60 cm depths respectively,compared with the CK treatment.In 2018,there were no significant differences in soil C:N ratios between treatments.
3.4.Stratification ratios of SOC and TN
The stratification ratios of SOC and TN were influenced by straw addition (P<0.001) and experimental year (P<0.01)(Fig.6).Compared to the CK treatment,straw addition decreased the stratification ratios (0–20 cm:20–60 cm) of SOC and TN by 5–15% (Fig.6-A) and 4–9% (Fig.6-B),respectively (P<0.05).In contrast,the stratification ratios of SOC and TN for the 0–20 cm:60–80 cm layers showed an opposite trend (P<0.05).
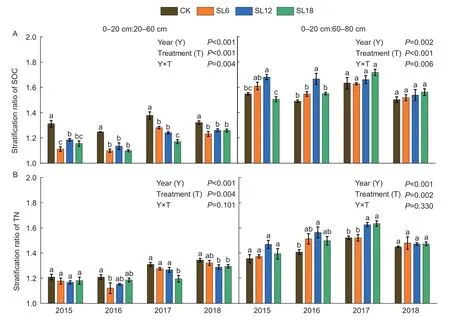
Fig.6 Stratification ratio of soil organic carbon (SOC) (A) and soil total nitrogen (TN) (B) under four straw application rates.CK,no straw;SL6,6 Mg straw ha–1;SL12,12 Mg straw ha–1;SL18,18 Mg straw ha–1.Values are mean±SE (n=3).Within years,different small letters show a significant difference (P<0.05) between rates of straw application.
3.5.Soil moisture and salinity contents
Addition of straw increased soil moisture content and reduced salinity (Table 2).In 2015,straw increased soil moisture contents by 6–9 and 3–4% in the 0–20 and 20–40 cm soil layers,respectively (P<0.05).In straw addition treatments,the soil salinity content in the 0–20 cm soil layer was 43–47% lower (P<0.05) than in the CK.Similarly,in 2016 to 2018,straw addition increased soil moisture content in the 0–40 cm soil layer,and reduced soil salinity content.As time progressed,the differences in soil moisture and salinity contents caused by different amounts of straw application gradually weakened.
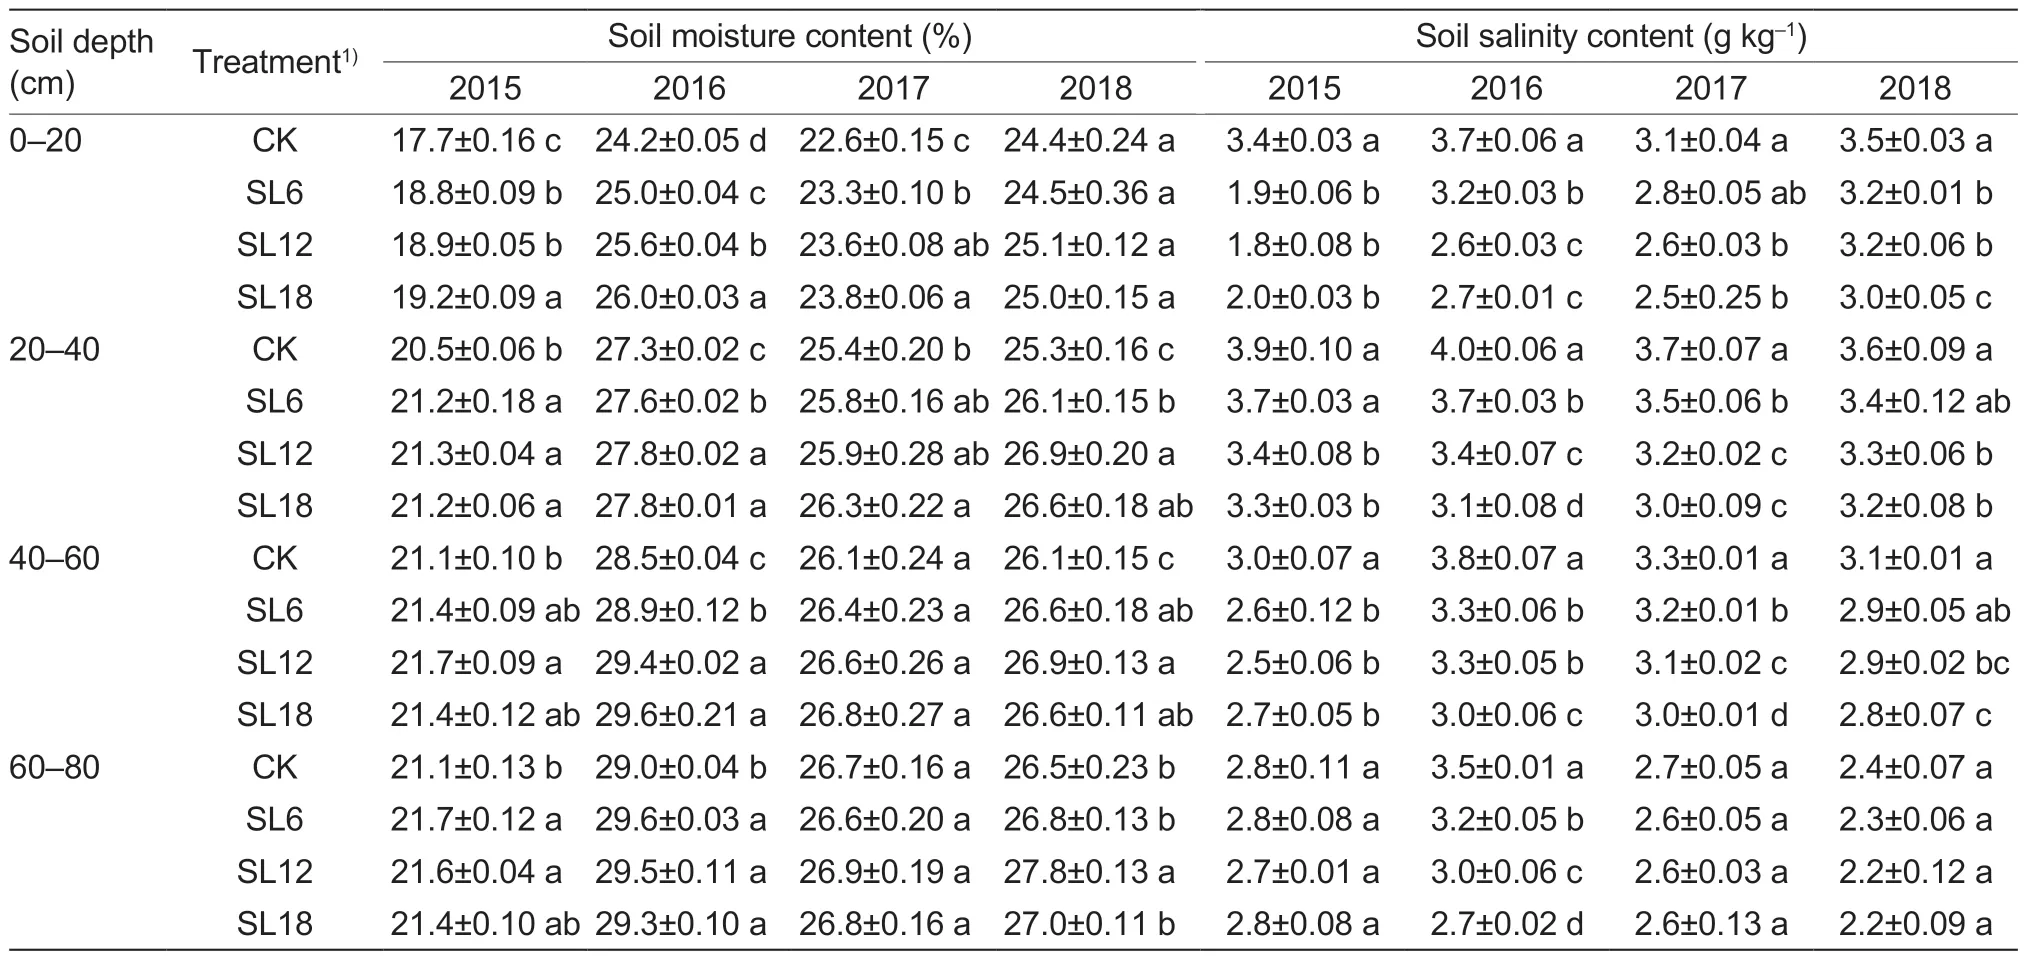
Table 2 Soil moisture percentage and soil salinity concentration before sunflower sowing with four application rates of straw as an interlayer for different soil depths during 2015–2018
3.6.Sunflower yield and relationships among soil parameters and sunflower yield
Crop yield was influenced by straw addition (P<0.001),experimental year (P<0.001) and experimental year×straw addition interaction (P<0.001) (Fig.7).In 2016,compared with the CK,straw addition in the SL6,SL12 and SL18 treatments significantly increased crop yield by 20,28 and 24%,respectively (P<0.05).The crop yield in the SL12 and SL18 treatments was 8 and 6% greater in 2017,and 21 and 22% greater in 2018 than in the CK (P<0.05),respectively.
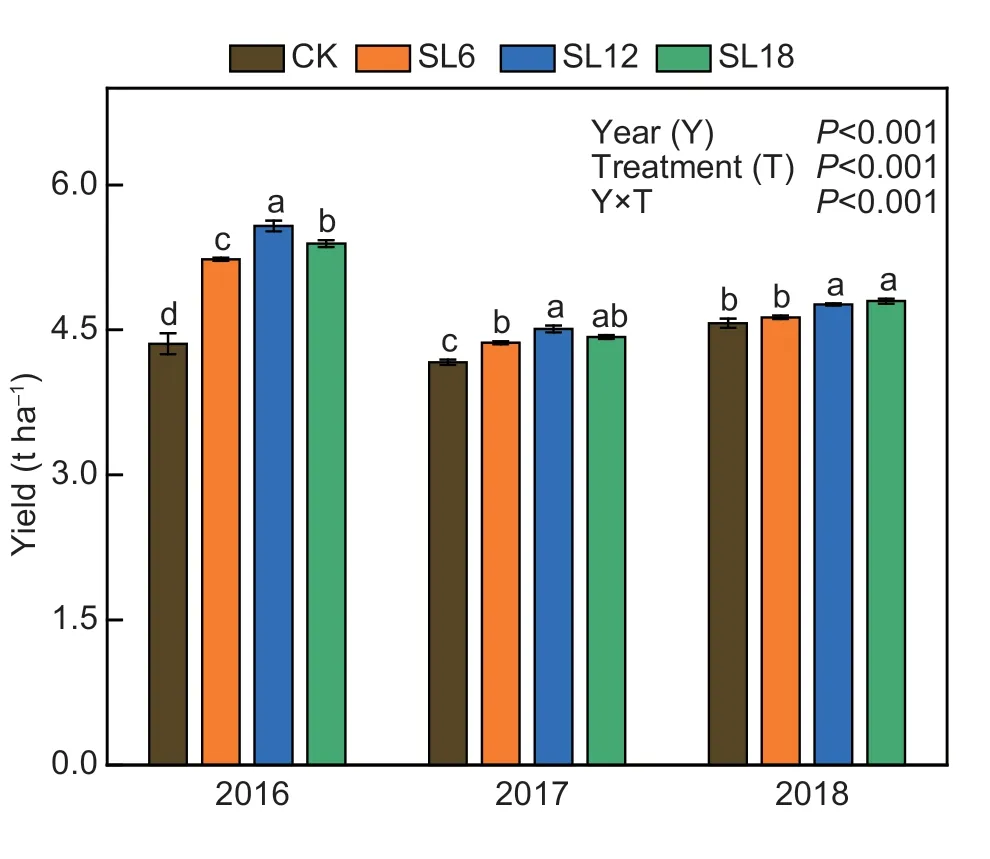
Fig.7 Crop yield under four straw application rates 2016 to 2018.CK,no straw;SL6,6 Mg straw ha–1;SL12,12 Mg straw ha–1;SL18,18 Mg straw ha–1.Values are mean±SE (n=3).Within years,different small letters show a significant difference(P<0.05) between straw application rates.
The SOC,TN and C:N ratios were positively correlated with soil moisture,but negatively correlated with soil salinity (P<0.01).Sunflower yield significantly (P<0.01)increased with increasing SOC and TN contents (Fig.8).
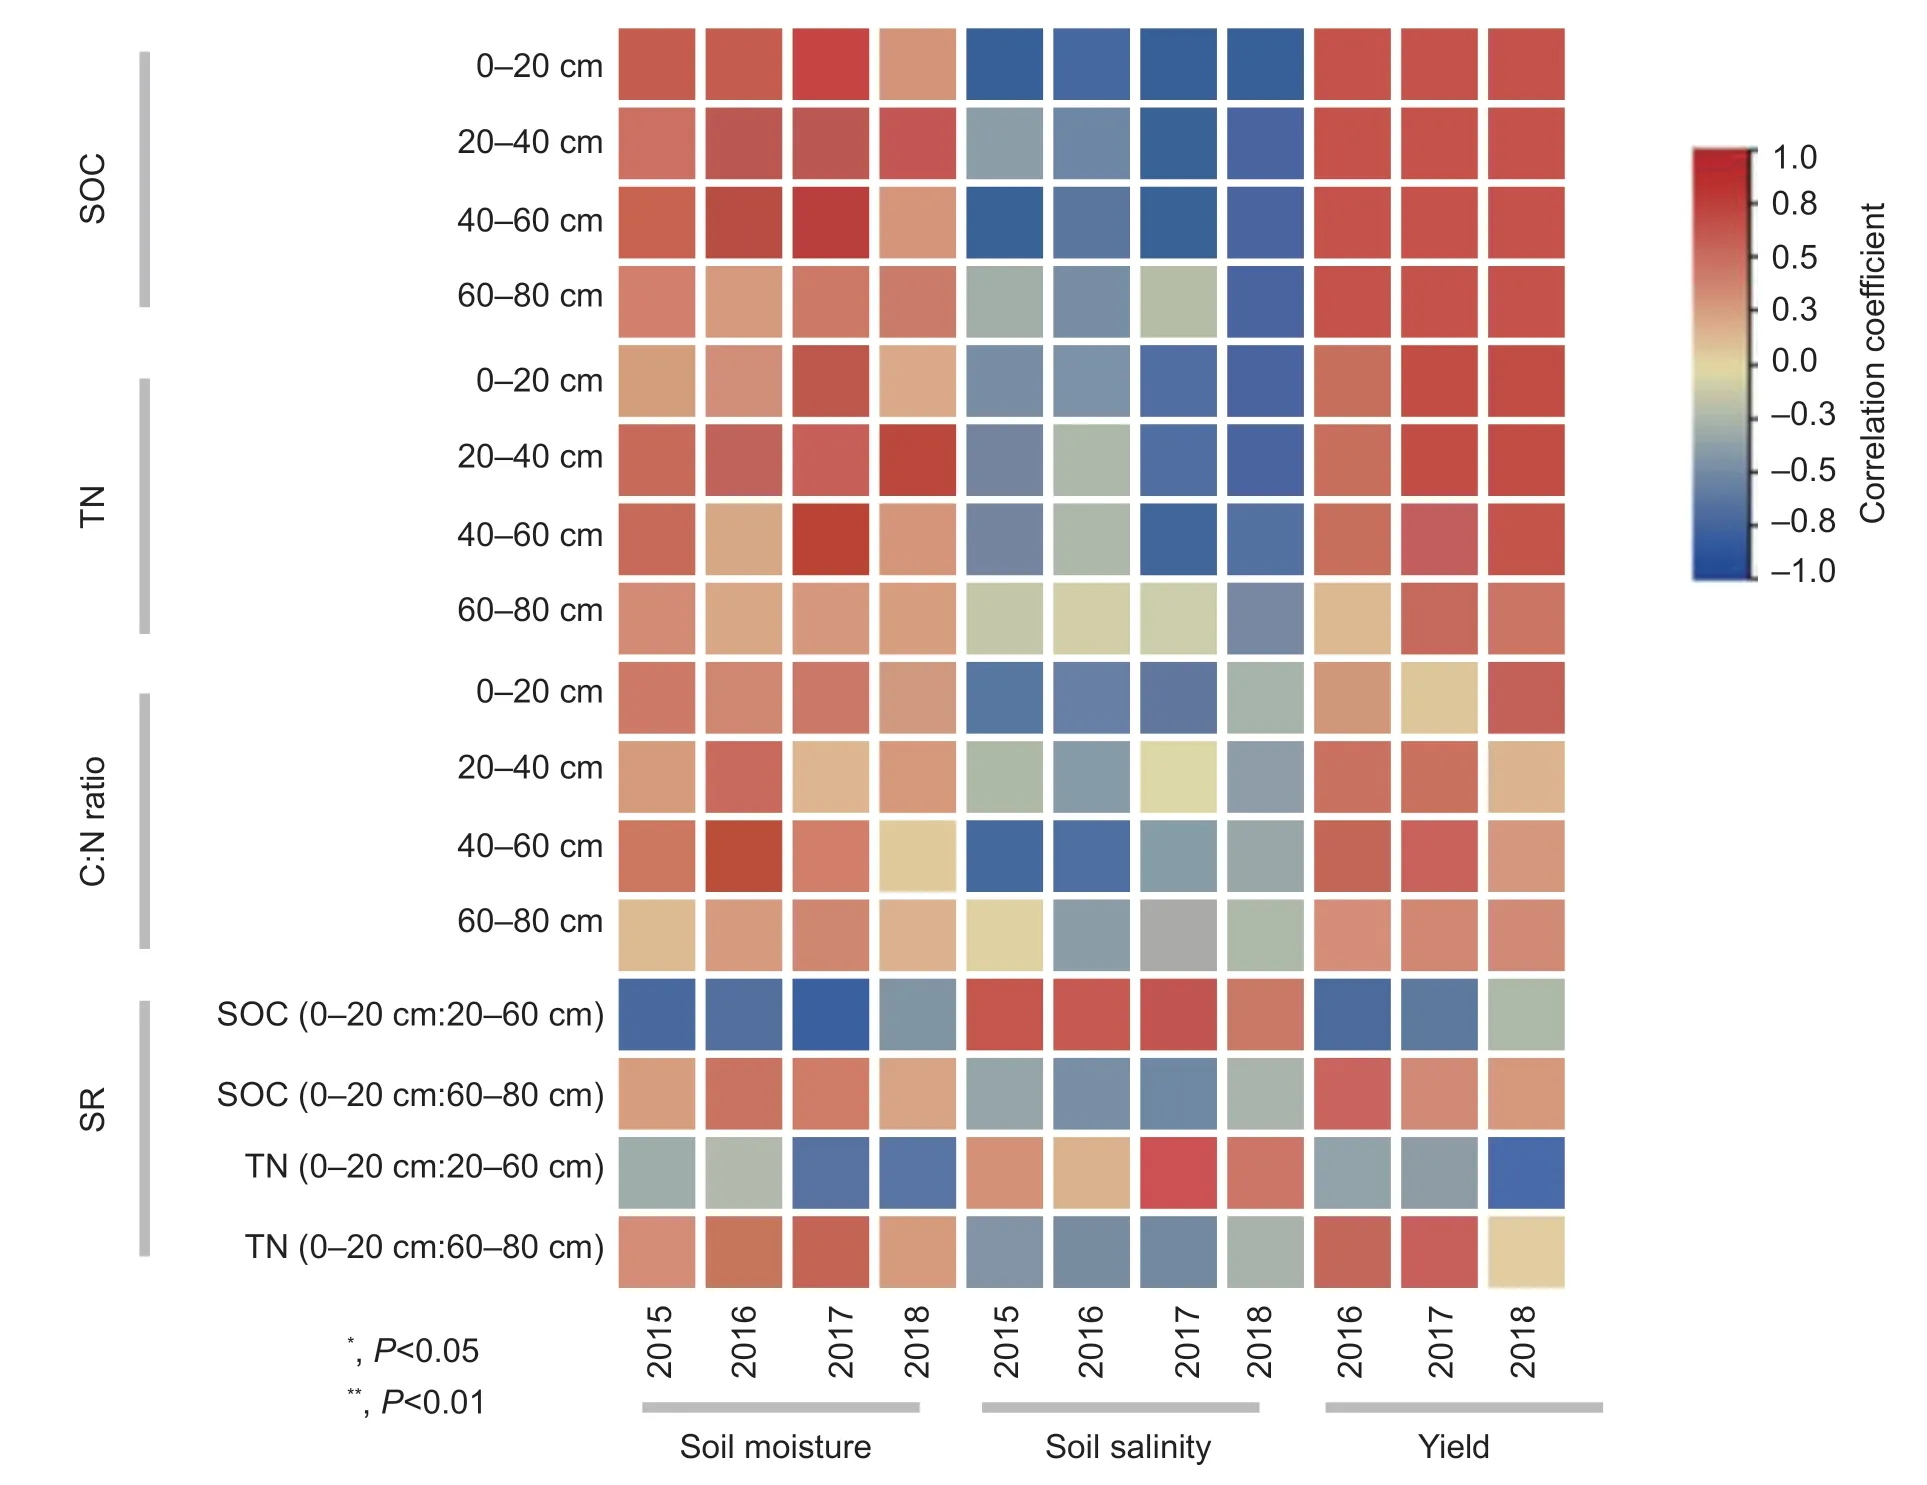
Fig.8 Correlations of soil organic carbon (SOC),total nitrogen (TN),C:N ratio,and stratification ratio (SR),with soil moisture,soil salinity and crop yield from 2015 to 2018.
4.Discussion
4.1.Effect of straw addition as an interlayer on SOC in saline soil
Straw addition (6,12,and 18 Mg ha–1) increased SOC concentration by 16–24% compared to the CK in the 0–80 cm soil layer in the present study (Fig.3-A),mainly due to the exogenous organic material inputs with straw applications (Conget al.2019).Several studies have demonstrated that straw return to the soil surface at rates greater than 9 Mg ha–1do not increase SOC content(Zhanget al.2011;Caiet al.2012).In the present study,deep straw return as interlayers at rates of 12–18 Mg ha–1increased SOC concentration in the third and fourth year after the treatments were applied.These contrasting results may be because of the differences in straw placement.Under irrigated farmland in semi-arid saline regions of China,straw applied as an interlayer in the subsoil usually has slower decomposition and transformation rates than straw applied to topsoils (Huoet al.2017;Latifmaneshet al.2020) due to the lower temperature and dissolved oxygen content of subsoils(Latifmaneshet al.2020).However,we found that the SOC concentration in the subsoil increased over the four years after straw burial (Fig.4-A).This was likely mainly due to the lower microbial activity (Liuet al.2018),and higher abundance of available mineral surfaces and Ca2+in the subsoil than in the topsoil (Buttonet al.2022),which would have been beneficial to fixation of straw-derived microbial biomass carbon and dissolved organic carbon(Huoet al.2017),and thus forming stable organo-mineral complexes (Buttonet al.2022).Our results confirmed that straw applied as interlayers in the subsoil had greater potential for SOC sequestration than straw returned to the surface soil.
In the first three years after deep soil straw application,the SOC concentration in the present study was the greatest in the treatment where straw was applied at 12 Mg ha–1(Fig.4-A).Generally,SOC concentration increases with straw C input that allows good contact between straw and soil (Jinet al.2020),but it may be maintained or decreased when straw C input exceeds the soil accommodation capacity (Berhaneet al.2020).In the early period after the burial of a large amount of straw in the present study (18 Mg ha–1),the amount of straw was excessive and condensed in the restricted soil space,resulting in the straw being in a reducing environment(Wanget al.2015).The large amount of straw applied as an interlayer likely had poor contact with the soil,which led to low decomposition rate and low SOC accumulation(Andruschkewitschet al.2013).The C:N ratio in C-rich maize straw is generally higher than in the soil (Caiet al.2015).After the addition of 18 Mg straw ha–1,microbial activity would have been restricted by low N availability in the early stage of straw decomposition (Laird and Chang 2013),prompting microbial competition with the crop for mineral N from the soil,affecting the composition and diversity of soil microorganisms,and thereby reducing straw decomposition rate (Yanget al.2015).SOC concentration was greater at the straw rate of 18 Mg ha–1than 12 Mg ha–1in the fourth year after straw deep return.This may be because the limitation of soil space weakened over time (Zhanget al.2020) and the greater straw application rate would have contributed to the accumulations of SOC in the final year after straw burial.
Deep straw return to the soil as an interlayer increased SOC concentration and storage in soil layers above and below the straw (Figs.3-A,4-A and 5-A).This is probably because the straw interlayer improved soil water-holding capacity and reduced soil salt level (Zhaoet al.2016),which promoted root growth and increased root C (Zhanget al.2019) and inputs of exudates (Haicharet al.2014).The improved soil porosity where straw was applied as an interlayer would have promoted soluble organic C leaching to the soil layer below the straw interlayer (Huoet al.2017).Additionally,the higher SOC concentration in the 20–60 cm soil layer under the straw interlayers resulted in a lower stratification ratio (0–20 cm:20–60 cm)compared with where there was no straw interlayer(Fig.6-A).These results indicate that straw application as an interlayer helped in solving the problem of nutrient accumulation caused by conventional straw application methods (e.g.,straw mulching or topsoil mixing) (Zouet al.2016).This results also indicate that a straw interlayer buried at 40 cm depth may significantly increase SOC concentration and storage in the 20–60 cm soil layer,and furthermore improve the homogenous distribution of SOC within the soil.
4.2.Effects of straw addition as an interlayer on TN and C:N ratio in saline soil
Our study found that straw applied as an interlayer increased soil TN concentration and storage,especially in the soil near the straw interlayers (Figs.3-B,4-B and 5-B),resulting in a decrease in the stratification ratio of TN(Fig.6-B).Straw placement as an interlayer is associated with an improvement in soil aggregate structure,and decrease in soil bulk density (Zhanget al.2015).C-rich straw stimulates microorganism growth in the process of decomposition and promotes the fixation of soil N(Gaoet al.2020).Additionally,straw return can promote transformation of mineral N to organic N and reduce N lossvialeaching (Yanget al.2015).Thus,straw added as an interlayer has positive effects on TN concentration and storage in soil layers near the interlayer,further reducing the stratification ratio of TN concentration.
In our study,the straw interlayers increased the soil C:N ratio in the 20–60 cm layer (Fig.4-C).This may be explained by the nutrient composition of maize straw which has a C:N ratio of about 65:1 (Caiet al.2015).After being buried in soil,the contribution of the straw interlayer to SOC is higher than that of TN (Liuet al.2021).In addition,saline soils generally have a low C:N ratio,which may mean that mineralization and decomposition of SOC are reduced and SOC concentration is increased when large amounts of organic materials are added into soil (Tianet al.2020).These factors can all contribute to increasing the soil C:N ratio.
Interestingly,we found that the improvement in soil C:N ratio declined with increase in straw burial time (Fig.3-C).As the time of straw burial increased,the difference in C:N ratio caused by different amounts of straw addition gradually weakened.In addition,as the burying period increased,the SOC level gradually stabilizes (Liuet al.2014).However,straw return with N fertilizer application enhances N stabilization (Wanget al.2021),which leads to a decrease in the C:N ratio.
4.3.Relationships between SOC and TN and moisture and salinity in saline soil
Previous studies have shown that straw applied as an interlayer can effectively increase water content,reduce salinity,and significantly increase crop yield (Zhaoet al.2016;Zhanget al.2020).We found that SOC and TN were positively correlated with soil moisture and negatively with salt content during the 2015–2017 period(P<0.01;Fig.8).The salt ions,especially exchangeable Na+ions in saline soil,exacerbate the dispersion of soil particles,thereby enhancing the solubility and accessibility of organic matter and the consequent loss of soil C (Heet al.2022).In the present study,the experimental plots were irrigated before planting the sunflower crop,and the straw interlayers could have extended the residential time of water in the upper part of the straw interlayer and increased the water content of the soil (Zhanget al.2020).Salt leaching is promoted to reduce the soil salt level in the root zone (Zhaoet al.2016;Zhanget al.2020).Additionally,the high-moisture and low-salt environment of the straw interlayer may be more conducive than the soil to the survival of soil microorganisms,thereby enhancing the breakdown of the straw interlayer and increasing the SOC and TN concentrations (Liet al.2017).
The SOC and TN concentrations had significant negative correlations with soil salinity only in 2018(P<0.01;Fig.8).With increased length of straw interlayer burial period,the interlayer becomes thinner,and the regulation of water and salt weakened (Zhanget al.2020).However,in our study the salt content in the 0–40 cm layer remained at a moderate level within the fourth year of straw burial.The correlation analysis confirmed that sunflower yield had a significant positive correlation with SOC and TN.Overall,from our study in saline soil,straw applied as an interlayer in a single dose of 12 Mg ha–1is recommended for improving SOC and TN during the first three years,and for lowering soil salinity,benefiting soil water content and crop yield.
5.Conclusion
Legacy effects of straw applied as an interlayer at 40 cm soil depth were investigated in a four-year field experiment.Compared with no straw interlayer (CK),the burial of straw interlayers increased SOC and TN concentrations,especially in soil layers above (20–40 cm)and below (40–60 cm) the straw interlayer.Straw addition resulted in lower stratification ratios (0–20:20–60 cm)of SOC and TN concentrations,indicating uniform distributions of SOC and TN.Soil where straw was added at a rate of 12 Mg ha–1had the highest SOC and TN concentrations,and C:N ratio in the first three years of the study,but in the fourth year these parameters were the highest when 18 Mg ha–1of straw was added.In other words,greater application rates of straw as an interlayer may be most beneficial for SOC and TN concentrations in the longer term.In conclusion,deep straw soil return as an interlayer with a high input rate was an effective strategy to promote saline soil amelioration and utilization for at least four years.
Acknowledgements
This research was funded by the National Natural Science Foundation of China (31871584),the Agricultural Science and Technology Innovation Program,Chinese Academy of Agricultural Sciences (CAAS-ZDRW202201),the Fundamental Research Funds for Central Non-profit Scientific Institution,China (1610132020011),the “Open the list” in charge of the Science and Technology Project of Ordos,Center for Agro-pastoral Ecology and Resource Conservation of Ordos City,Inner Mongolia,China (JBGS-2021-001),and the Inner Mongolia Autonomous Region Research Project (2021EEDSCXSFQZD011).
Declaration of competing interest
The authors declare that they have no conflict of interest.
Appendicesassociated with this paper are available on https://doi.org/10.1016/j.jia.2023.02.025
 Journal of Integrative Agriculture2023年6期
- Journal of Integrative Agriculture的其它文章
- ldentification of two novel linear epitopes on the p30 protein of African swine fever virus
- Uncertainty aversion and farmers’ innovative seed adoption:Evidence from a field experiment in rural China
- Ensemble learning prediction of soybean yields in China based on meteorological data
- Increasing nitrogen absorption and assimilation ability under mixed NO3– and NH4+ supply is a driver to promote growth of maize seedlings
- Significant reduction of ammonia emissions while increasing crop yields using the 4R nutrient stewardship in an intensive cropping system
- lnsights into the effects of pulsed antimicrobials on the chicken resistome and microbiota from fecal metagenomes