
White Paper on Development Index of 2021 China Lithium Battery Industry
2022-10-15 05:35:04
China Nonferrous Metals Monthly 2022年9期
White Paper on Development Index of 2021 China Lithium Battery Industry
CCID Research Institute of MIIT released White Paper on Development Index of 2021 China Lithium Battery Industry, which indicates that Development Index of China Lithium Battery Industry in Q4 of 2021 reached 307.6, three times the number in 2017. China is the biggest lithium battery consumption market for 5 consecutive years all around the world. In 2021, the scale of global lithium battery market was 545GWh, where China accounted for half of it. As of the end of 2021, the capacity of Chinese power battery accounted for 70% globally, and China occupied 6 places among global top 10 lithium battery manufacturers. These figures fully demonstrate that China is a country boasting huge strengths in power battery industry.
Unit: metric ton
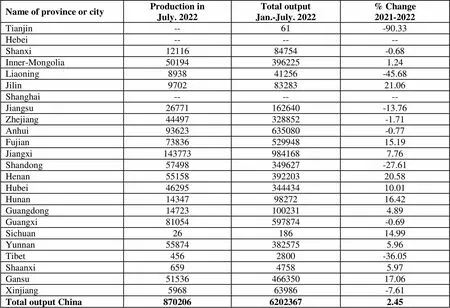
Name of province or cityProduction inJuly. 2022Total outputJan.-July. 2022% Change2021-2022 Tianjin--61-90.33 Hebei------ Shanxi1211684754-0.68 Inner-Mongolia501943962251.24 Liaoning893841256-45.68 Jilin97028328321.06 Shanghai------ Jiangsu26771162640-13.76 Zhejiang44497328852-1.71 Anhui93623635080-0.77 Fujian7383652994815.19 Jiangxi1437739841687.76 Shandong57498349627-27.61 Henan5515839220320.58 Hubei4629534443410.01 Hunan143479827216.42 Guangdong147231002314.89 Guangxi81054597874-0.69 Sichuan2618614.99 Yunnan558743825755.96 Tibet4562800-36.05 Shaanxi65947585.97 Gansu5153646635017.06 Xinjiang596863986-7.61 Total output China87020662023672.45
Unit: metric ton
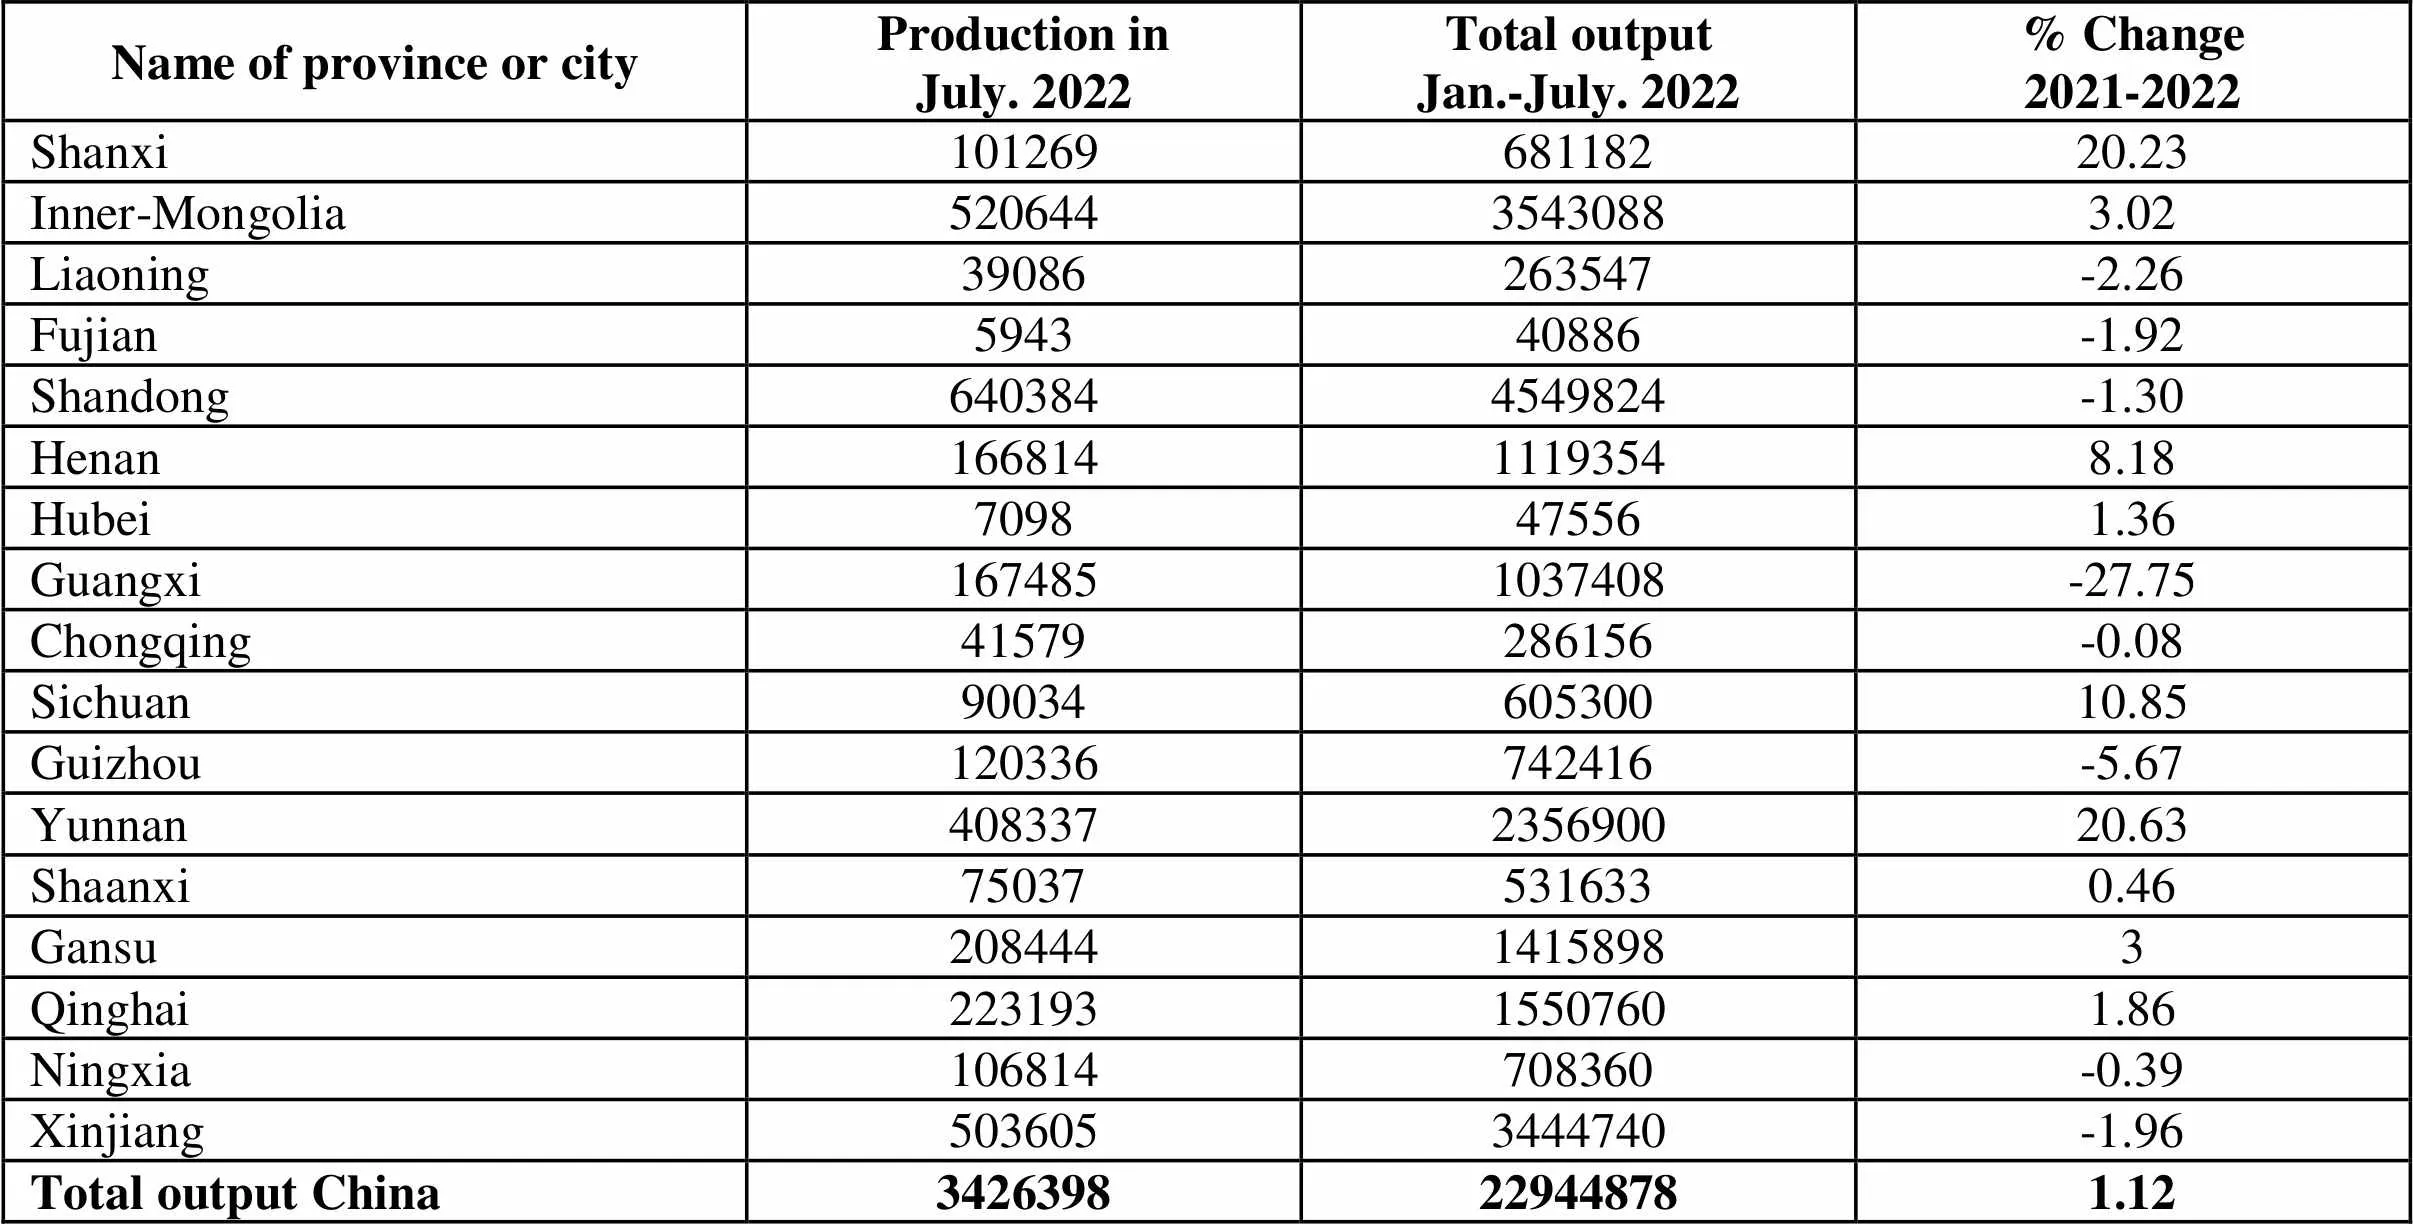
Name of province or cityProduction inJuly. 2022Total outputJan.-July. 2022% Change2021-2022 Shanxi10126968118220.23 Inner-Mongolia52064435430883.02 Liaoning39086263547-2.26 Fujian594340886-1.92 Shandong6403844549824-1.30 Henan16681411193548.18 Hubei7098475561.36 Guangxi1674851037408-27.75 Chongqing41579286156-0.08 Sichuan9003460530010.85 Guizhou120336742416-5.67 Yunnan408337235690020.63 Shaanxi750375316330.46 Gansu20844414158983 Qinghai22319315507601.86 Ningxia106814708360-0.39 Xinjiang5036053444740-1.96 Total output China3426398229448781.12
Unit: metric ton
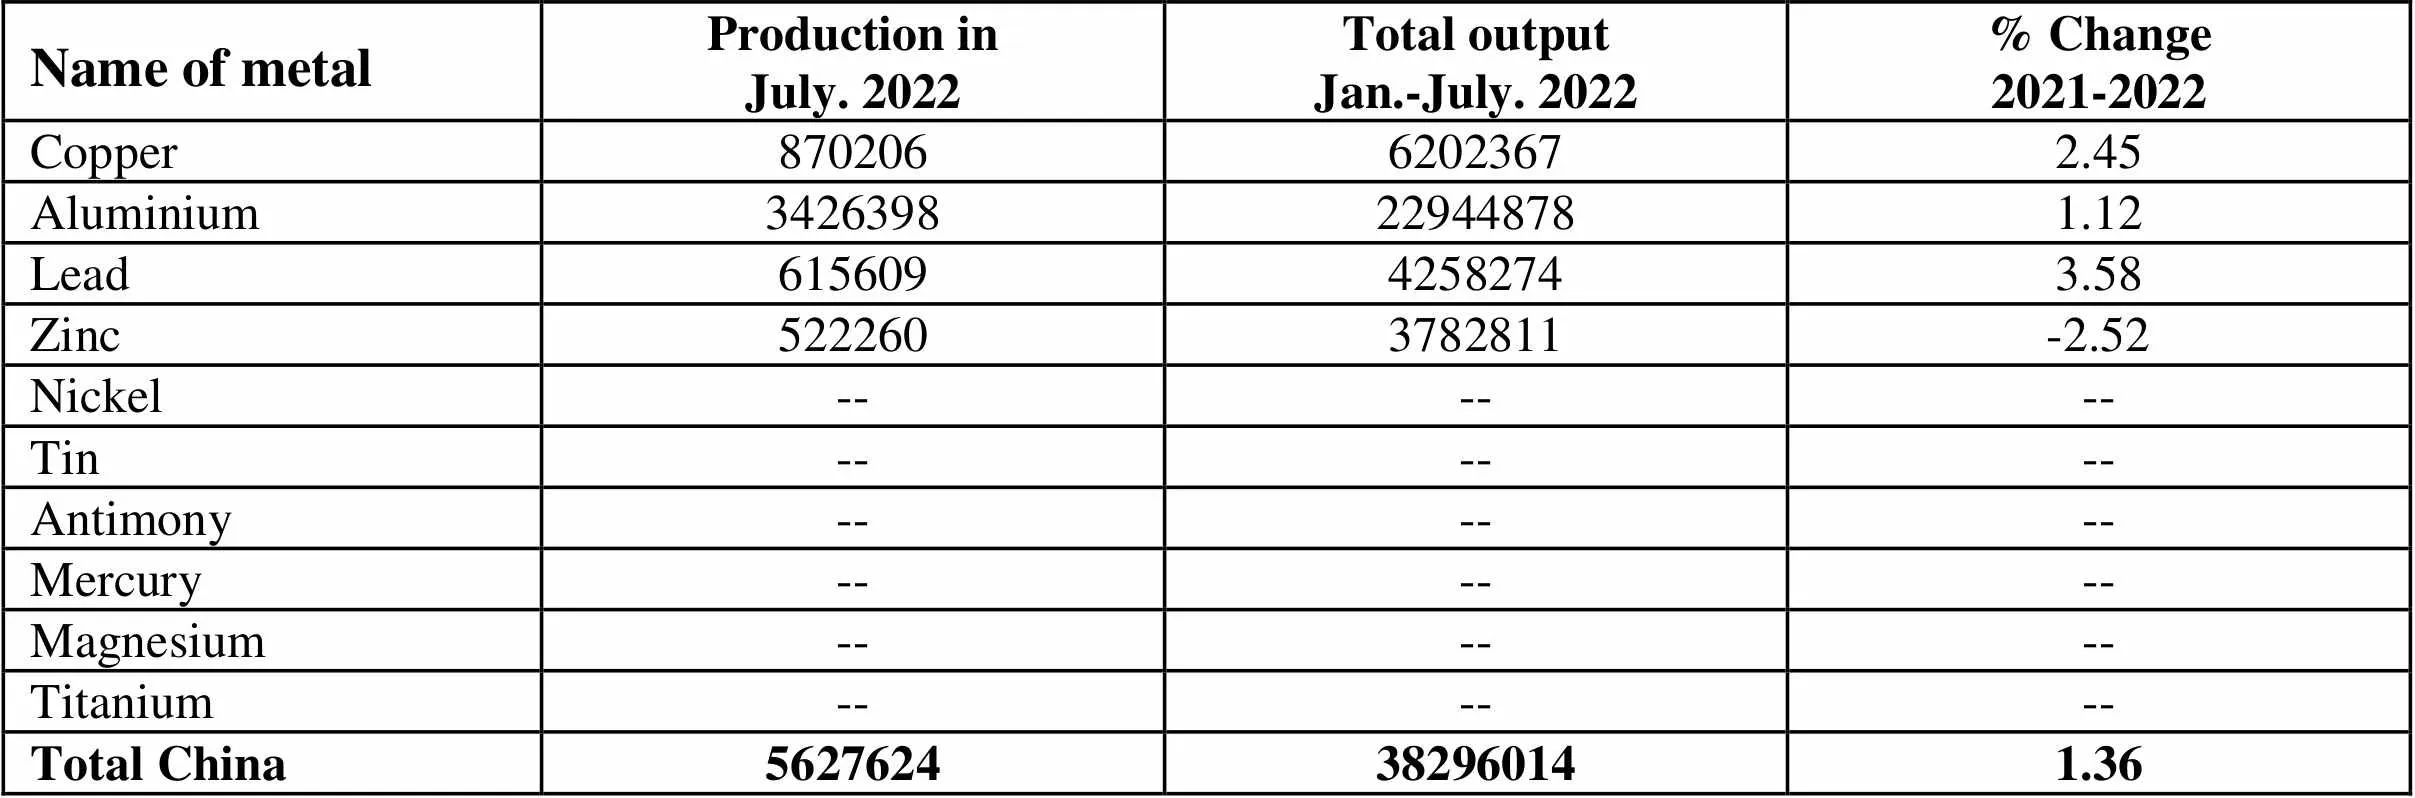
Name of metalProduction inJuly. 2022Total outputJan.-July. 2022% Change2021-2022 Copper87020662023672.45 Aluminium3426398229448781.12 Lead61560942582743.58 Zinc5222603782811-2.52 Nickel------ Tin------ Antimony------ Mercury------ Magnesium------ Titanium------ Total China5627624382960141.36
Unit: metric ton
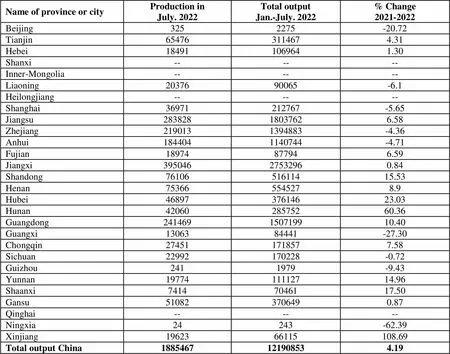
Name of province or cityProduction inJuly. 2022Total outputJan.-July. 2022% Change2021-2022 Beijing3252275-20.72 Tianjin654763114674.31 Hebei184911069641.30 Shanxi-- ---- Inner-Mongolia------ Liaoning2037690065-6.1 Heilongjiang------ Shanghai36971212767-5.65 Jiangsu28382818037626.58 Zhejiang2190131394883-4.36 Anhui1844041140744-4.71 Fujian18974877946.59 Jiangxi39504627532960.84 Shandong7610651611415.53 Henan753665545278.9 Hubei4689737614623.03 Hunan4206028575260.36 Guangdong241469150719910.40 Guangxi1306384441-27.30 Chongqin274511718577.58 Sichuan22992170228-0.72 Guizhou2411979-9.43 Yunnan1977411112714.96 Shaanxi74147046117.50 Gansu510823706490.87 Qinghai------ Ningxia24243-62.39 Xinjiang1962366115108.69 Total output China1885467121908534.19
Unit: metric ton
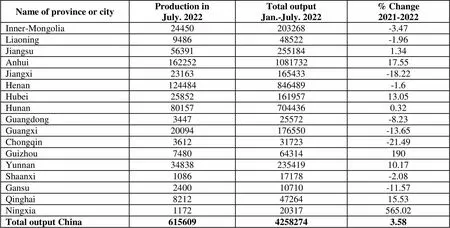
Name of province or cityProduction inJuly. 2022Total outputJan.-July. 2022% Change2021-2022 Inner-Mongolia 24450203268-3.47 Liaoning948648522-1.96 Jiangsu563912551841.34 Anhui162252108173217.55 Jiangxi23163165433-18.22 Henan124484846489-1.6 Hubei2585216195713.05 Hunan801577044360.32 Guangdong344725572-8.23 Guangxi20094176550-13.65 Chongqin361231723-21.49 Guizhou748064314190 Yunnan3483823541910.17 Shaanxi108617178-2.08 Gansu240010710-11.57 Qinghai82124726415.53 Ningxia117220317565.02 Total output China61560942582743.58
January – June 2022
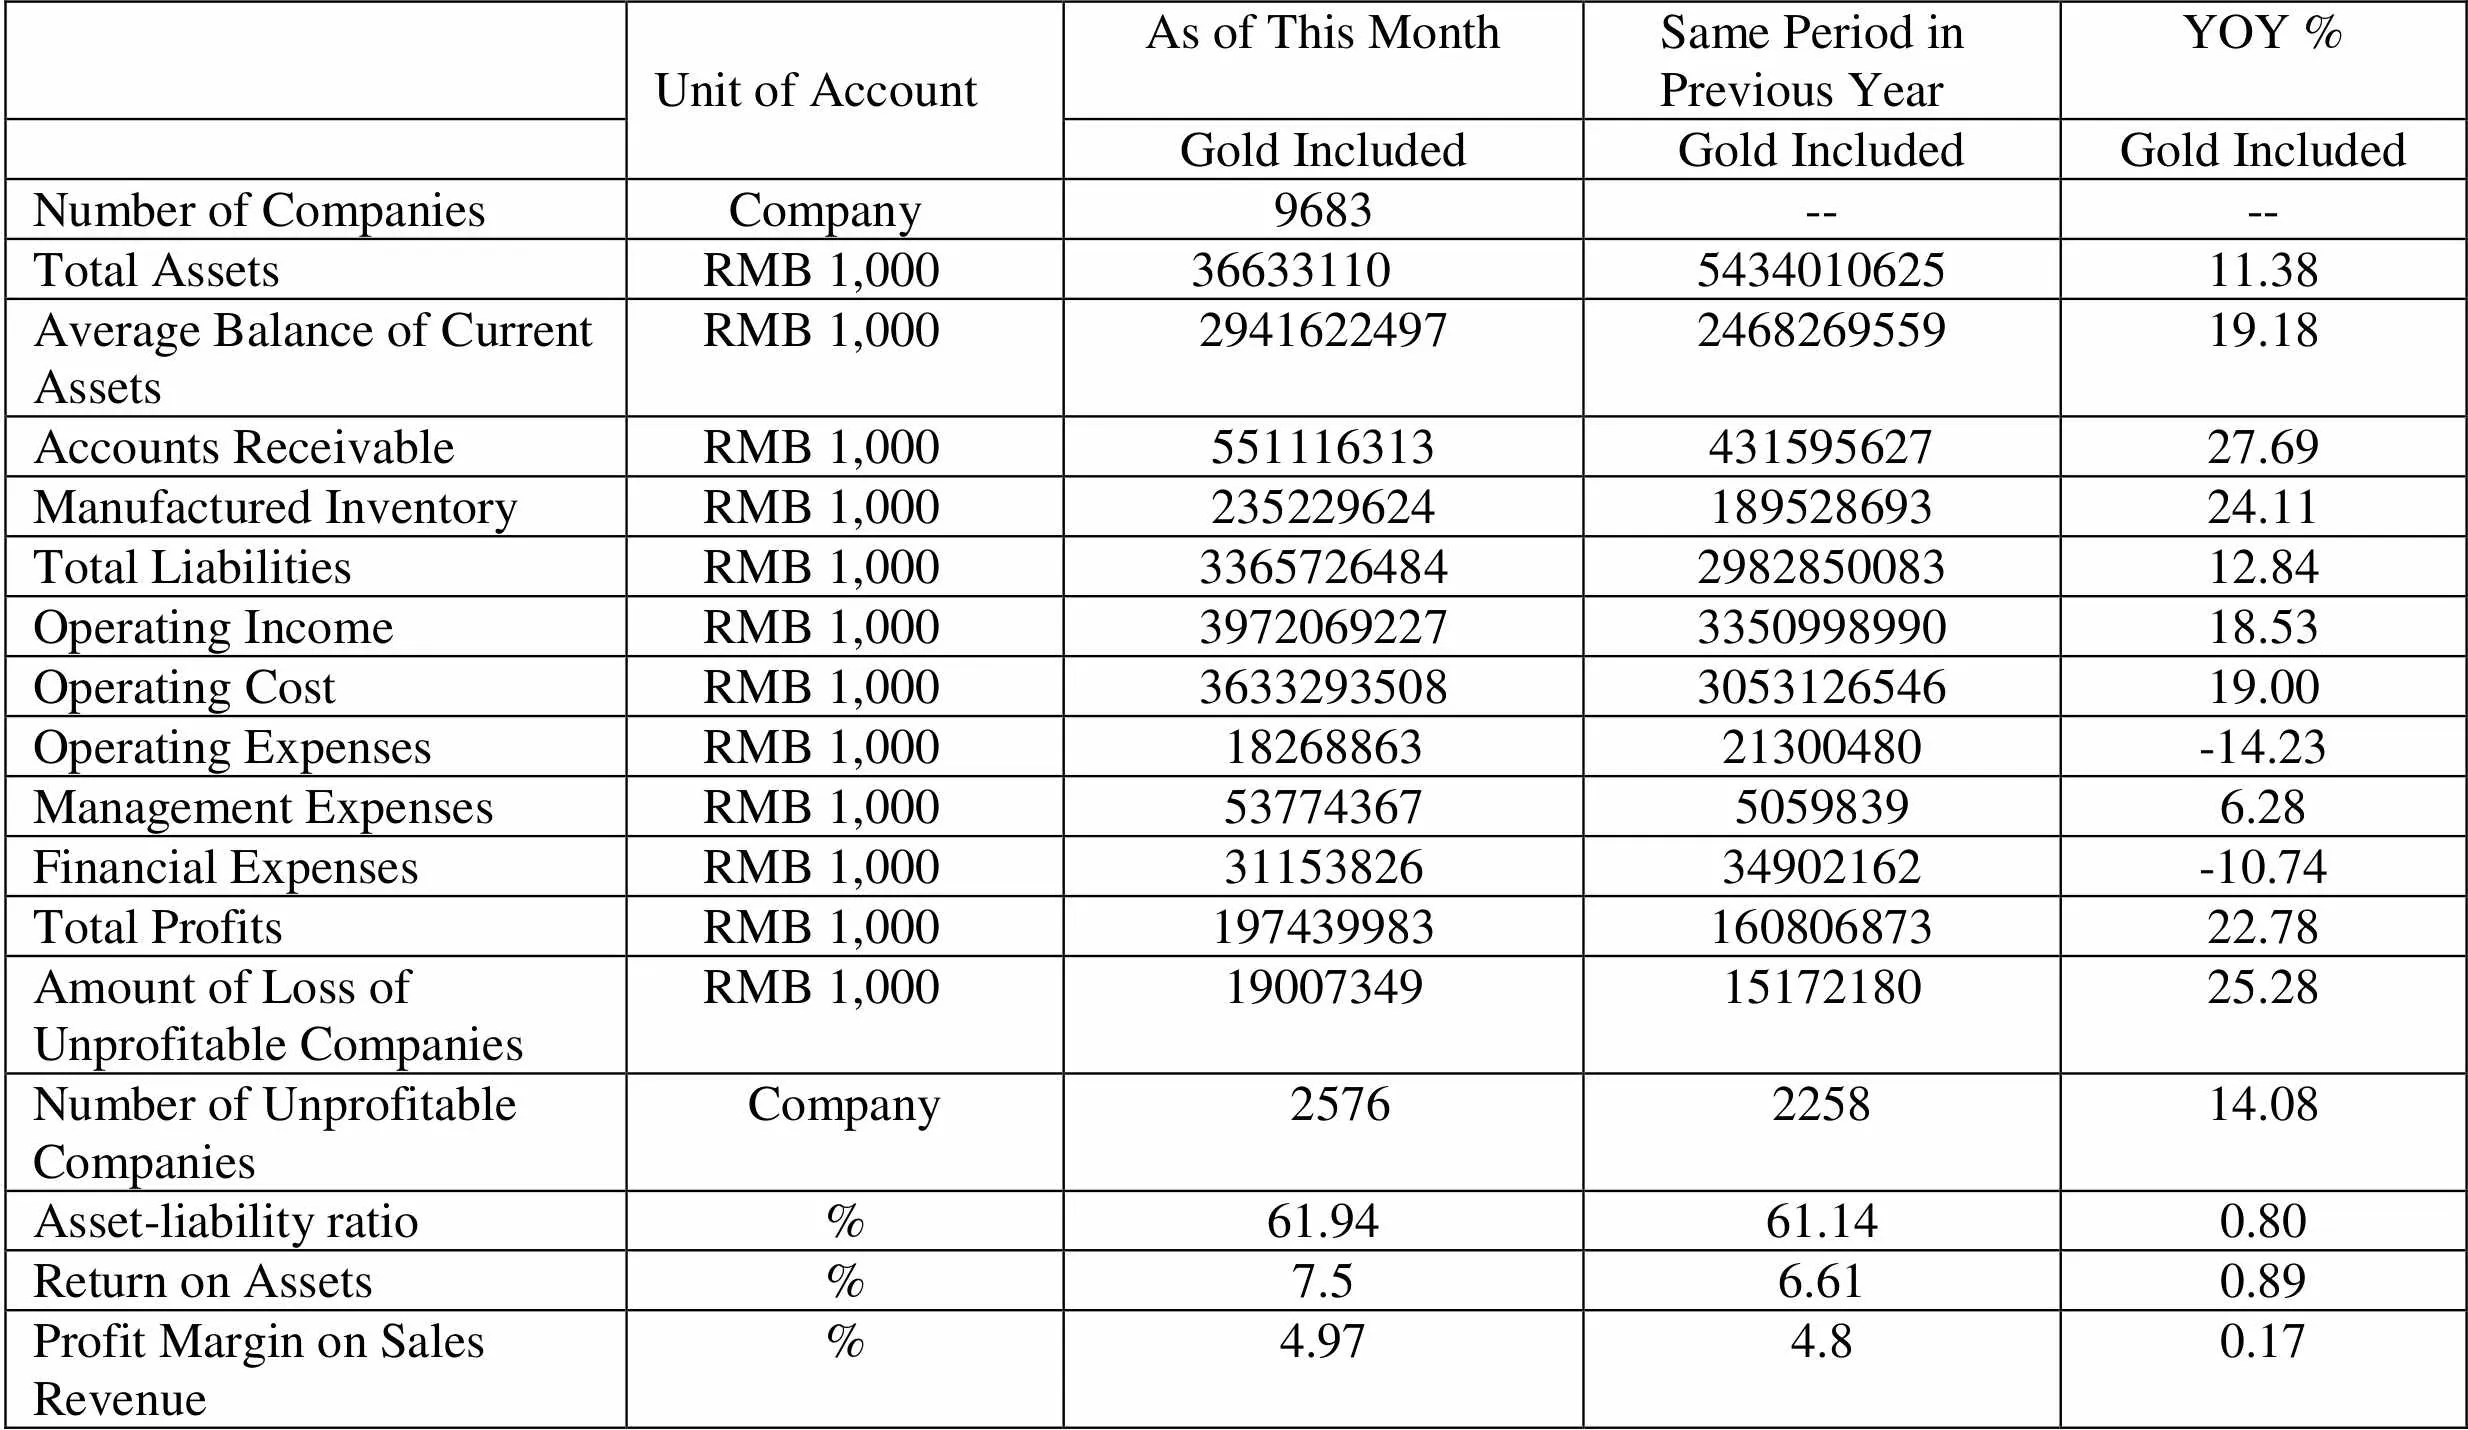
Unit of AccountAs of This MonthSame Period in Previous YearYOY % Gold IncludedGold IncludedGold Included Number of Companies Company9683---- Total AssetsRMB 1,00036633110543401062511.38 Average Balance of Current AssetsRMB 1,0002941622497246826955919.18 Accounts ReceivableRMB 1,00055111631343159562727.69 Manufactured InventoryRMB 1,00023522962418952869324.11 Total LiabilitiesRMB 1,0003365726484298285008312.84 Operating IncomeRMB 1,0003972069227335099899018.53 Operating CostRMB 1,0003633293508305312654619.00 Operating ExpensesRMB 1,0001826886321300480-14.23 Management ExpensesRMB 1,0005377436750598396.28 Financial ExpensesRMB 1,0003115382634902162-10.74 Total ProfitsRMB 1,00019743998316080687322.78 Amount of Loss of Unprofitable CompaniesRMB 1,000190073491517218025.28 Number of Unprofitable CompaniesCompany2576225814.08 Asset-liability ratio%61.9461.140.80 Return on Assets%7.56.610.89 Profit Margin on Sales Revenue%4.974.80.17
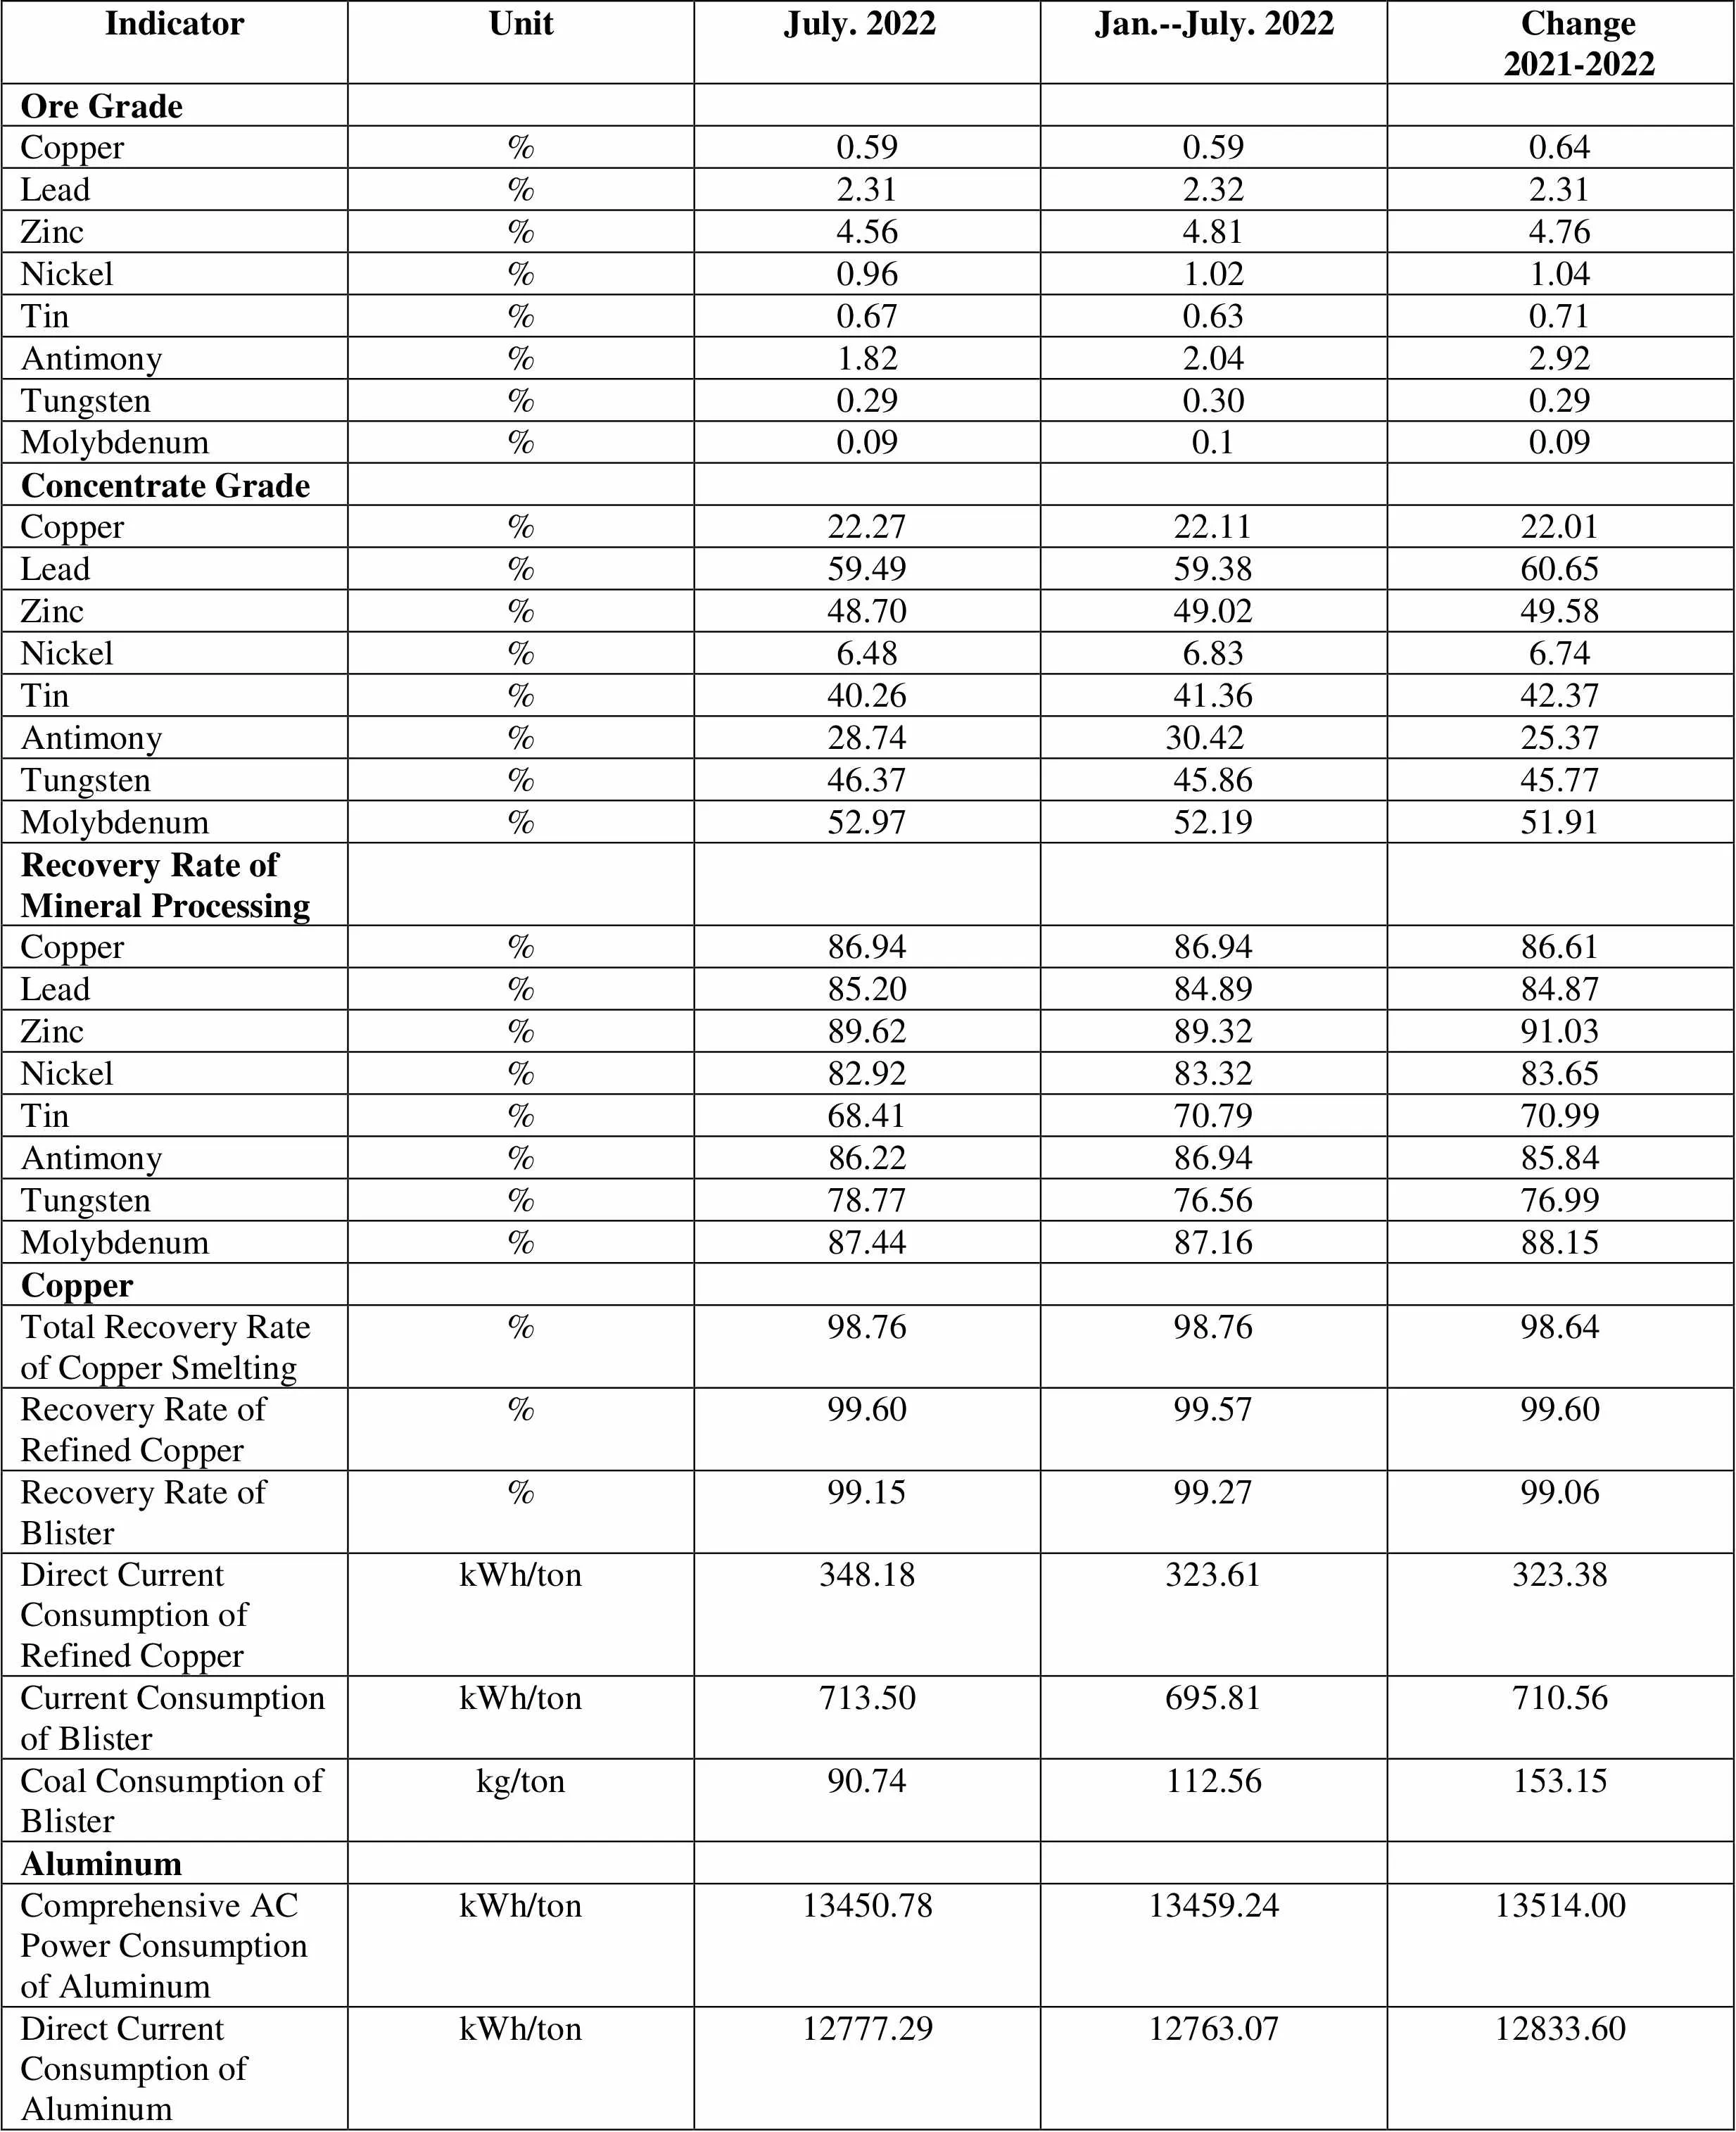
IndicatorUnitJuly. 2022Jan.--July. 2022 Change 2021-2022 Ore Grade Copper%0.590.590.64 Lead%2.312.322.31 Zinc%4.564.814.76 Nickel%0.961.021.04 Tin%0.670.630.71 Antimony%1.822.042.92 Tungsten%0.290.300.29 Molybdenum%0.090.10.09 Concentrate Grade Copper%22.2722.1122.01 Lead%59.4959.3860.65 Zinc%48.7049.0249.58 Nickel%6.486.836.74 Tin%40.2641.3642.37 Antimony%28.7430.4225.37 Tungsten%46.3745.8645.77 Molybdenum%52.9752.1951.91 Recovery Rate of Mineral Processing Copper%86.9486.9486.61 Lead%85.2084.8984.87 Zinc%89.6289.3291.03 Nickel%82.9283.3283.65 Tin%68.4170.7970.99 Antimony% 86.2286.9485.84 Tungsten%78.7776.5676.99 Molybdenum%87.4487.1688.15 Copper Total Recovery Rate of Copper Smelting%98.7698.7698.64 Recovery Rate of Refined Copper%99.6099.5799.60 Recovery Rate of Blister%99.1599.2799.06 Direct Current Consumption of Refined CopperkWh/ton348.18323.61323.38 Current Consumption of BlisterkWh/ton713.50695.81710.56 Coal Consumption of Blisterkg/ton90.74112.56153.15 Aluminum Comprehensive AC Power Consumption of AluminumkWh/ton13450.7813459.2413514.00 Direct Current Consumption of AluminumkWh/ton12777.2912763.0712833.60
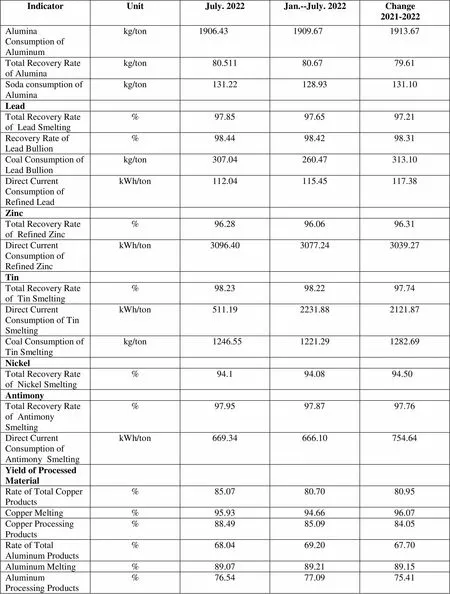
IndicatorUnitJuly. 2022Jan.--July. 2022 Change 2021-2022 Alumina Consumption of Aluminumkg/ton 1906.43 1909.671913.67 Total Recovery Rate of Aluminakg/ton80.51180.6779.61 Soda consumption of Aluminakg/ton131.22128.93131.10 Lead Total Recovery Rate of Lead Smelting%97.8597.6597.21 Recovery Rate of Lead Bullion%98.4498.4298.31 Coal Consumption of Lead Bullionkg/ton307.04260.47313.10 Direct Current Consumption of Refined LeadkWh/ton112.04115.45117.38 Zinc Total Recovery Rate of Refined Zinc%96.2896.0696.31 Direct Current Consumption of Refined ZinckWh/ton3096.403077.243039.27 Tin Total Recovery Rate of Tin Smelting%98.2398.2297.74 Direct Current Consumption of Tin SmeltingkWh/ton511.192231.882121.87 Coal Consumption of Tin Smeltingkg/ton1246.551221.291282.69 Nickel Total Recovery Rate of Nickel Smelting%94.194.0894.50 Antimony Total Recovery Rate of Antimony Smelting%97.9597.8797.76 Direct Current Consumption of Antimony SmeltingkWh/ton669.34666.10754.64 Yield of Processed Material Rate of Total Copper Products%85.0780.7080.95 Copper Melting %95.9394.6696.07 Copper Processing Products%88.4985.0984.05 Rate of Total Aluminum Products%68.0469.2067.70 Aluminum Melting%89.0789.2189.15 Aluminum Processing Products%76.5477.0975.41
Unit: metric ton
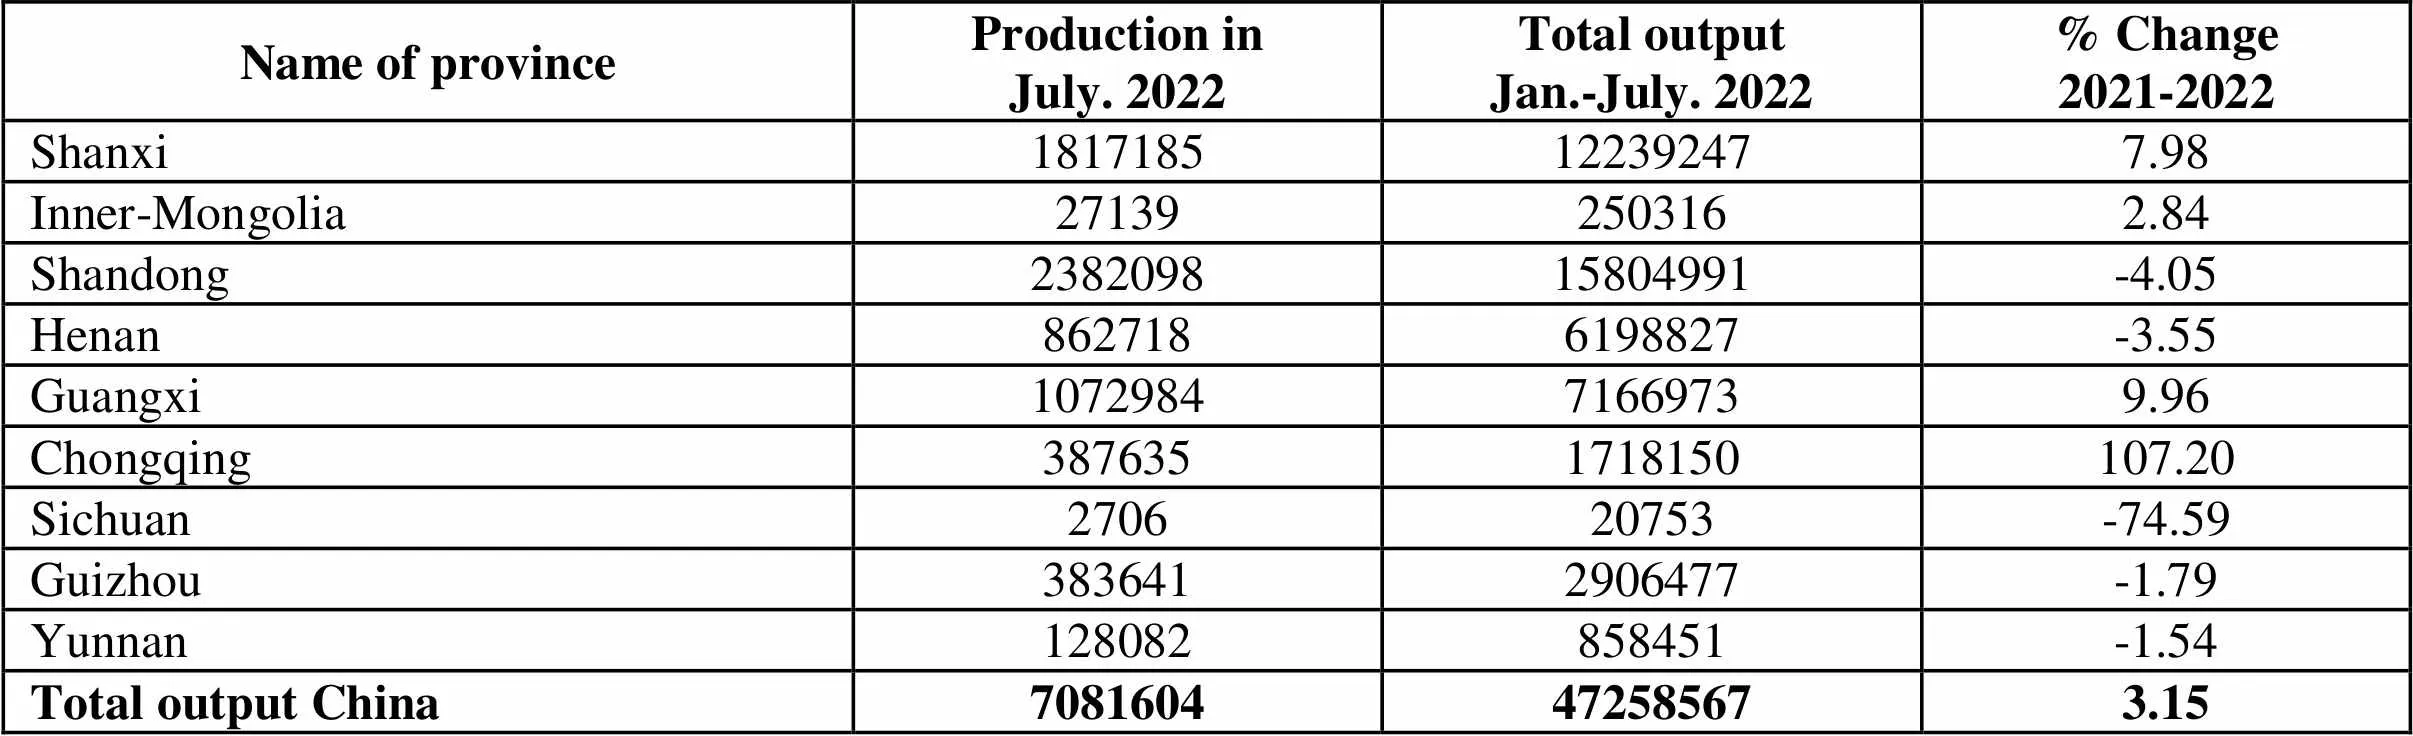
Name of province Production inJuly. 2022Total outputJan.-July. 2022% Change2021-2022 Shanxi1817185122392477.98 Inner-Mongolia271392503162.84 Shandong238209815804991-4.05 Henan8627186198827-3.55 Guangxi107298471669739.96 Chongqing3876351718150107.20 Sichuan270620753-74.59 Guizhou3836412906477-1.79 Yunnan128082858451-1.54 Total output China7081604472585673.15
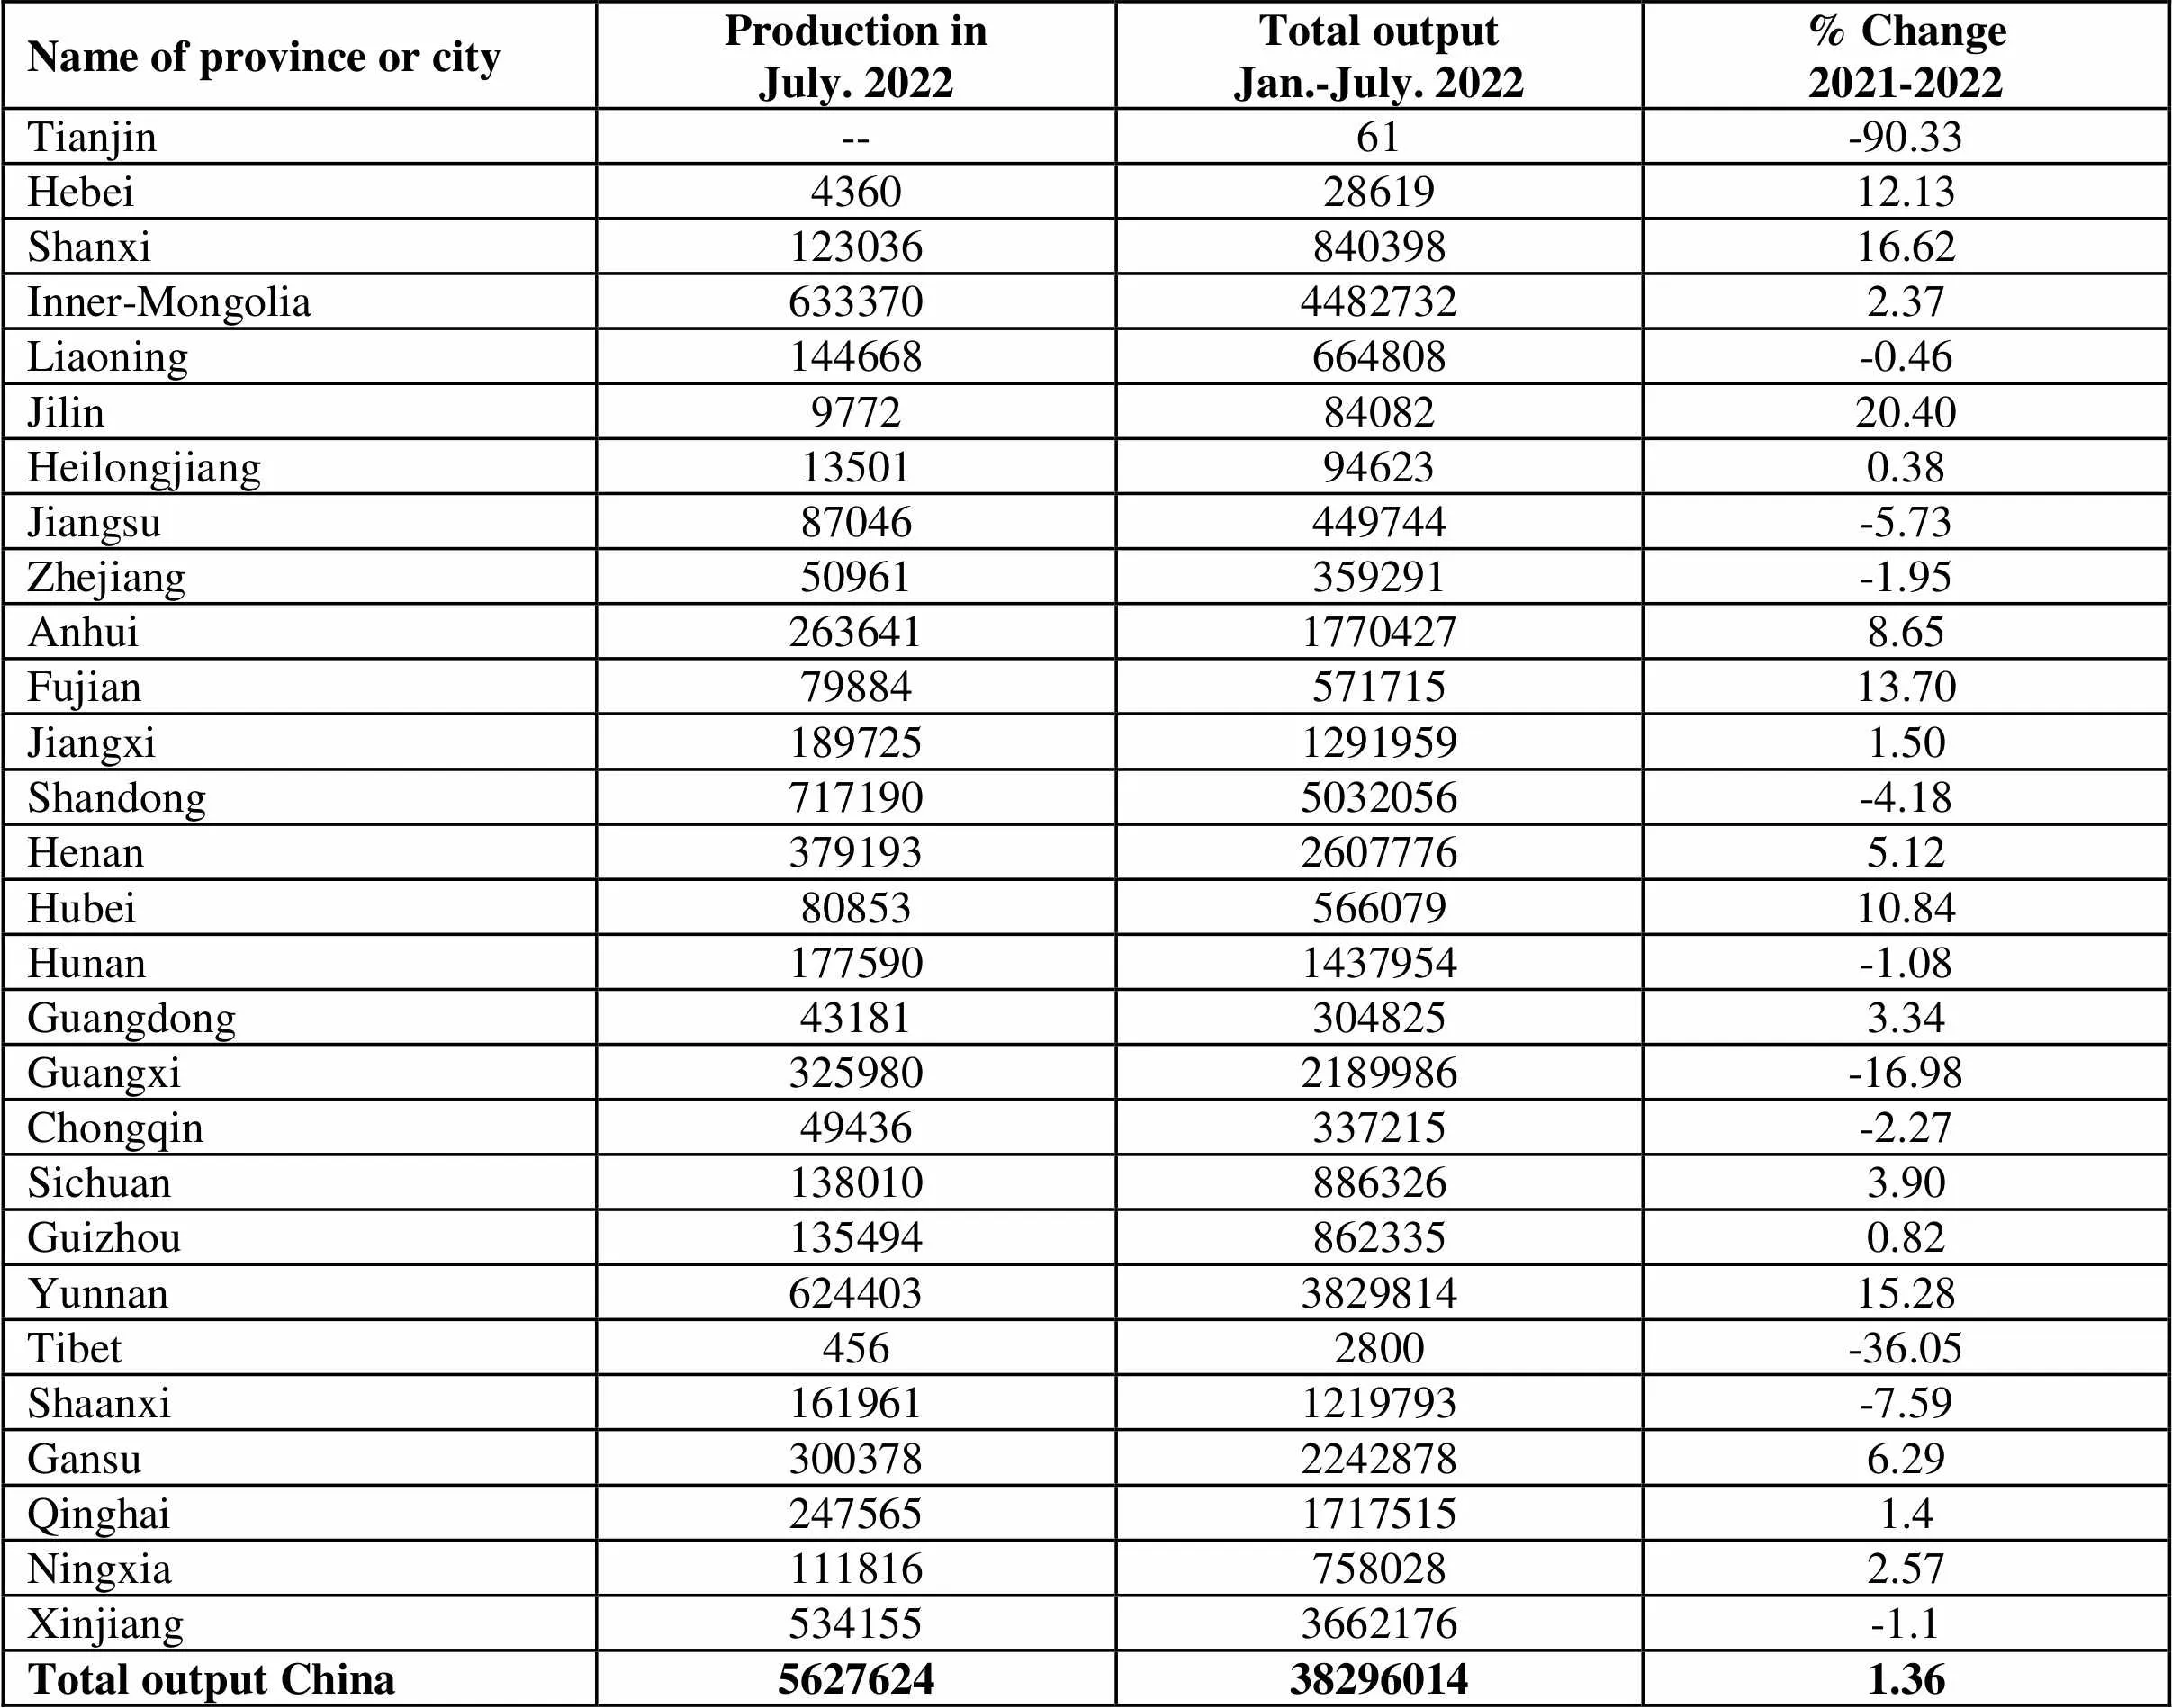
Name of province or cityProduction inJuly. 2022Total outputJan.-July. 2022% Change2021-2022 Tianjin--61-90.33 Hebei43602861912.13 Shanxi12303684039816.62 Inner-Mongolia63337044827322.37 Liaoning144668664808-0.46 Jilin97728408220.40 Heilongjiang 13501946230.38 Jiangsu87046449744-5.73 Zhejiang50961359291-1.95 Anhui26364117704278.65 Fujian7988457171513.70 Jiangxi18972512919591.50 Shandong7171905032056-4.18 Henan37919326077765.12 Hubei8085356607910.84 Hunan1775901437954-1.08 Guangdong431813048253.34 Guangxi3259802189986-16.98 Chongqin49436337215-2.27 Sichuan1380108863263.90 Guizhou1354948623350.82 Yunnan624403382981415.28 Tibet4562800-36.05 Shaanxi1619611219793-7.59 Gansu30037822428786.29 Qinghai24756517175151.4 Ningxia1118167580282.57 Xinjiang5341553662176-1.1 Total output China5627624382960141.36
Unit: metric ton
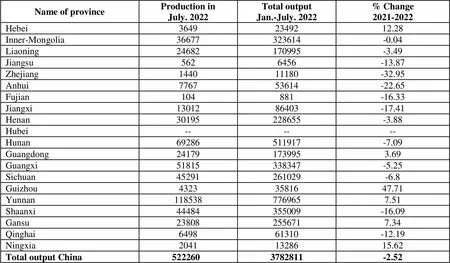
Name of provinceProduction inJuly. 2022Total outputJan.-July. 2022% Change2021-2022 Hebei36492349212.28 Inner-Mongolia36677323614-0.04 Liaoning24682170995-3.49 Jiangsu5626456-13.87 Zhejiang144011180-32.95 Anhui776753614-22.65 Fujian104881-16.33 Jiangxi13012 86403-17.41 Henan30195228655-3.88 Hubei------ Hunan69286511917-7.09 Guangdong241791739953.69 Guangxi51815338347-5.25 Sichuan45291261029-6.8 Guizhou43233581647.71 Yunnan1185387769657.51 Shaanxi44484355009-16.09 Gansu238082556717.34 Qinghai649861310-12.19 Ningxia20411328615.62 Total output China5222603782811-2.52
 China Nonferrous Metals Monthly2022年9期
- China Nonferrous Metals Monthly的其它文章
- Sichuan Province Will Accelerate the Transfer of Mining Right of Lithium, Iron, Phosphorus and Potassium Salt
- Domestic Key Alumina Enterprises Have Reached Consensus on Strictly Controlling New Production Capacity
- The Coordinated Development of Lithium Industry Needs Precise Efforts
- Holingol of Inner Mongolia Comprehensively Lays out Grand Development Pattern of Aluminum Industry