Comparison of Volatile Components and Aroma Profiles between Peel and Flesh of Tomatoes (Solanum lycopersicum)
CHENG Guoting, WANG Xinyu, LI Yushun, QI Shiming, WANG Jin, ZHAO Pan,WANG Yanfeng, ZHANG Fei, LIANG Yan,*
(1.College of Horticulture, Northwest A&F University, Yangling 712100, China;2.State Key Laboratory of Crop Stress Biology in Arid Regions, Northwest A&F University, Yangling 712100, China;3.School of Life Sciences, Yan’an University, Yan’an 716000, China)
Abstract: In order to explore the differences in volatile components and aroma profiles between the peel and flesh of tomato fruit, two inbred lines were used for this study, namely, CI1005 (red cherry tomato) with high concentrations of volatile components and TI4001 (green large-fruited tomato) with low concentrations of volatile components.Peel and flesh samples were taken at different maturation stages (mature green, turning, orange, and red stages) to analyze their volatile components as well as odor characteristics and intensity using headspace solid-phase microextraction (HS-SPME) coupled to gas chromatography-mass spectrometry-olfactometry (GC-MS-O).The results showed that there was little difference in volatile components between the peel and flesh of the same inbred line during fruit ripening.The concentrations of volatile components were significantly higher in the peel than in the flesh of CI1005 at each ripening stage, especially aldehydes,alcohols, esters, acids, and ketones.On the contrary, the concentrations of volatile components were significantly higher in the flesh of TI4001, especially aldehydes, esters, and acids.The aroma intensity was significantly stronger in the peel of CI1005, especially in terms of fatty, malty and green aroma, while the flesh showed stronger sweet taste.The peel and flesh had the strongest grassy and fruity aroma, respectively.During fruit ripening, the aroma of the peel increased more than that of the flesh.The maximum difference occurred at the red mature stage.Aroma intensity was stronger in the flesh than in the peel of TI4001, especially in terms of fatty, mushroom-like and green aroma.The strongest fatty aroma was found in the flesh and the strongest floral aroma in the peel.At the turning stage, both the peel and flesh had the strongest aroma, and the maximum difference occurred at this stage.The concentrations of volatile components and the aroma intensity of CI1005 were significantly higher than those of TI4001.In conclusion, significant differences in volatile components and aroma existed between the peel and flesh of tomatoes.
Keywords: Solanum lycopersicum; inbred line; fruit tissue; volatile organic compound; odor activity value; olfactory evaluation
Tomato is an essential horticultural crop that plays a unique role as a model for fruit development[1-3]and is popular among consumers for its pleasant flavor[4-6].However,the commercial production of tomatoes in the pursuit of yield has inadvertently led to the loss of flavor, which caused complaints from consumers[6].The challenge of improving tomato flavor has, thus, intrigued researchers, who have found the composition and concentration of volatiles contributed greatly to the formation of tomato volatile flavor[4].The volatiles profiles were the primarily responsible for the differences in flavor across tomato species[7].Furtherly,the factors affecting the accumulation of volatiles were the genotype, cultivation conditions, harvest-stage maturity, and post-harvest treatment[8-12], which could change the level of precursor supply, gene expression, enzyme activity, and frequency of enzyme contact with substrates[13-18].Previous studies have mainly focused on the whole fruit; however, the structure of each part of the fruit plays a different role, and the profile of volatiles may vary across the different parts of the fruit.Recently, some researchers compared the volatiles across different parts of tomato fruit[19-20]and explored the effects of fatty acid concentration and lipoxygenase activity on the volatiles of tomato peel and flesh[21].However, to the best of our knowledge, the characteristics of accumulation and of changes in volatiles in the peel and flesh throughout the ripening process have not yet been characterized.Since the physicochemical and biochemical properties change differently between the peel and flesh during the ripening process, the evaluation of tomato flavor is still to be improved.In the present study, the volatiles between the peel and flesh of tomatoes were analyzed and the aroma description and intensity were evaluated at different ripening stages by the gas chromatography-mass spectrometry-olfactometry (GCMS-O) methods.An improved understanding of the changes in and distribution of volatiles may aid the breeding of tomato fruit with improved aromatic quality, as well as the development of functional foods.
1 Materials and Methods
1.1 Materials and reagents
1.1.1 Plant materials
The strong-flavored CI1005 (Solanum lycopersicumvar.cerasiforme) and the mild-flavored TI4001 (S.lycopersicum)were selected from 90 inbred lines as plant materials.The CI1005 has a relatively more appealing aroma and acharacteristic red color, whereas the TI4001 has a relatively unpleasant odor and a characteristic yellow-green color among 90 tomato breeding inbred lines.The two tomato inbred lines came from the Research Group of Tomato Genetic Breeding and Quality Improvement, Northwest A&F University, Yangling, Shaanxi Province, China (Fig.1).
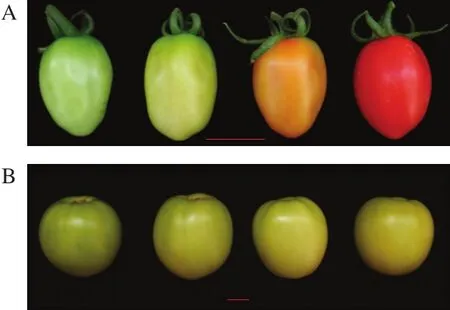
Fig.1 Tomato fruits of two inbred lines CI1005 (A) and TI4001 (B) at different ripening stages
1.1.2 Reagents
Five internal standards (3-nononone, 3-octene-2-one,3-hexanone, 1-octenol, and 1-heptenol) (chromatographically pure 98%) was purchased from Meryer, China Chemical Technology Co.Ltd., Shanghai, China.
1.2 Instruments and equipments
FJ200-SH digital high-speed dispersion homogenizer was purchased from Specimen model factory in Shanghai,China; 75 μm CAR/PDMS extraction head and manual injection handle of SPME were purchased from Supelco Co.Ltd., USA; TRACE ISQ gas chromatography-mass spectrography was purchased from Thermo Scientific Co.Ltd., USA; Chromatographic column DB-5 (60 m × 0.32 mm,0.25 μm) and HP-INNOWAX (60 m × 0.25 mm, 0.25 μm)were purchased from Agilent Technologies Inc., USA; OP275 Pro II olfactory detector was purchased from GL Sciences Inc., Japan; Thermostatic magnetic agitator was purchased from Troemner Inc., USA.
1.3 Methods
1.3.1 Samples
Tomato seeds, after germinating, were sowed in holed trays containing the substrate, wherein they grew into seedlings in January 2018.When the tomato seedlings grew to four leaves, they were planted with row spacing of 60 cm and plant spacing of 30 cm in a greenhouse.One hundred seedlings of each of the two materials, CI1005 and TI4001,were planted.According to the surface color and texture of the tomato fruit, its ripening process was divided into the following stages: mature green, breaker, turning, orange, light red, and red stages[22].In this study, the mature green (S1),turning (S2), orange (S3), and red (S4) stages were chosen(Fig.1), and tomato samples were collected from the thirdear fruit.Since it was difficult to evaluate the fruit ripening stage of TI4001, the number of days after pollination (DAP)was also considered: S1 (65 DAP), S2 (78 DAP), S3 (82 DAP), and S4 (85 DAP).The average weight of a single fruit of CI1005 and TI4001 was 15 g and 55 g, respectively.Thirty fruits of CI1005, and twelve fruits of TI4001 were selected from each ripening stage.Each sample had three biological replicates.
1.3.2 Sample preparation
Tomato peel (1 mm thick) was separated, as thin as possible, from the flesh using a paring knife.The peel and flesh samples were pureed using a homogenizer.To reduce the interference of the active enzymes to the profiles of volatiles,the active enzymes in tomato samples were inactivated at 90 ℃ for 3.5 min.To prepare samples for analysis of solidphase microextraction (SPME), a 5 g crushed sample, total 50 μL of five internal standards (3-nononone, 3-octene-2-one,3-hexanone, 1-octenol, and 1-heptenol), 3 g of anhydrous NaCl, and a magnetic rotor were added to a 40 mL headspace bottle[23].The five internal standards were not found in tomato,high purity, and stable properties under normal temperature and pressure.Their retention times (RT) were close to that of other volatiles.Their recovery rates were 95.631%-98.423%.
1.3.3 SPME sampling
The prepared samples were kept undisturbed for 10 min and then stirred using a thermostatic magnetic agitator at 300 r/min at 50 ℃ for 40 min.Some artifacts such as 1,1,1,5,5,5-hexamethyl-3-[(trimethylsilyl)oxy]-trisiloxane or octamethyl-cyclotetrasiloxane may have formed during SPME process.These artifact compounds were not counted.During this process, the volatile aromatic compounds were extracted with a 75 mm particle size and 10 cm length of CAR/PDMS fiber assembly.The SPME fiber assembly was used in conjunction with the manual injection handle 57330U.
1.3.4 Volatiles analysis
The volatiles were analysis using the GC-MS-O methods.The GC-MS instrument model is ISQ &TRACE ISQ.The polar chromatographic column HPINNOWAX (60 m × 0.25 mm, 0.25 μm) was filled with polyethylene glycol.The weak polar chromatographic column DB-5 DB-5 (60 m × 0.32 mm, 0.25 μm) was filled with 5%phenyl + 1% vinyl + 94% dimethyl polysiloxane.The OP275 Pro II olfactory detector was connected at the outlet of the capillary column of GC.
The GC conditions were as follows[24]: a carrier gas comprising more than 99.999% helium, no split injection,a column flow rate of 1 mL/min, and a split ratio of 20:1.Capillary column temperature program: the initial temperature of the gas chromatographic column was 40 ℃, increased to 110 ℃ at a rate of 10 ℃/min, increased to 230 ℃ at a rate of 6 ℃/min and maintained for 10 min.The MS conditions were as follows: electron ionization with ion source, 70 eV of electron energy, “full-scan” scanning mode, a scanning mass range of 35–450 u, and ion source and transmission line temperatures of 230 ℃.
After headspace SPME, the fiber was immediately inserted into the GC-MS chamber.The volatiles, adsorbed on the fiber, were desorbed for 2.5 min, which would be separated by chromatographic columns.The volatiles separated by the GC were distributed into the MS and the olfactory detector at a split ratio of 1:1.The masses and structures of volatiles were detected by the MS, and the aroma characteristics and intensities of volatiles were described and evaluated by a trained panelist at the outlet of the olfactometer[25-26].
1.3.5 Qualitative and quantitative analysis
After GC-MS separation, all volatile aromatic compounds were analyzed using Xcalibur software (version 2.0, Thermo Scientific, USA), and compared against the standard mass spectral and retention index (RI) libraries(NIST2011, USA).The volatiles were identified with reference to mass spectral matching and related literature[27-28].Only those with both positive and negative matches greater than 800 (maximum 1 000) were selected.The concentrations of the volatiles were calculated by the area normalization method using the internal standard peak[29], as follows:

wheremnis the concentration of the volatile compound(named “n”),Snis the peak area of the volatile compound(named “n”),mtis the concentration of the internal standard compound,Stis the peak area of the internal standard compound, andm0is the mass of the sample.
The RT of each normal alkane was measured under the same GC-MS conditions after mixing the standard solution of the C4–C26normal alkanes.The RI was calculated for each volatile according to the following formula:

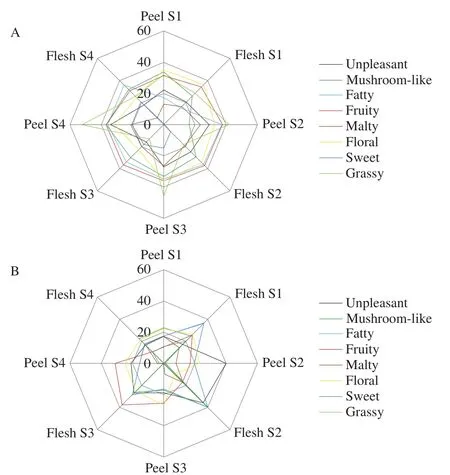
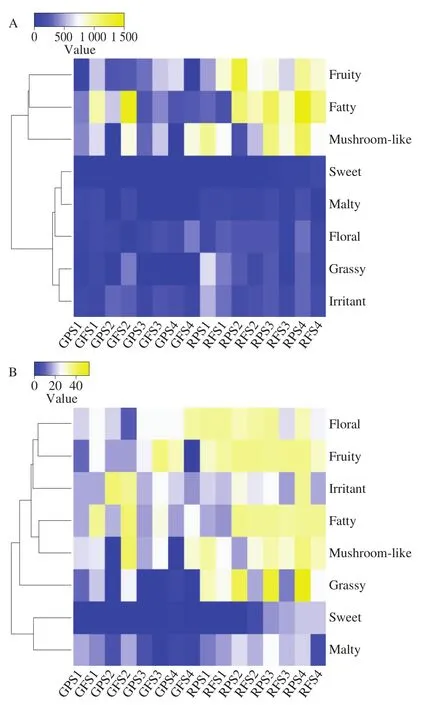
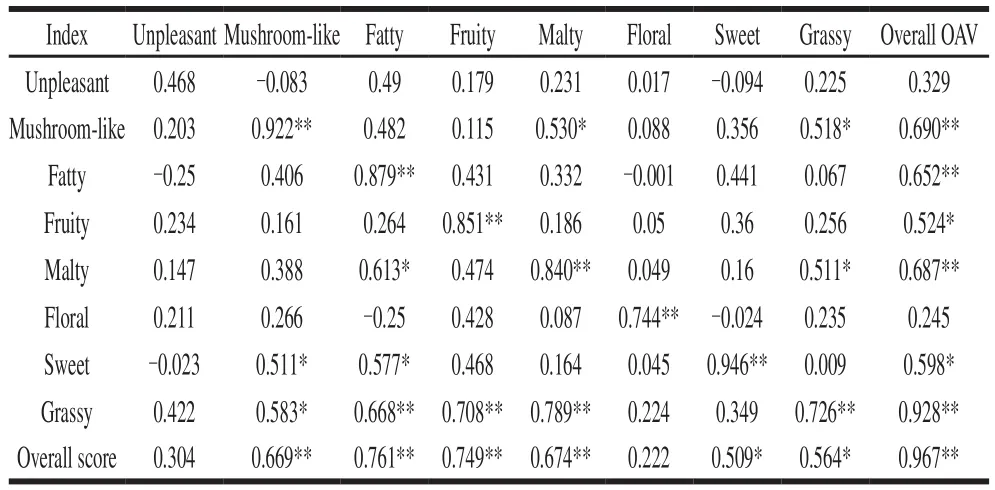
wheret’Ris the retention time,ZandZ+ 1 are the numbers of carbon atoms in the normal paraffins before and after the target volatiles (X) flow out, respectively;t’R(z) Owing to the fact that volatiles are partitioned differently in the headspace and have different affinities for the polymer on the SPME fiber[30], calibration curves of the key volatiles were essential for quantitative analysis using the GC-MS method[31]; i.e., the measured concentrations of volatiles required correction according to their calibration curves.In this study, five internal standards and thirty-eight standards of volatiles were added to 5 mL of water.The concentration gradient was formed by adding 0, 5, 10, 15, 20, 25, and 30 μL of volatiles standards, respectively.The volatiles were measured under the same GC-MS conditions.Linear regression analysis was performed using the theoretical concentration of the volatile standard and the concentration calculated by equation (1)[32], as measured by GC-MS.The concentration of each volatile must be corrected according to its calibration curve after calculation with equation (1). 1.3.6 Evaluation of flavor To reduce individual differences in olfactory sensitivity,the aroma of each tomato sample was evaluated by five specialists.The olfactory score of volatile was divided into six grades, such as very strong (5), strong (4), medium (3), weak(2), very weak (1), no aroma (0)[33-34].The final olfactory score of each volatile was the total of the scores from the five panelist and was a number between 0 and 25.The stronger the aroma, the higher the score.The OAV represents the ratio of the concentration of a volatile to its aroma threshold[35].The aroma thresholds in water were determined by means of the triangle test in increasing concentrations of average[35-36]. WPS Office and SPSS 22.0 were used to conduct the statistical analysis.The significant differences (P< 0.05)across all samples were determined using a one-way ANOVA and Tukey’s test.Significant difference was determined between in the peel and flesh at each stage of fruit ripening using independent-samplesttest.Error of each sample was analyzed by of standard deviation (SD). A total of thirty-eight volatile components were detected in this study, including fourteen aldehydes, thirteen alcohols,four ketones, two esters, two acids, and three others.The equation of the calibration curve and regression coefficient of each volatile were shown in Table 1. In CI1005, the volatile components were 29, 31, 35, and 31 in the peel and 32, 36, 33, and 31 in the flesh from S1-S4(Table 2).The concentrations of volatiles were significantly higher in the peel than in the flesh, and the difference increased during fruit ripening.The aldehydes [hexanal,(E,E)-2,4-decadienal], 3-methyl-1-butanol, and 2-ethylcyclobutanol had higher concentrations in the peel than in the flesh throughout the development process.In terms of the average of the four ripening stages, 3-hexen-1-ol, 3-methyl-1-pentanol, 1-hexanol, and (E)-2-hexenal were significantly higher in the peel than in the flesh.At S3, volatiles of each functional group were higher in the peel than in the flesh.Furthermore, some volatiles were higher in the peel, such as the alcohols and acids at S2 and S4, ketones at S4, esters at S1 and S4, and other volatiles at S1.In terms of metabolic precursors, Ile/Leu-derived volatiles were higher in the peel during ripening.Only the lipid-derived and isopentadienederived volatiles at S1 and the Phe-derived volatiles at S2 were higher in the flesh than in the peel.At other ripening stages, the concentrations of volatiles derived from different precursors were higher in the peel than in the flesh.As the fruit ripened, the volatiles levels were increased.The concentration of total volatiles increased by 3 167.79 μg/kg in the peel and 1 704.05 μg/kg in the flesh from S1 to S4.The differences in volatiles concentrations increased from 276.26 μg/kg to 1 740 μg/kg between in the peel and in the flesh. Table 1 Primary properties of volatile components detected in this study In TI4001, the volatile components were 30, 21, 25, and 26 in the peel and 30, 24, 27, and 21 in the flesh from S1–S4 (Table 3).The concentrations of volatiles were higher in the flesh than in the peel.The esters (methyl salicylate)were higher in the flesh, while the alcohols (3-methyl-1-pentanol and 3-methyl-1-butanol) were higher in the peel throughout ripening.The aldehydes and acids at S1, S2,and S3, ketones at S2, S3, and S4, other volatiles at S3 and S4 were higher in the flesh than in the peel.Lipid-derived and Phe-derived volatiles were higher in the flesh during ripening.Furthermore, Ile/Leu-derived volatiles at S2 and isopentadiene-derived volatiles at S3 were higher in the flesh.In terms of the average of the four ripening stages, methyl salicylate, hexanoic acid, (E)-2-octenal, and hexanal were significantly higher in the flesh than in the peel.During ripening,the concentrations of most volatiles increased from S1 to S2,then decreased continuously from S2 to S4.The concentration of total volatiles were higher 270.62, 860.83, 159.80, and 31.45 μg/kg in the flesh than in the peel at S1-S4, respectively. Table 2 Concentrations of volatile components in the peel and flesh of tomato inbred line CI1005 μgkkgg Table 3 Concentrations of volatile components in the peel and flesh of tomato inbred line TI4001 μg/kg 2.2.1 OAVs of volatile compounds The total OAV of CI1005 was higher in the peel than in the flesh at each ripening stage, and it was higher in the flesh than in the peel of TI4001 (Fig.2).Among the thirty-eight volatiles, the OAVs of the following were higher with lower thresholds in water: (E,E)-2,4-decadienal(707), 1-octen-3-one (689), decanal (551), (E,E)-2,4-heptadienal (300), hexanoic acid (163), 4-ethoxy-2-methoxyphenyl formate (155), 2-methoxy-phenol(117), 2-decen-1-ol (113), benzaldehyde (110), and 2-nonen-1-ol (108). Fig.2 Radar maps of odor activity of the peel and flesh of two tomato inbred lines According to the expert’s description, the aromas with similar characteristics were divided into one category, such as floral, fruity, fatty, sweet, malty, grassy, mushroom-like,or unpleasant (smoky, musty, pungent) aromas.In CI1005,the aroma intensity was stronger in the peel than in the flesh.The fatty, fruity, and mushroom-like aromas were the strongest, followed by the grassy, unpleasant, and floral aromas.The sweet and malty aromas were the weakest.The grassy, fatty, and malty aromas were stronger in the peel than in the flesh, while the sweet aroma was stronger in the flesh at each ripening stage.The floral and fruity aromas at S1, and the mushroom-like and unpleasant aromas at S2 were stronger in the flesh.At the other ripening stages, the four aromas were stronger in the peel than in the flesh.The difference in aroma intensity between the peel and the flesh increased continuously during the ripening process.Among the four ripening stages, the grassy and unpleasant aromas were strongest at S1, while the sweet and fatty aromas were strongest at S4 both in the peel and in the flesh.Furthermore,the malty, floral, and mushroom-like aromas at S4 and the fruity aroma at S2 were strongest in the peel.In contrast, the malty and floral aromas at S1, and mushroom-like aroma at S3, and the fruity aroma at S4 were strongest in the flesh. In TI4001, the aroma intensity was stronger in the flesh than in the peel.The fatty and fruity aromas were strongest in the peel, followed by the grassy, unpleasant, mushroomlike, and floral aromas.The malty, grassy and sweet aromas were the weakest.In the flesh, the fatty and mushroomlike aromas were strongest, followed by the fruity aroma,floral, unpleasant, and grassy aromas.The malty and sweet aromas were the weakest.The fatty, mushroom-like aromas and grassy aromas were stronger in the flesh than in the peel.Furthermore, the following aromas were stronger in the flesh:the fruity aroma at S1, S2, and S3; the floral aroma at S1, S3,and S4; the malty aroma at S1 and S2; and the unpleasant aroma at S3.The difference in aroma intensity increased from S1 to S2 between the peel and the flesh, and decreased continuously from S2 to S4.The unpleasant and fatty aromas increased from S1 to S2 and then decreased continuously from S2 to S4.Among the four ripening stages, the unpleasant,mushroom-like, fatty, malty, and grassy aromas at S2; the fruity aroma at S3; and the floral aroma at S4 were stronger in the flesh.The mushroom-like, malty, and grassy aromas at S1; unpleasant and fatty aromas at S2; and the floral and fruity aromas at S4 were the stronger in the peel. 2.2.2 Olfactory test Since OAV evaluation of flavor ignores the synergistic and antagonistic effects among volatile compounds, we also conducted a olfatory test of the peel and flesh of tomatoes at different ripening stages (Fig.3).The aromas of thirty-one volatile compounds of CI1005 were recorded.The volatile components of each aroma description were: seven grassy,five floral, four unpleasant and fruity, three sweet, malty, and mushroom-like, and two fatty.The total olfactory scores of aroma intensity in the peel, from high to low, were grassy,fruity, floral, fatty, mushroom-like, unpleasant, malty, and sweet.In the flesh, the total olfactory scores from high to low were fruity, fatty, floral, mushroom-like, grassy, unpleasant,malty, and sweet.The olfactory scores of volatile compounds from S1 to S4 were higher in the peel than in the flesh by nine, thirteen, sixty-three, and seventy-nine, respectively.Among these, the mushroom-like aroma at S1; grassy aroma at S2; grassy, floral, and unpleasant aromas at S3; and grassy,unpleasant, and malty aromas at S4 were higher olfactory scores in the peel.Only at S2, the olfactory score of the mushroom-like aroma was higher in the flesh than in the peel. Fig.3 Radar map of olfactory scores of the peel and flesh of two tomato inbred lines The aromas of twenty-six volatile compounds of TI4001 were recorded.The volatile components of each aroma description were: six grassy, four fruity and unpleasant, three mushroom-like, malty, and floral, two fatty, and one sweet.The olfactory scores of aroma intensity in the peel, from high to low, were floral, unpleasant, fruity, fatty, mushroomlike, malty, grassy, and sweet.In the flesh, the olfactory scores from high to low were fatty, mushroom-like, floral,unpleasant, fruity, grassy, and malty.The olfactory scores from S1 to S4 were higher in the flesh than in the peel by forty-five, seventy-nine, thirty-five, and three, respectively.Among these, the fatty and fruity aromas at S1; mushroomlike, grassy, and fatty aromas at S2; grassy, fatty and fruity aromas at S3; and mushroom-like aroma S4 were higher in the flesh than in the peel.The olfactory score of fruity aroma was higher in the peel than in the flesh.The volatiles that could only be recorded in the flesh but not in the peel were(E,E)-2,4-decadienal, nonanal, 2-ethyl-cyclobutanol, (Z)-2-heptenal, 3-hexen-1-ol, and hexanal.Both 2-isobutylthiazole and 3,7-dimethyl-2,6-octadienal were recorded in the peel but not in the flesh. The aroma intensity of each characteristic was stronger in CI1005 than in TI4001, especially the fruity, mushroomlike, and fatty aromas.Only the aroma intensities of fatty,mushroom-like, grassy aromas were stronger in TI4001 than in CI1005 in the flesh at S2. The OAVs and olfactory scores of volatiles are shown in Fig.4.The malty and sweet aromas were clustered into one group, and the fruity and floral aromas were clustered into the other group.According to the OAVs (Fig.4A), the unpleasant and grassy aromas were clustered into one group.The malty, sweet, unpleasant, and grassy aromas were closely related to the floral aroma.The five categories aromas above were weaker in the tomato fruits.The fatty and fruity aromas were closely related to the mushroom-like aroma.The three categories aromas above were stronger in the tomato fruits.In particular, the OAVs of these three aroma characteristics were significantly higher in CI1005 than in TI4001.According to the olfactory scores (Fig.4B), the mushroom-like and fatty aromas were clustered into one group.The peel of CI1005 had a much higher olfactory score in grassy aroma.The grassy aroma was relatively distant from the other aromas,which was the major difference between the tomato the two inbred lines.The olfaction score of each aroma characteristic was significantly higher in CI1005 than in TI4001. Fig.4 Heat maps of odor activity (A) and olfactory scores (B) of the peel and flesh of tomato inbred lines CI1005 and TI4001 at different ripening stages The correlation between OAVs and olfactory scores is shown in Table 4.There were higherly significant positive correlations between the OAVs and olfactory scores in terms of mushroom-like (0.92**), fatty (0.88**), fruity (0.85**),malty (0.84**), floral (0.74**), sweet (0.95**), grassy(0.73**), and overall aromas (0.97**).Furthermore, the OAVs had significant positive correlations with the olfactory scores of other aromas. Table 4 Correlation analysis between odor activity and olfactory scores The peel and the flesh are indispensable components of tomato fruits and their volatiles profiles are significant differences.In CI1005, the concentrations of total volatiles,aldehydes, alcohols, esters, acids, and ketones were higher in the peel than in the flesh.The difference in volatiles concentrationes between the peel and flesh increased as the fruit ripened.Previous studies have shown the same results in tomato fruits[21]and apple fruits[8].The volatiles concentrations in the pericarp tissue were higher than that in the locular gel of tomato[19,47].In the present study, several abundant volatiles were significantly higher in the peel than in the flesh of CI1005, for example C6aldehydes and C6alcohols.Similarly, among all detected volatiles, (E)-2-hexenal was recognized as the most essential in cherry tomato[27]and jujube fruits[48].(E)-2-hexenal and (E)-2-hexenol were found to be produced in the peel of pepino, but not detected in its flesh[49].Interestingly, the volatiles concentrations in both the peel and the flesh of CI1005 increased during fruit ripening, and even faster in the peel.Because the subcellular physical changes during ripening of tomato fruits increase the frequency of contact between separated enzymes and substrates[6], which can promote the accumulation of volatiles.The previous study found that most of the free and bound volatiles rosed during the fruits maturity in tomato[50]and rubus corchorifolius[51].Since the synthesis of most volatiles occurs via aerobic reactions, the tissue close to the external surface of the fruit (for example the peel) has an abundance of aromatic compounds[52]. In TI4001, the concentrations of total volatiles,especially aldehydes, esters, and acids volatiles were higher in the flesh than in the peel; this is the first report of this phenomenon in tomato fruits.A similar finding has been previously reported for banana, in which the pulp, rather than the peel, was the primary site of volatiles synthesis[53].Abundant volatiles (methyl salicylate, hexanoic acid,(E)-2-octenal, hexanal, and (Z)-2-heptenal) were significantly higher in the peel than in the flesh of TI4001.The volatiles concentrations of each metabolic pathway were increased from S1 to S2, while decreased from S2 to S4.The mature fruit color of TI4001 is yellow-green.Maybe, the chlorophyll content of TI4001 fruit decreased after S2, but the chromoplast level increased limitedly.Similar to this,the concentration of total aldehydes was the highest at halfred maturity stage of jujubes[48].C9volatiles decreased during fruit ripening in pepino[49].The concentrations of total glycosidically bound volatiles increased at the former stages,while decreased at the orange stage of satsuma mandarin fruits[54].The glycoside restrained phenylpropanoid volatiles emission at the later phases of tomato fruits ripening[55]. In tomato, most of the important flavor-related volatiles are derived from essential nutrients[56-57], such as lipid,isopentadiene, Ile/Leu-derived, and Phe.The key enzymes involved in the synthesis of volatiles are lipoxygenase[58],carotenoid cleavage dioxygenase[59-61], aromatic amino acid decarboxylase[62], and branched-chain amino acid aminotransferase[63].The supply levels of precursor compounds, enzyme activity and transcription factors are the major controlling factors in the accumulation of volatiles[49,64].In various types of fruits, the precursor availability and enzyme activity levels have been shown to be higher in the peel than in the flesh.The precursor and enzyme activity supply levels were higher in the peel than in the flesh of apples[8].Lipoxidase activity and fatty acid concentration,especially the concentrations of total fatty acid and linolenic acid, were higher in the peel than in the flesh of tomato[21],melon[65], kiwifruit[52], and peach[66-67].The enzymatic activities of alcohol dehydrogenase and alcohol acyltransferase were higher in the peel than in the flesh of melon[65].In this study,the concentrations of lipid-derived, Ile/Leu-derived, and Phederived volatiles were significantly higher in the peel than in the flesh of CI1005.The concentrations of isopentadienederived volatiles were higher in the flesh than in the peel from S1 to S3, whereas they were significantly higher in the peel than in the flesh at S4.Similarly, the carotenoid concentration was found to be higher in the flesh of tomato than in its peel[6].The concentrations of lipid-derived and isopentadienederived volatiles were higher in the pericarp than in the locular gel of tomato[19].In TI4001, the concentrations of lipid-derived and Phe-derived volatiles were significantly higher in the flesh than in the peel during ripening.Ile/Leuderived and isopentadiene-derived volatiles were slightly lower in the flesh than in the peel.More Ile/Leu-derived volatiles (2-methylbutanal and 3-methylbutanol) have been detected in the inner tissues of tomato fruit than in its pericarp[19-20].In another study, the concentrations of arginine,leucine, lysine, phenylalanine, and tyrosine were higher in the pulp than in the peel of banana[53].It is well known that the peel is the protective tissue, while the flesh is the nutrient-rich tissue; the flesh accumulates more photosynthetic products than the peel, and volatiles precursors are more abundant in the flesh of TI4001. The OAV is determined by both the concentration and threshold of volatiles.In the present study, the volatiles with strong aroma intensity had a low threshold rather than a high concentration, for example (E,E)-2,4-decadienal, 1-octen-3-one, decanal, and (E,E)-2,4-heptadienal.The total OAVs of CI1005 were higher in the peel than in the flesh during the entire ripening process.Judging by the OAVs and olfactory scores[35], the overall flavors were stronger in the peel than in the flesh, especially the grassy, fatty, and malty aromas.The highest olfactory score in the peel was grassy aroma,while in the flesh it was fruity aroma.The difference in aroma intensity between the peel and the flesh continuously increased during ripening.In contrary, the total OAVs of TI4001 were higher in the flesh than in the peel throughout ripening.Based on the OAVs[35]and olfactory scores, the overall flavors were stronger in the flesh than in the peel,especially fatty, mushroom-like, and grassy aromas.The highest olfactory score in the peel was floral aroma, whereas it in the flesh was fatty aroma.The difference in aroma intensity between the peel and the flesh increased from S1 to S2 and then decreased continuously from S2 to S4. Since aroma preferences vary from person to person[68],the volatiles favored by consumers were lipid-derived volatiles (hexanal, (E)-2-hexenal, (E)-2-heptenal, (E,E)-2,4-decadienal, 1-hexanol, (Z)-3-hexenol), carotenoidderived volatiles (6-methyl-5-hepten-2-one, (E)-6,10-dimethyl-5,9-undecadien-2-one), 2-phenylethanol, and 2-isobutylthiazole[69-73].The volatiles with lower flavor acceptability were butyl acetate, 3-methyl-1-butanol,methyl salicylate, and guaiacol[71,74-75].This study found only 3-methyl-1-pentanol (pungent) and methyl salicylate(herbal), 2-methoxy-phenol (smoky), 3-methyl-1-pentanol(pungent), and 4-ethoxy-2-methoxyphenyl formate (smoky)to have unpleasant aromas; all others had pleasant aromas.The undesirable aromas were stronger in the peel than that in the flesh.Similar trends were found in the OAV and the olfactory score of the peel and the flesh, indicating that the two methods of aroma evaluation were scientific, reasonable,and reliable. The tomato material CI1005, a cherry tomato, contains a high nutrient concentration and provides sufficient substrate for volatiles synthesis.Bright colors and strong aromas can attract animals, facilitating seed dispersal.The tomato material TI4001, a large-fruited cultivated tomato, has low in nutrient concentration and is a relatively insufficient precursor of volatiles compared to CI1005.However, the concentrations of phenolic derivatives (methyl salicylate) with an unpleasant aroma were higher, which aid in resisting microbial invasion.The conversion of chlorophyll into carotenoids was key at S2, during which more volatile precursors were produced[76].However, the process for TI4001 was blocked, leading to insufficient synthesis of volatiles at the following stage.Thus,the highest concentration of volatiles appeared at S2.The fatty, fruity, and mushroom-like aromas were stronger than the other aromas and were significantly stronger in CI1005 than in TI4001.As a result of sensory interaction, the more the volatile components, the stronger the aroma[45].The volatile components of CI1005 were more than that of TI4001, so the fruit of CI1005 had a stronger aroma.In addition, compared with TI4001, the peel of CI1005 was thinner, indicating that the latter releases volatiles more easily. The volatiles and aroma varied significantly across the different structural parts during fruit ripening.The higher concentration and stronger aroma of volatiles appeared in the peel of CI1005, while they appeared in the flesh of TI4001.The volatiles concentrations in both the peel and the flesh ofCI1005 increased during fruit ripening, and even faster in the peel.The maximum difference in the total concentrations of volatiles between the peel and flesh occurred at S4 in CI1005 and at S2 in TI4001, respectively.The concentrations of lipidderived, Ile/Leu-derived, and Phe-derived volatiles were significantly higher in the peel than in the flesh of CI1005.The concentrations of lipid-derived and Phe-derived volatiles were higher in the flesh than in the peel of TI4001.The grassy, fatty,and malty aromas were stronger in the peel than in the flesh of CI1005 and the fatty, mushroom-like, and grassy aromas were stronger in the flesh than in the peel of TI4001.1.4 Statistical analysis
2 Results and Analysis
2.1 Volatiles of tomato fruits
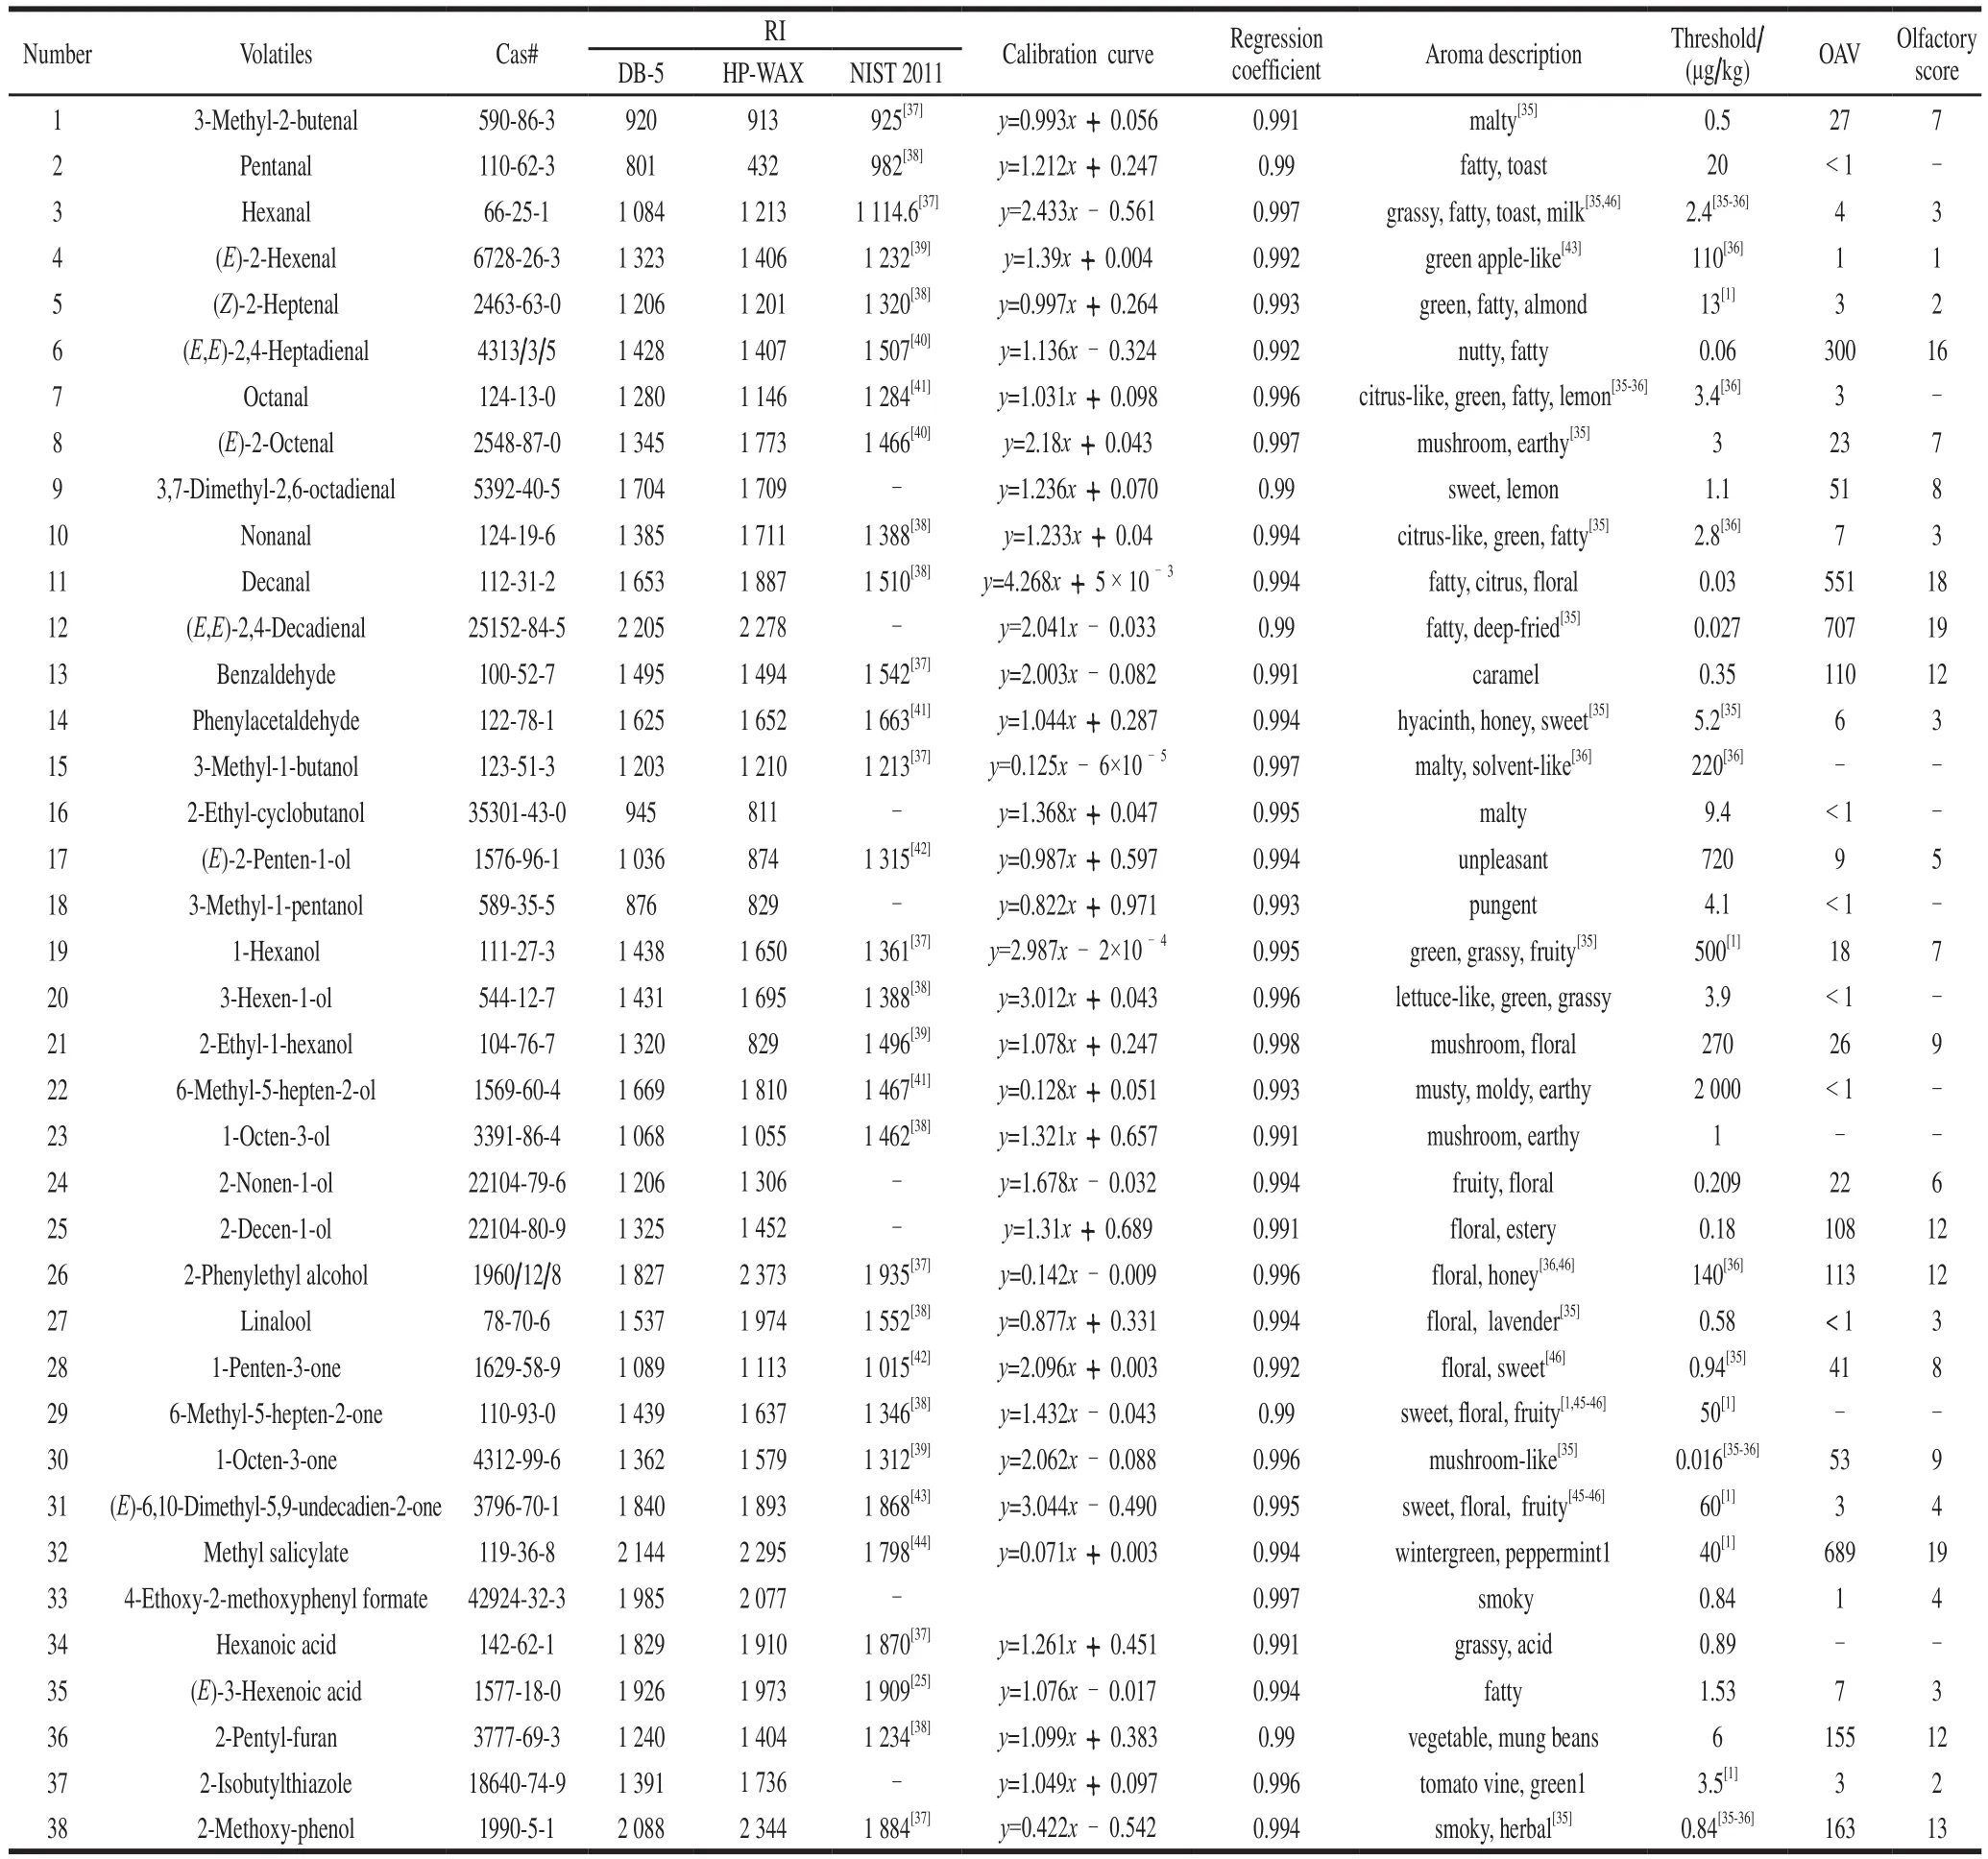
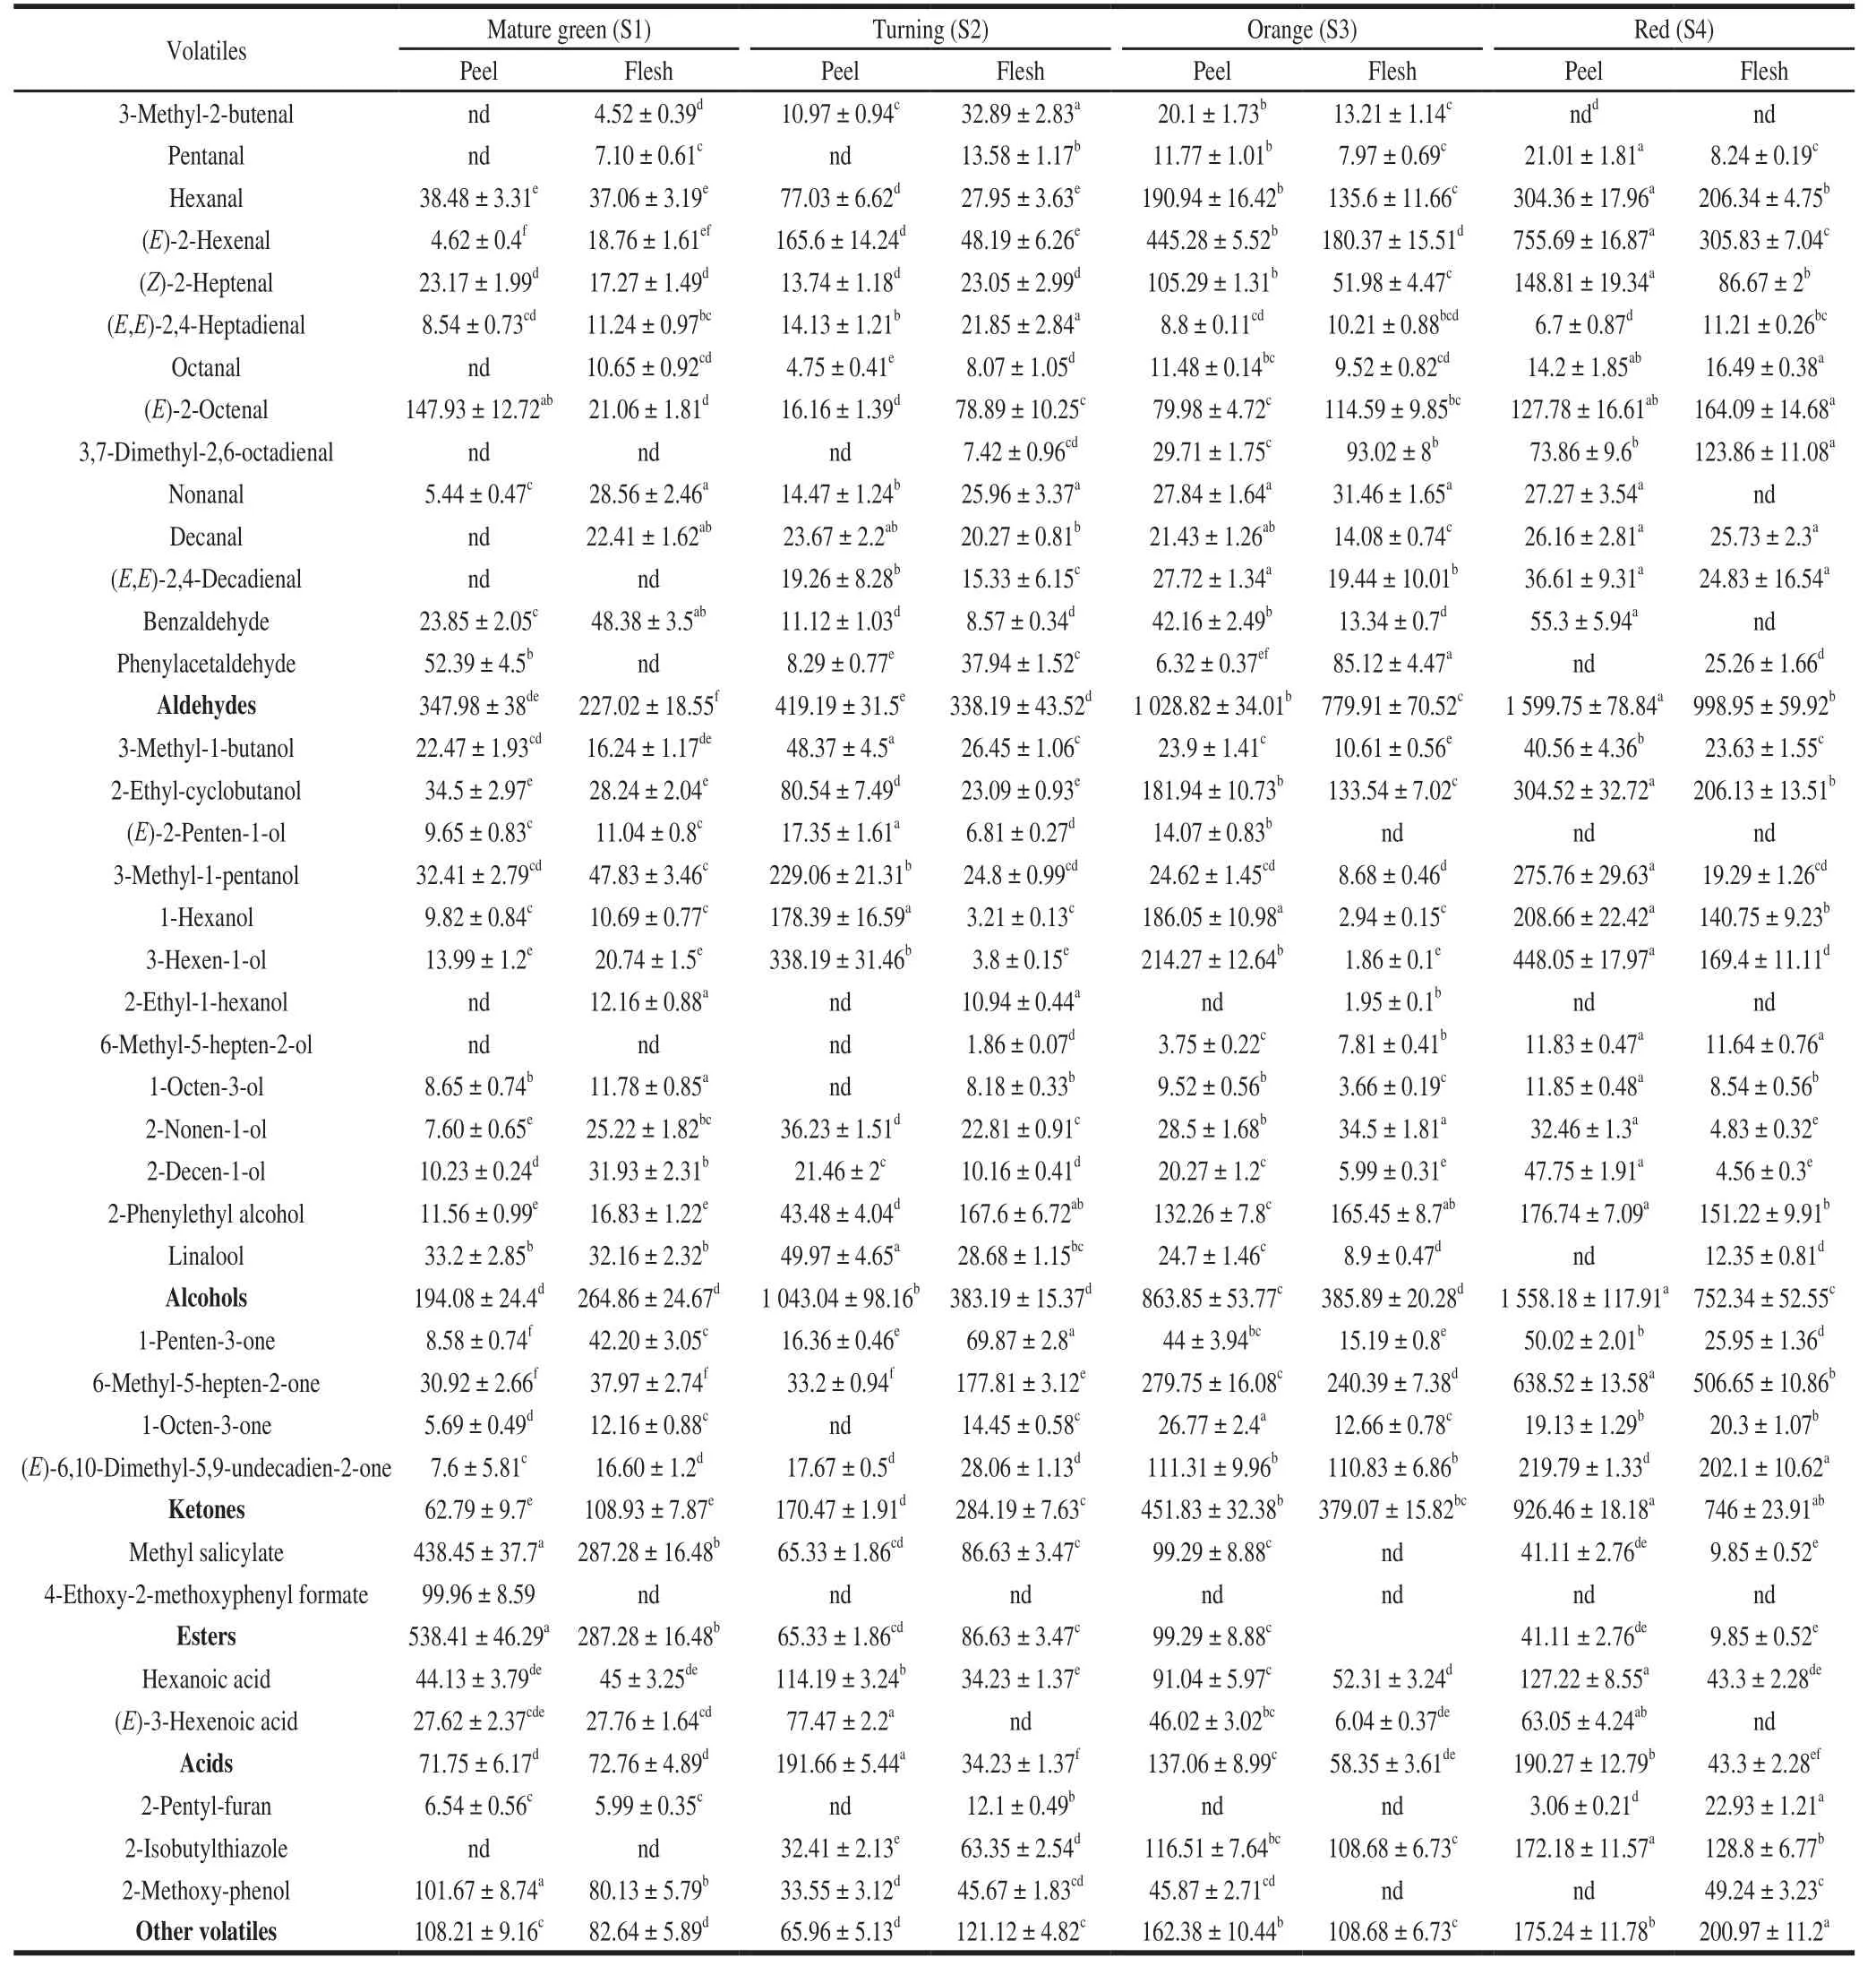
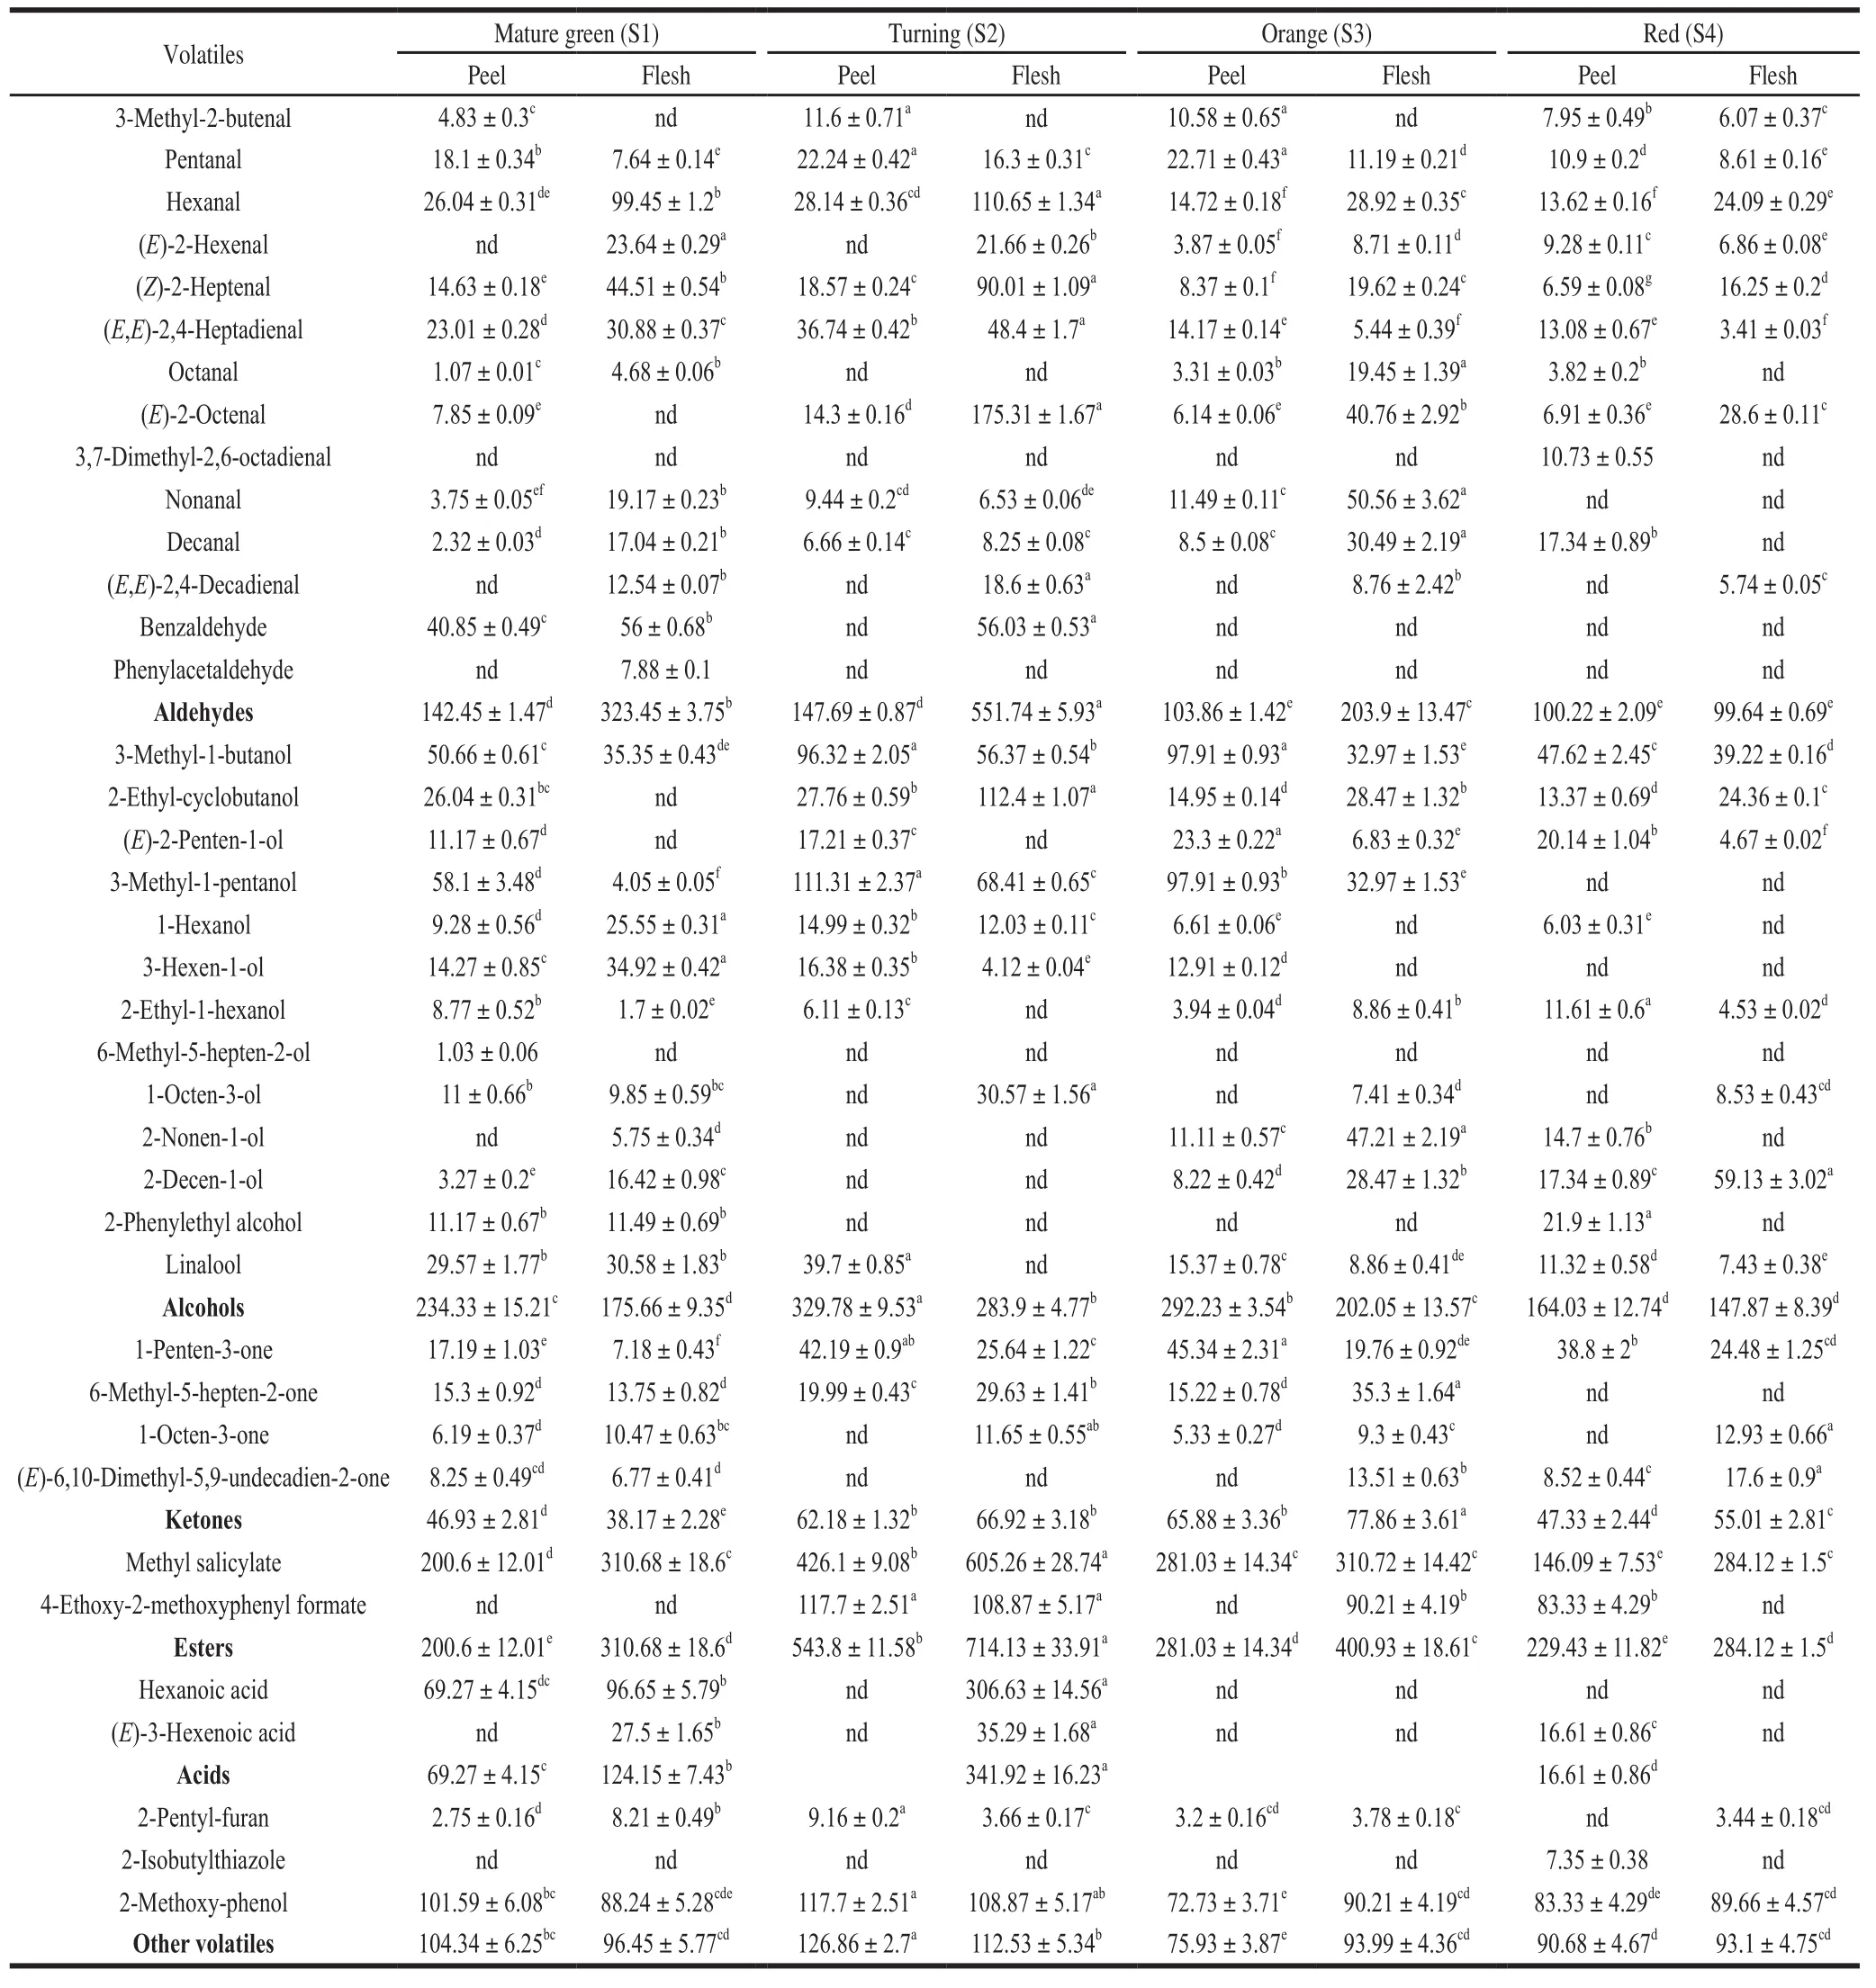
2.2 Evaluation of flavor

2.3 Comparison of two methods of aroma evaluation
3 Discussion
4 Conclusion

