Formation mechanism of Al2O3/MoS2 nanocomposite coating by plasma electrolytic oxidation (PEO)
Babak GHORBANIAN, Mohammad TAJALLY,Seyed Mohammad MOUSAVI KHOIE and Hossein TAVAKOLI
1 Faculty of Materials and Metallurgical Engineering, Semnan University, PO Box 35131-19111,Semnan, Iran
2 Faculty of Mining and Metallurgical Engineering, Amirkabir University of Technology, PO Box 15875-4413 Tehran, Iran
Abstract In this study, an Al2O3/MoS2 nanocomposite coating was created on an aluminum 1050 substrate using the plasma electrolytic oxidation method. The zeta potential measurements showed that small MoS2 particles have negative potential and move toward the anode electrode.The nanoparticles of MoS2 were found to have a zeta potential of ?25 mV, which prevents
Keywords: plasma electrolytic oxidation, corrosion, Al2O3/MoS2 nanocomposite, tribology(Some figures may appear in colour only in the online journal)
1. Introduction
Without a doubt, metals and alloys play a central role in modern industry. Among metals, aluminum is of particular importance for many industries thanks to its properties such as low density,high thermal conductivity,desirable electrical conductivity,and good corrosion resistance.However,beside many advantages,aluminum alloys still have some limitations such as low hardness, bad wear resistance, high friction coefficient, and susceptibility to corrosion [1, 2]. There are various methods for addressing the tribological and surface defects of aluminum, including plasma electrolytic oxidation(PEO), anodic oxidation (MAO), and micro-arc oxidation[1–5]. Among these methods, PEO is a relatively novel method involving the use of anodic oxidation to produce oxidized ceramic layers in electrolytic plasma [6–8].
One of the great features of PEO is its applicability to many types of substrates including aluminum [4], titanium[1], and magnesium [2, 5] and their alloys. This method is also bio-compatible and environmentally friendly. More importantly, the coatings created by this method have desirable properties such as high corrosion resistance, good hardness, high thickness, thermal and electrical insulation,desirable adhesion to the metal substrate, and favorable tribological properties [9, 10]. Another convenient feature of this method is that it can be implemented with DC, AC, and pulsed current. It should be noted that the simplest way to implement PEO is to use DC power [11, 12].
Molybdenum disulfide(MoS2)is a dichalcogenide with a layered(sandwiched)structure[13,14].One of the features of this compound is its lubricating effect, which makes it a typical choice for use as a solid lubricant or as an additive tolubricating oils [15–18]. Research has shown that MoS2microparticles have better wear and tribological behavior than bulk MoS2[19]. Given the structural properties of MoS2(layered and sandwiched structure), MoS2particles synthesized in micro and nano scales can affect the tribological properties of coatings[20–22].Although the effect of particle size on PEO has been extensively researched, there are still many unanswered questions in this regard.Most importantly,the mechanism of the incorporation of particles into the coating is still unclear. For example, Arrabal et al [23, 24]have suggested that in the PEO process, ZrO2nanoparticles are transported to the interface of the porous layer and dense layer through short-circuit paths. In contrast, Lee et al [25]have argued that in the oxidation coating of magnesium, it is the electrophoretic process and mechanical mixing that transfer particles to the coating.Therefore,it is clear that there is still no consensus on the mechanism of the incorporation of particles into PEO coatings.

Table 1. Chemical composition of Al 1050.
2. Experiments
2.1. Metal substrate
The metal used as the substrate was 1050-series aluminum(Al 1050). The chemical composition of the specimens is provided in table 1.
To create specimens, aluminum sheets were cut into 25×20×4 mm3pieces and washed and sanded with successively finer grits of sandpaper up to 1800 grit. After ultrasonic washing with pure ethanol,the pieces were washed again with distilled water and then air dried.
2.2. Preparation of the electrolyte
For the PEO process,three salt compounds including sodium aluminate (NaAlO2), potassium hydroxide (KOH), and sodium pyrophosphate (Na4P2O7) were used. First, the amount of salt needed for creating 2 l of the solution was dissolved in 1 l of distilled water. Since research has shown that using more than 4 g l?1of MoS2in the electrolyte solution will result in a coating with better wear and corrosion resistance[26],the decision was made to use 5 g l?1of MoS2
[27].For this purpose,10 g of MoS2was mixed with 50 ml of distilled water and the mixture was stirred with a magnetic stirrer for 2 h to ensure sufficient particle suspension. The solution was then placed in a Scientz-IID ultrasonic homogenizer for 10 min to prevent agglomeration. Next,the MoS2solution was added to the solution containing salts. Finally,the obtained solution was brought to a volume of 2 l with distilled water.
2.3. PEO process
The PEO process was performed for 10 min using a 30 kW DC power supply. The cell used for the process was a polymer tank consisting of a cooling system, a stainless steel 316 mesh as the auxiliary electrode, and a stainless steel 316 rod as the specimen holder. To ensure that the holder was attached to the specimen itself, a hole of 3 mm in diameter and 1.5 mm in height was made in the specimen and the holder was inserted into that hole.To prevent contact between the electrolyte and the holder,the holder was insulated with a polymer cover.
2.4. Process modes
The PEO process was performed in two modes. In the first mode(S1),the voltage was applied immediately after placing the specimen inside the electrolyte. In the second mode (S2),the specimen was left suspended in the solution for 5 min before applying the voltage.Note that during the process,the particles were suspended in the solution. The conditions of the process are described in table 2.
2.5. Characterization
2.5.1. XRD test. An XRD test was used to study the phases present in the created coating.This test was performed using a Rigaku D/Max-2400 diffractometer with Cu-Kα radiation
(k=1.5418 ?) at 40 kV and 100 kA.
2.5.2. Morphological examination. The morphology of the coating was examined using a Mira 3-XMU field emission scanning electron microscope with an acceleration voltage of 30 kV.
2.5.3. Zeta potential. The zeta potential of the MoS2was measured and analyzed using a Zetasizer Nanosystem (Nano ZS, Malvern Instruments).
2.5.4. Electrochemical tests. The electrochemical behavior of the coated specimens was examined with the help of electrochemical impedance spectroscopy (EIS) and polarization tests.These tests were performed in 3.5%NaCl electrolyte after 30 min of immersion.
EIS measurements were performed at an open circuit potential (OCP) using a computer-controlled PAR EG&G 273A potentiostat with a 1025 frequency response detector.In a conventional three-electrode assembly,a Pt foil was used as the auxiliary electrode and a saturated calomel electrode was used as the reference electrode. The AC frequency was increased from 100 kHz to 10 MHz with an amplitude of 10 mV around the OCP. A Tafel polarization test was performed by the same equipment used in the impedance measurements(without the frequency response detector).This test was carried out in the range of ±300 mV relative to the OCP at a scanning rate of 1 mV s?1.The potentiostat used in this test was an Origa Flex OGF500.

Table 2. Specifications of the coating process and the electrolyte.
2.5.5. Mechanical and tribological properties. The microhardness of the coatings was measured with a Kopa 1UV device by applying a force of 0.1 N for 10 s. To reduce test errors,this test was performed three times for each specimen,and the results were averaged.
A wear test was carried out by a pin-on-disk testing machine with standard steel (SAE52100) pins of 50 mm in length and 4 mm in diameter.In this test,the vertical load was 10 N, the linear pin speed was 0.1 m s?1, and the sliding distance was 200 m.
In this equation,ρis the density (g cm?3),Δmis the change in the specimen weight (mg), F is the applied force(N),l is the sliding distance(m),and Wris the wear rate of the specimen (mm3/N·m). The wear rate of the specimens according to the above equation is reported in table 3.
In table 3, it can be seen that the specimen made with MoS2has a lower wear rate than specimen S0,which suggests an improvement in the tribological behavior because of the addition of MoS2. This effect can be attributed to the selflubricating property of MoS2particles, which reduces the friction coefficient and ultimately leads to a reduced wear rate.
3. Discussion and results
3.1. Mechanical and tribological properties
Figure 1 shows the results of the wear test of specimens S0,S1,and S2.In figure 1(b),it can be clearly seen that specimen S1 has a lower friction coefficient than the other specimens.There are also many variations in the friction coefficient of specimen S1 (compared to specimens S0 and S2). In some parts of the curve plotted for specimen S1, there are sharp jumps in the friction coefficient,which can be attributed to the presence of porous external layers. Therefore, for this specimen,the friction coefficient was considered to be equal to the average of the measured values. The tribological properties,thickness, and hardness of the coating are given in table 3.This table shows that the addition of MoS2particles led to a reduced hardness and friction coefficient, which can be attributed to the low hardness of MoS2.As shown in figure 1,specimen S2 has a higher friction coefficient than specimen S1.In the coating process,the laminar structure(high surface area and surface energy) of MoS2particles allows them to adhere to the specimen surface and limit the growth of the oxide layer [25]. According to table 3, the addition of MoS2particles also reduced the coating thickness (thickness of the oxide layer). Similar results regarding the effect of MoS2particles on coating thickness have been reported by Mu et al[28]. To explain this effect, it can be argued that MoS2particles increase the coating density and decrease its thickness by filling the micropores appearing in this layer [29].
The wear rate of the coated specimens was determined using equation (1):

3.2. XRD analysis
Figure 2 shows the XRD patterns of the Al2O3/MoS2composite. As shown in this figure, the coatings contain the phases α-Al2O3, γ-Al2O3, and MoS2. It can be seen that the peak of MoS2at 2θ=14.33 in specimen S1 is wider than the same peak in specimen S2,which suggests that the MoS2particles in specimen S1 are smaller than those in specimen S2. The size of the MoS2particles was calculated using the Debye–Scherrer equation [30]:

where D is the particle size(nm),k is a constant(0.9),λ is the wavelength (5406.1 ?), β is the peak width at half the peak height(mm),and θ is the diffraction angle for the specimens.Using equation (2), the size of the MoS2particles in the coatings was calculated to approximately 30 nm for specimen S1 and 180 nm specimen for S2.
3.3. Zeta potential
When a particle suspended inside a fluid has a surface charge,it creates a higher concentration of oppositely charged ions in its vicinity, which itself creates another layer of ions around the particle [31]:
? In the inner layer,also called the Stern layer,the ions are highly restricted in movement and are densely packed together [32].
? In the outer layer, the ions are somewhat looser and can move around [33].
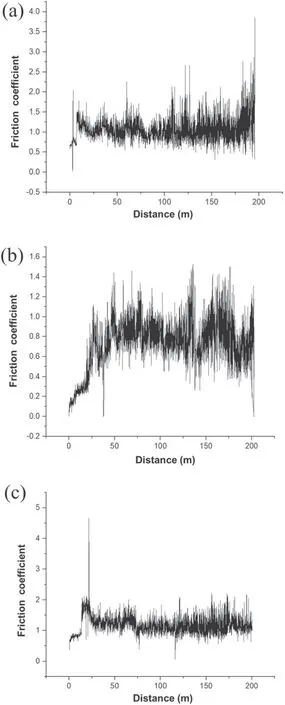
Figure 1. Tribological behavior of the specimens: (a) S0, (b) S1, and (c) S2.
As a particle moves within the fluid, the inner and outer layers around it also move with the particle. Therefore, one can assume a hypothetical distance between the particle and the fluid medium (thickness of the two layers around the particle). This distance is called the hydrodynamic distance,and the potential in this distance is known as the zeta potential [34].
When all particles in a suspension are negatively or positively charged, they tend to repel each other and avoid coalescence. The tendency of similarly charged particles to repel each other is directly linked to the zeta potential[35].In general, the stability or instability of a suspension can be determined according to the zeta potential. Particles whose zeta potential is greater than 30 mV or below 30 mV are stable and remain suspended in a solution [36].
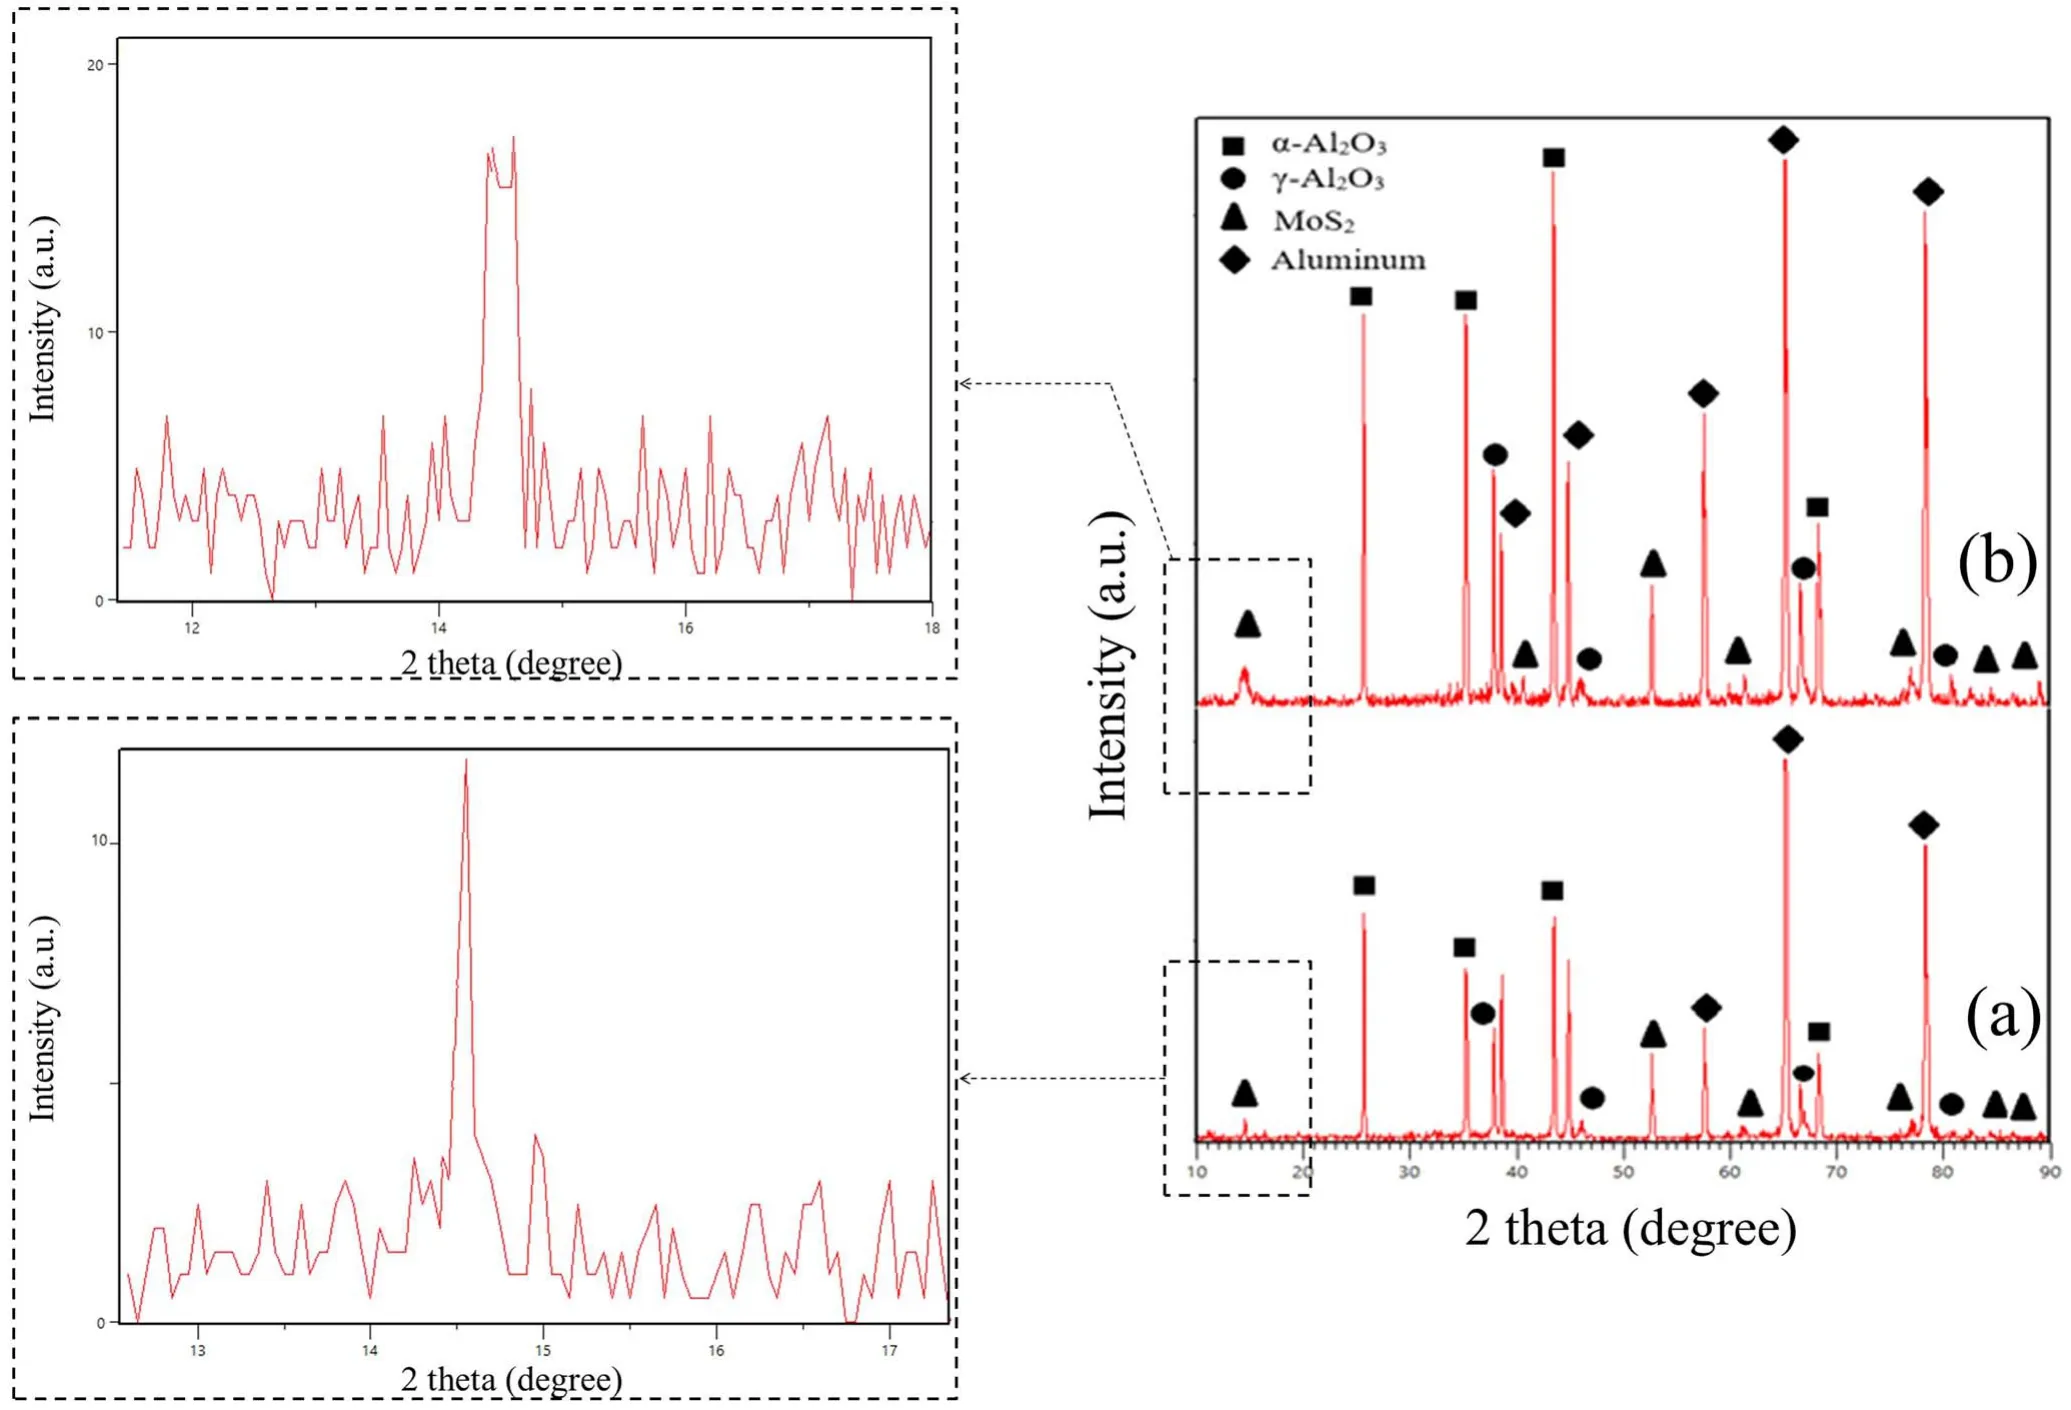
Figure 2. Results of the XRD test: (a) S1 and (b) S2.

Table 3. Mechanical and tribological properties of the specimens.
The most important determinant of the zeta potential is pH [32]. In fact, it is quite meaningless to determine the zeta potential without considering the pH[37].For example,for a suspension of particles with a negative zeta potential,increasing the pH (making the suspension more alkaline)reduces the tendency of the particles to undergo coalescence,which results in the zeta potential becoming more negative
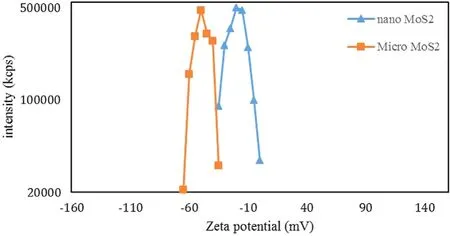
Figure 3.Variations of the zeta potential for micro-sized and nanosized MoS2 particles.
[28].In the case of this study,for the composite to be formed,MoS2particles had to move to the positive (anode) pole,which means that the particles had to have a negative potential. In this study, the pH of the solution was about 12.As shown in figure 3, at this pH, the zeta potential for MoS2nanoparticles is about ?25 mV, but for MoS2microparticles,it is about ?50 mV. Since the zeta potential of MoS2nanoparticles is in the range of ?30 to 30 mV,they cannot become suspended in the solution [38]. But MoS2microparticles,which have a zeta potential of less than ?30 mV,can become suspended and move to the anode. This suggests that MoS2microparticles are a better choice for the synthesis of an Al2O3/MoS2coating. To prove this, we created and tested specimens S1 and S2.The surface coating of these specimens was similar to that of specimen S0 and had no trace of nanoparticles. Therefore, the rest of the examinations were performed on specimens S1 and S2.
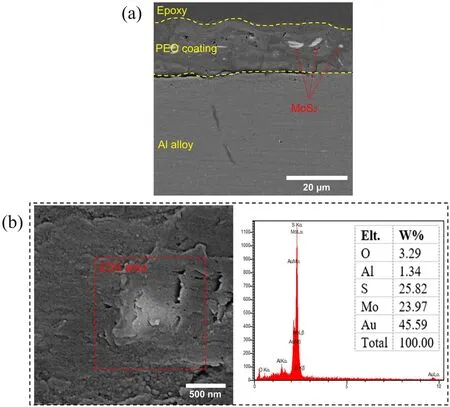
Figure 4. (a) Cross-sectional and (b) surface morphology with the corresponding EDS analysis for specimen S1.
3.4. Coating morphology
The effect of MoS2particles on the cross-section of specimen S1 is displayed in figure 4(a). As this figure shows, the thickness of specimen S1 is 18±1 μm. The scanning electron microscopy (SEM) morphology and the results of the EDS analysis for the same specimen are shown in figure 4(b).The bright-colored particles in this figure consisted of 23.97 wt% Mo and 25.82 wt% S. According to the results of the EDS analysis, it can be concluded that these brightcolored particles are indeed MoS2(these results also showed traces of gold, which must be attributed to the gold coating done before SEM).
Figure 5 shows the EDX mapping of the cross-section of the coating formed on specimen S1 after 600 s of the PEO process. The coating thickness was measured from microscopic images taken from the cross-section. These results show that the formed coatings consist of two separate zones with a channel passing through both. Moreover, discharge channels are shown in the coating. Research has shown that these channels form at the beginning of the procedure because of the aluminum anodizing process [39].The EDS map illustrates the distribution of MoS2particles in the coating.
Figure 6(a) shows the cross-sectional area of specimen S2. As shown in this figure, this coating consists of two layers: an outer layer which is porous and comprises about 65% of the coating, and an inner layer which is compact and comprises 35% of the coating. The bright-colored particles shown in figure 6(b)are MoS2, which as can be seen, appear in the inner layer[40].The presence of MoS2particles in the inner layer of specimen S2 has given it a friction coefficient exceeding that of specimen S1. According to figure 6, the coating thickness varies from 10–20 μm. It has been shown that the thickness of the inner layer decreases compared with specimen S1 (figure 5(a)). Further, the coating shown in figure 6 does not exhibit a steady bonding with the substrate,which can be attributed to the corrosion of the specimen surface and poor specimen preparation [39, 40].
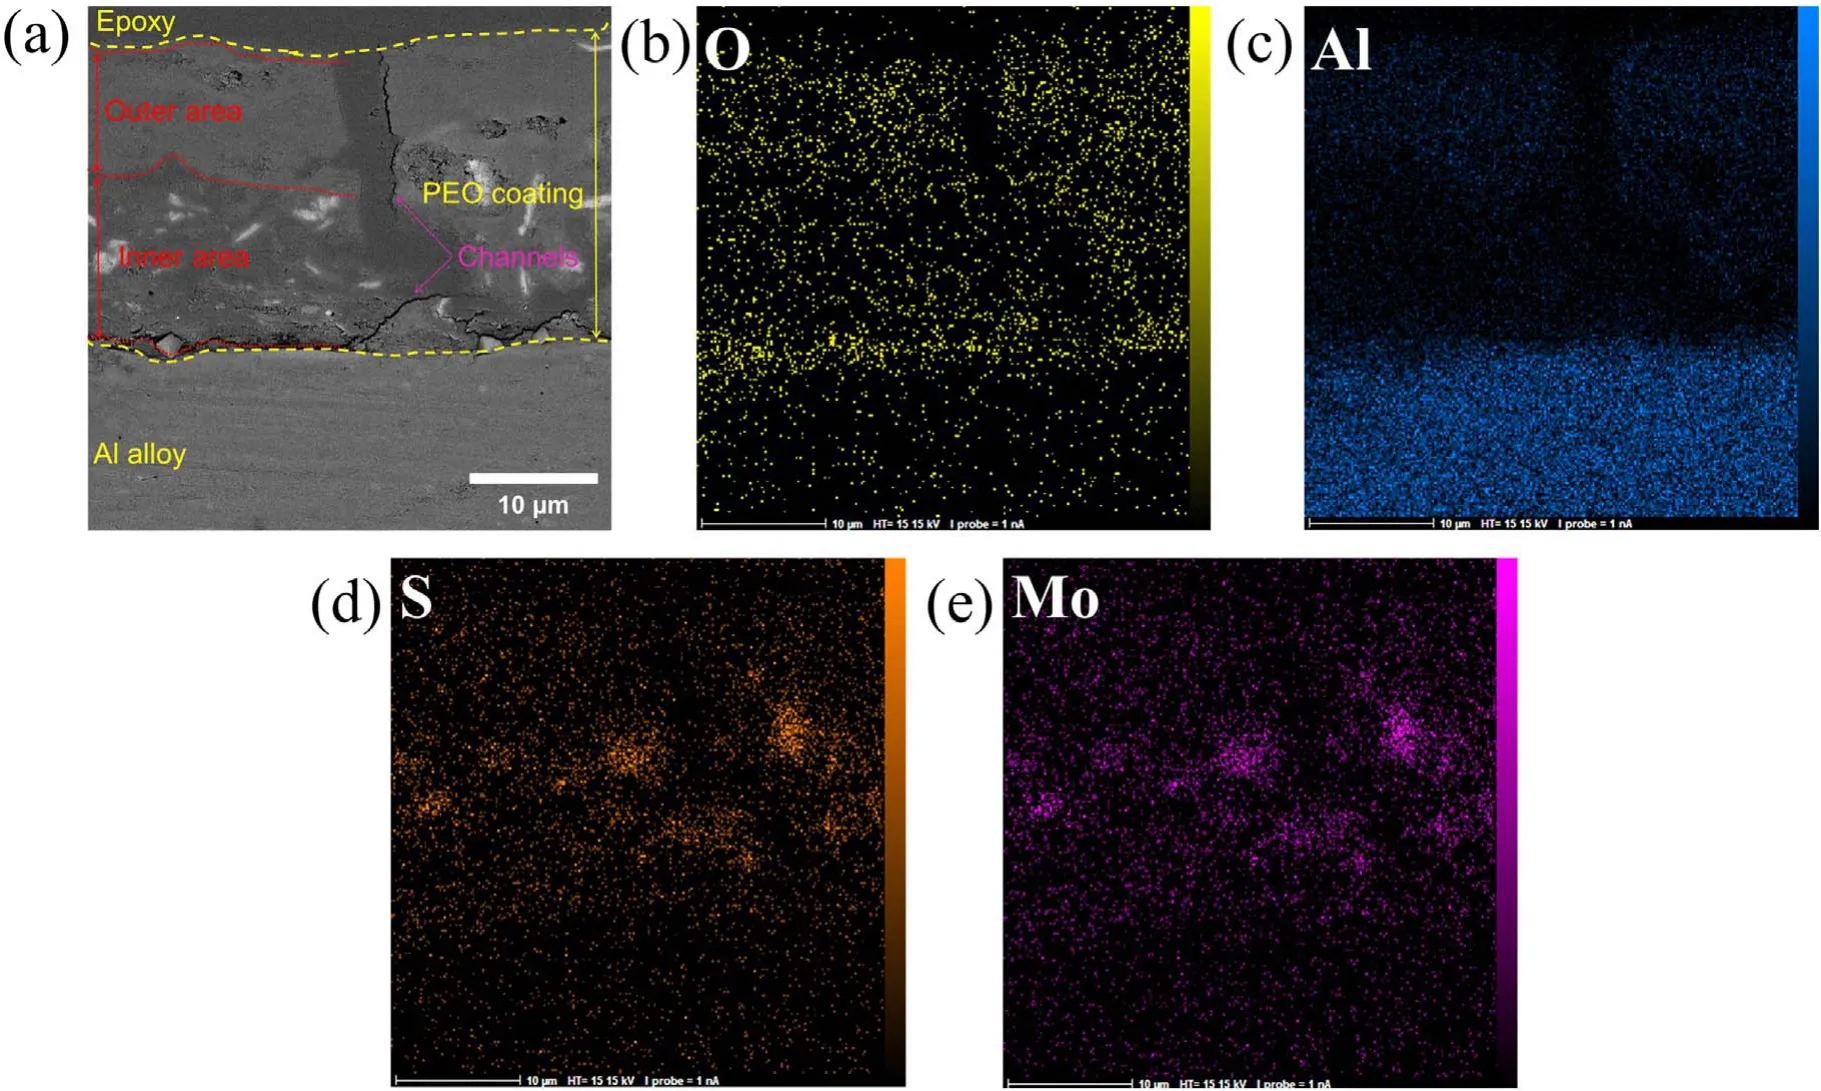
Figure 5.EDS map of the cross-section of specimen S1 after 600 s of the PEO process:(a)cross-section,(b)oxygen map,(c)aluminum map,(d) sulfur map, (e) molybdenum map.
Figure 7 displays the EDX mapping of the cross-section of the layer formed on specimen S2 after 600 s of the coating process.The thickness of this coating also varies from 10–20 μm.According to these EDX mapping results,the bright-colored dots in the microscopic images of specimen S2 are MoS2.
The above figures are magnified in figure 8 for better clarity. Figure 8 demonstrates the presence of MoS2nanoparticles, which suggests that with prolonged suspension in the electrolyte, MoS2microparticles are replaced with their nano-sized counterparts, leading to the formation of an Al2O3/MoS2nanocomposite.
3.5. Nanocomposite formation mechanism
This section hypothesizes a mechanism for the formation of nanocomposite coatings in the PEO process.This hypothesis is based on the studies of Yorokhin et al [39]. A schematic diagram of this hypothesis is illustrated in figure 9. In this hypothesis, the PEO process consists of four stages. In the first stage, in which the system follows Faraday’s law, an oxide film is formed on the surface of the specimen.According to Liu et al[41],after 1 h,the contact angle of the water and MoS2increases from 68.3–70.5,and consequently the surface energy between them decreases. Meanwhile, the contact angle between the water and alumina without MoS2is 68.5 and reduces to 45.8 after adding MoS2. Hence,according to the findings of Liu et al,MoS2particles deposit on the surface of alumina.In the second stage,as the voltage increases, a porous film of oxide begins to grow on the surface. In the third stage, small luminescence sparks move rapidly across the surface of the oxide film, invigorating its growth. According to Dunleavy et al [42], two of these sparks occur every millisecond and each spark releases more than 9 eV of energy. Therefore, at the beginning of the process, there is a large amount of energy which can crush the particles at the specimen surface. Hence, in this stage,MoS2particles are broken down into smaller (nano) particles, which ultimate pour into the bottom of the created channels. Finally, in the fourth stage, thermal ionization processes strengthen the oxidation mechanism due to ionic reactions between oxygen and aluminum, thus intensifying the oxidization of metal surface and accelerating the growth of the oxide layer [39]. Therefore, according to the mechanism proposed by Yorokhin et al [39] and Liu et al [41],first, the MoS2particles adhere to the thin alumina layer at the specimen surface (figure 9(a)). Then, as the coating progresses at low voltage, aluminum anodizing channels appear(figure 9(b)).Next,the energy released by the sparks break the MoS2particles in their vicinity and the resulting particles pour into the bottom of the channels (figure 9(c)).Finally,the nanocomposite is formed with the growth of the oxide layer (figure 9(d)). Note that MoS2nanoparticles are in the nanocomposite created in the interface of the layer with the metal.
3.6. Electrochemical tests
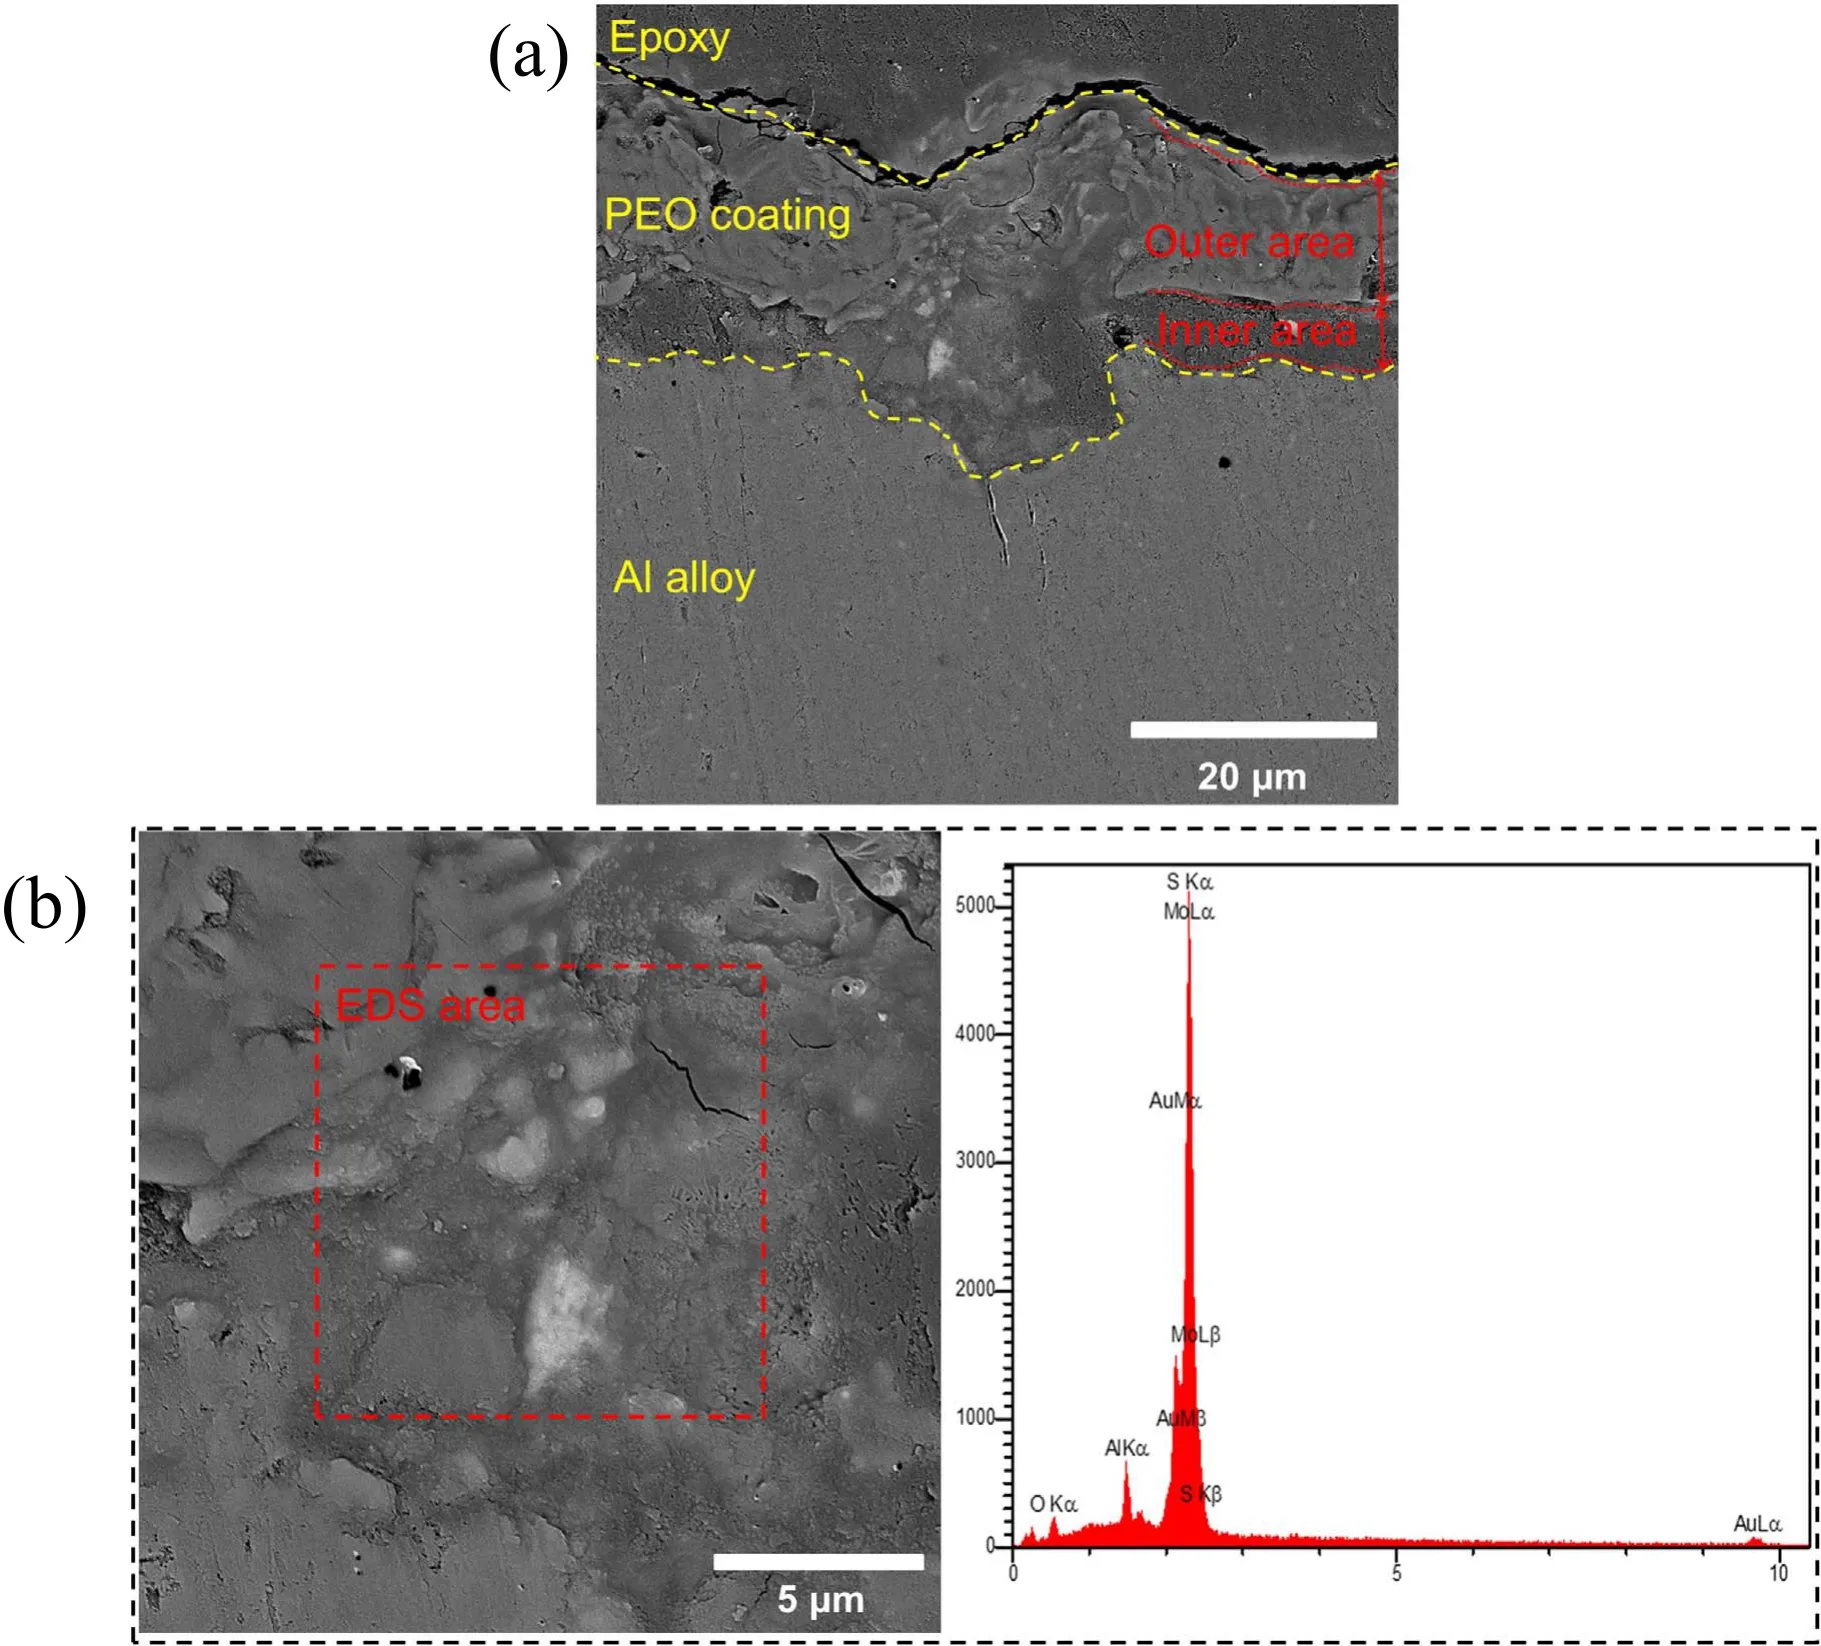
Figure 6. (a) Cross-sectional and (b) surface morphology with the corresponding EDS analysis for specimen S2.
The results obtained from the polarization test are provided in table 4 and figure 10. As shown in figure 10, applying the coating changed the anodic and cathodic branches of the polarization diagrams. According to table 4, the coating decreased the corrosion current density (icorr), which means that it has reduced the corrosion rate of the specimens [43].The results also show that the corrosion current density of specimen S1 is lower than that of specimen S0, which indicates that the addition of MoS2particles to the electrolyte reduced the corrosion rate. It can also be seen that specimen S2 has a better corrosion current density than specimen S1,which suggests that MoS2particles have filled the pores of the coating layer, thus preventing the invasion of Cl?ions and ultimately improving the electrochemical performance of the specimen against the electrolyte [44]. According to table 5,after the coating process, the corrosion potential of the specimens (Ecorr) has shifted toward more positive values. This indicates that coating has affected the thermodynamics of the corrosion reactions,as research has shown that more positive corrosion potential makes corrosion reactions less thermodynamically viable [45].
The results of the EIS test are presented in figure 11. By considering the diameter of the semi-circles shown in figure 11(a), the coated samples exhibited a greater radius of the capacitive loop, indicating that they provided higher protective efficiency as compared with the uncoated aluminum alloy[44].Moreover,it can be seen that specimen S2 has a larger semi-circle diameter than both specimens S1 and S0,which signifies better corrosion performance. The same conclusion can also be made from the Bode plot of the EIS test, which is presented in figure 11(b). In this figure, specimen S2 has a higher polarization resistance than specimens S1 and S0, which again indicates better performance in this respect [46–48]. The polarization tests also confirm these conclusions. To study the electrochemical behavior of this system, we used the equivalent circuit of figure 11(c), which was created using the ZView software.
Table 5 shows the kinetic data of the EIS test. In this table,it can be seen that the capacitance formed in the circuit shown in figure 11 for specimens S2 and S1 is lower than that for specimen S0,which means that these two specimens have a better performance [49]. Further, the capacitance of specimen S2 is lower than that of specimen S1, which means that specimen S2 outperforms specimen S1 in this respect. As shown in table 5, specimen S2 has a better charge transfer resistance than both specimens S1 and S0, and specimen S1 has a better charge transfer resistance than specimen S0.These results show that specimen S2 has a more favorable electrochemical behavior than the other specimens, in accordance with the results of potentiodynamic polarization tests. This superior performance of specimen S2 (composited with MoS2) over specimen S1 (without MoS2) can be attributed to the smoothness of the coating surface because of MoS2particles filling the pores. By filling the pores of the passive oxide layer, MoS2particles reduce the high energy points that are susceptible to corrosion and enhance the cohesion of the passive film, which ultimately results in a reduced rate of corrosion [50].
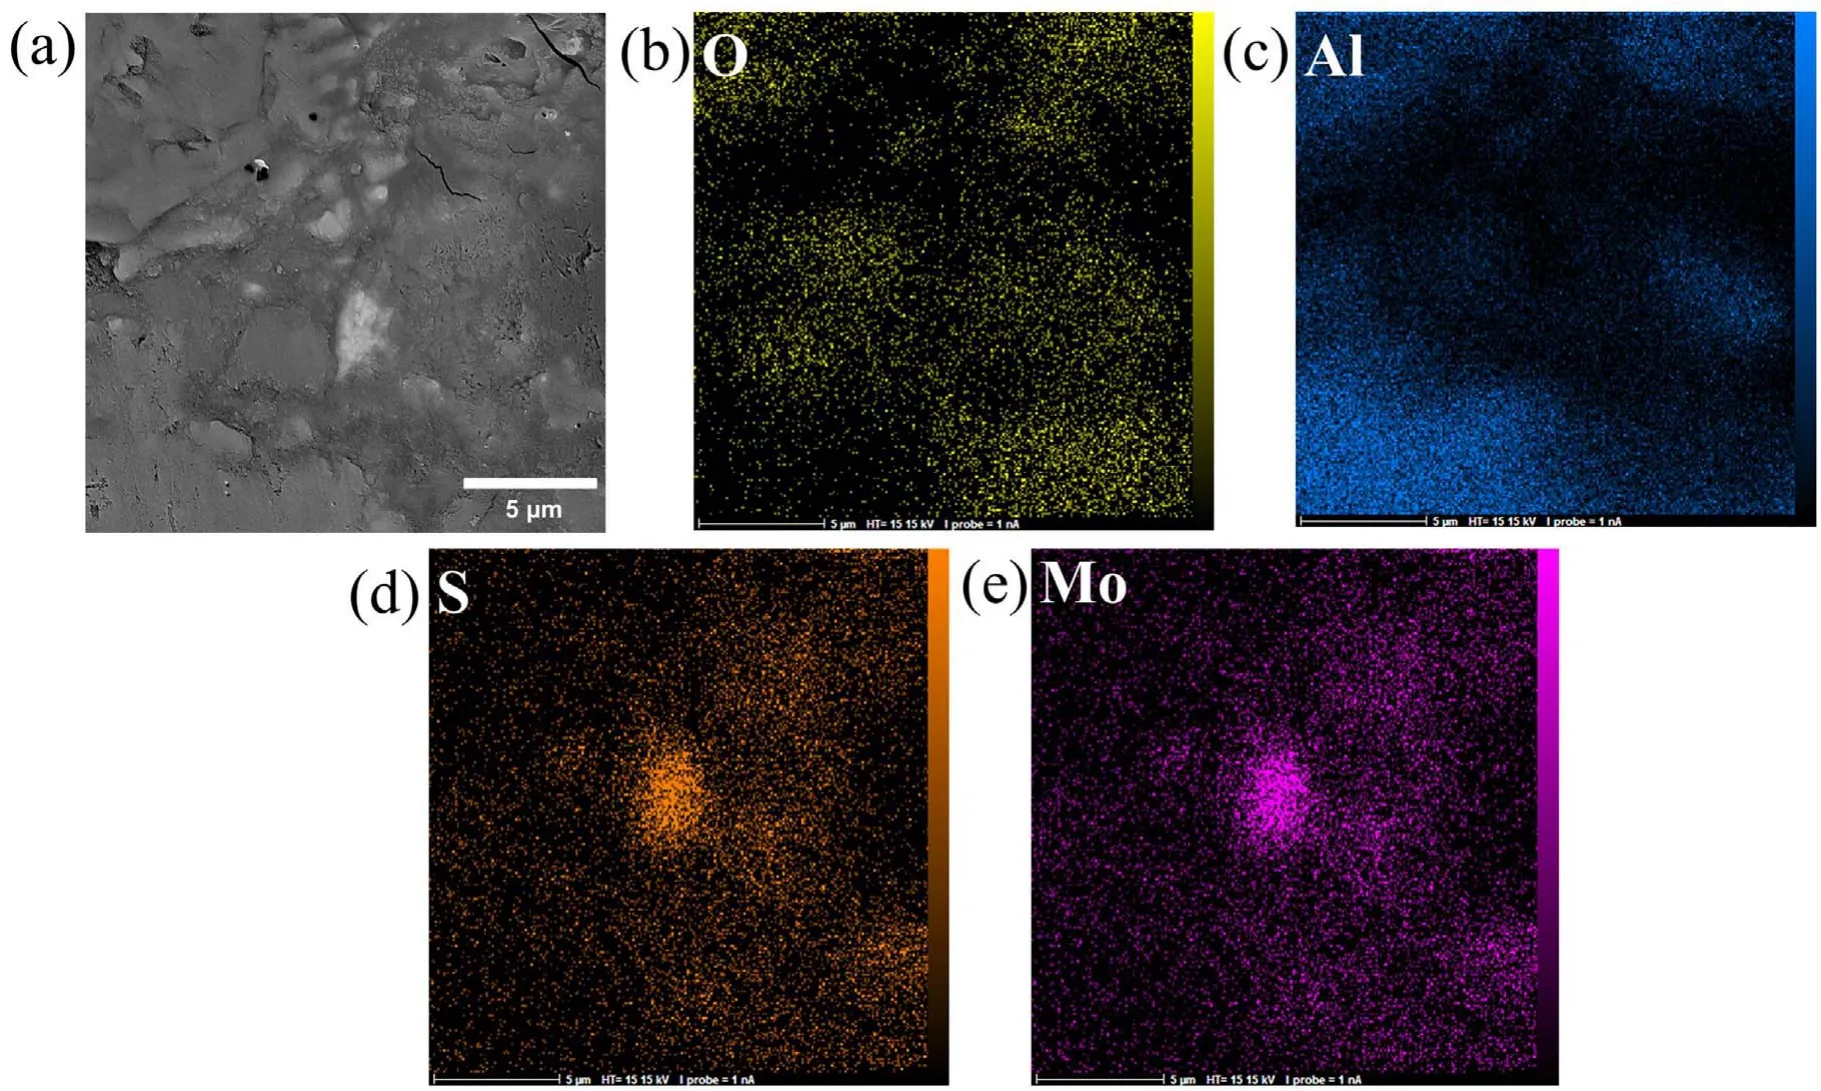
Figure 7.EDS map of the cross-section of specimen S2 after 600 s of the PEO process:(a)cross-section,(b)oxygen map,(c)aluminum map,(d) sulfur map, (e) molybdenum map.
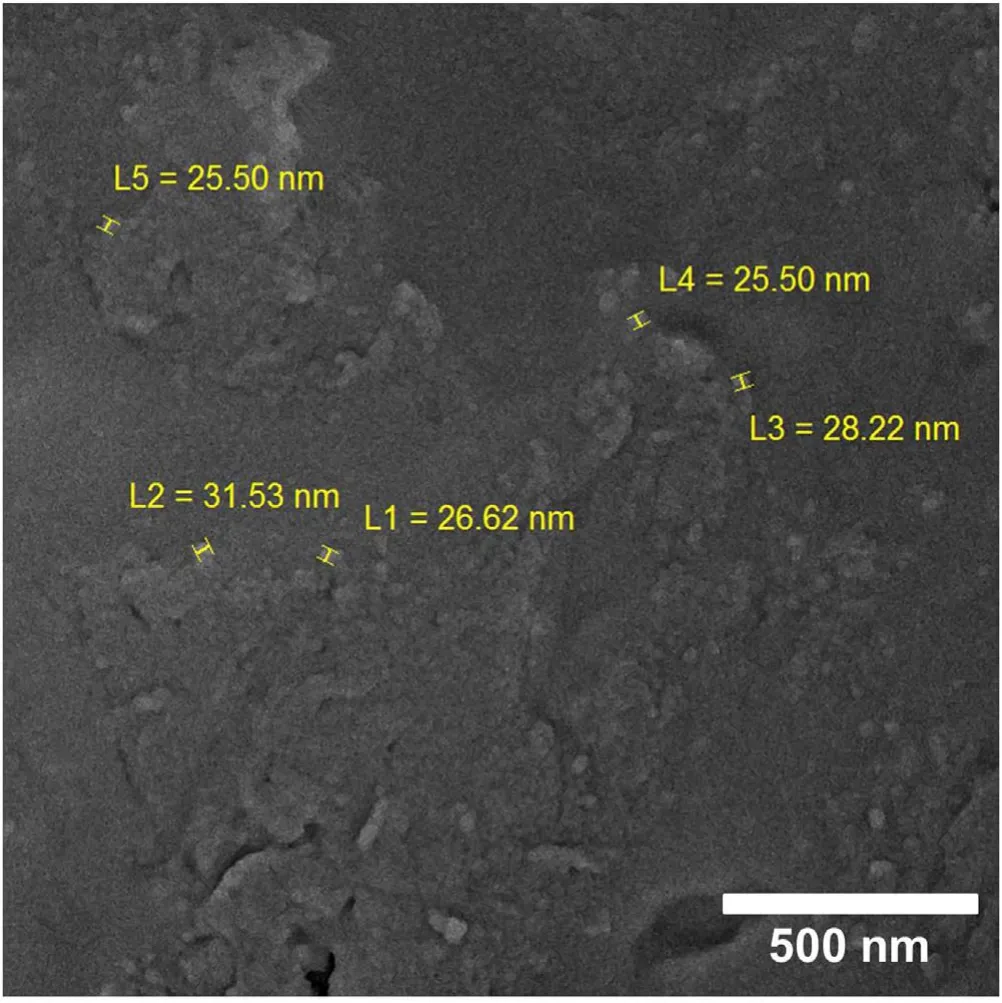
Figure 8. Magnified microscopic image of MoS2 particles.

Table 4.Results obtained from the polarization test in 3.5 wt%NaCl electrolyte.
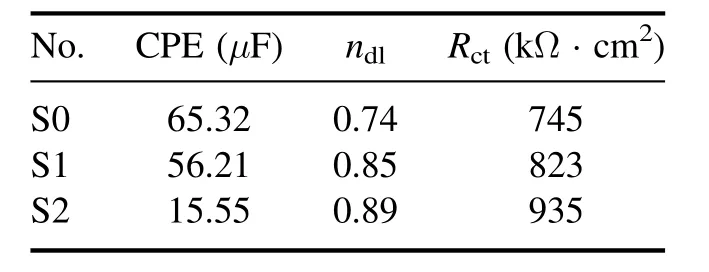
Table 5. Kinetic data obtained from the EIS test.
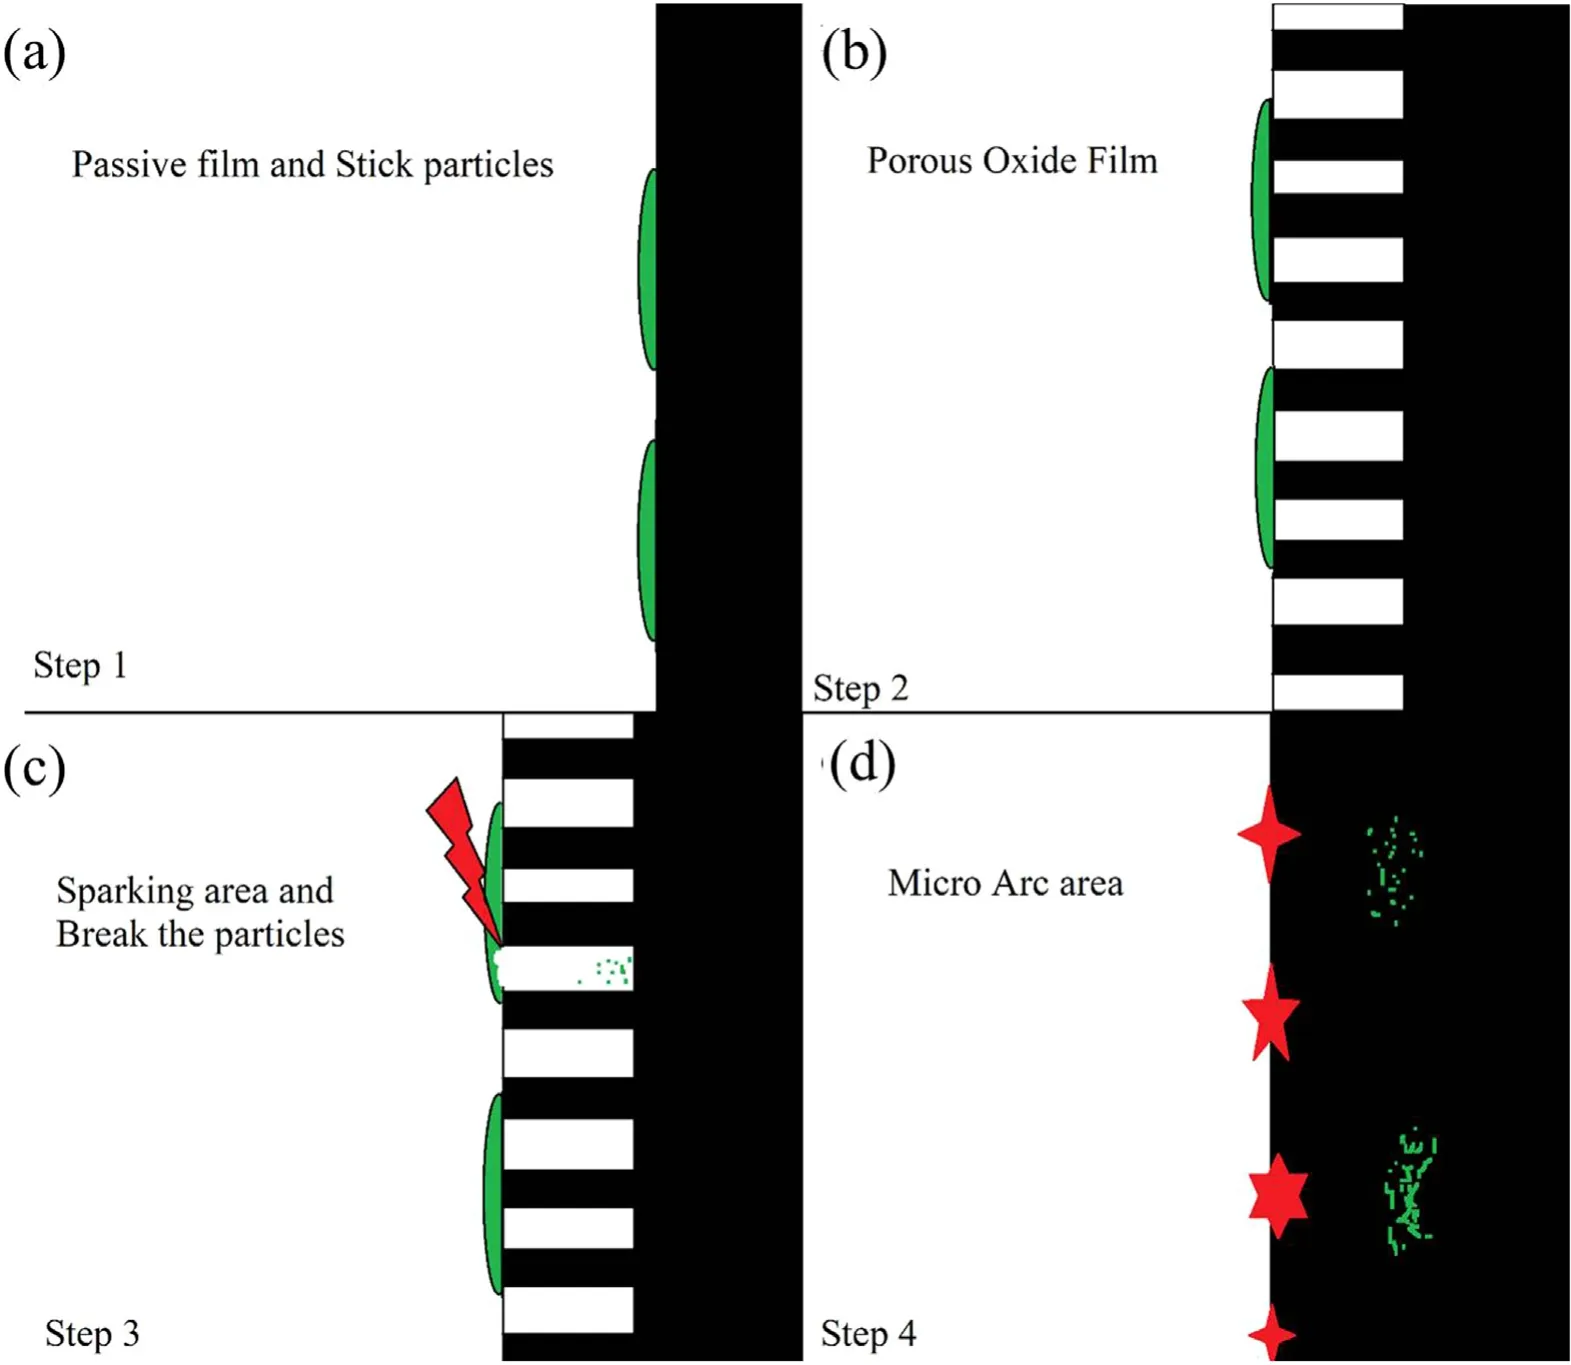
Figure 9.Schematic diagram of the production of the MoS2/Al2O3 nanocomposite.
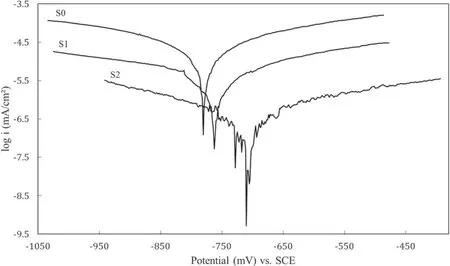
Figure 10.Results of the polarization test in 3.5 wt% NaCl electrolyte.
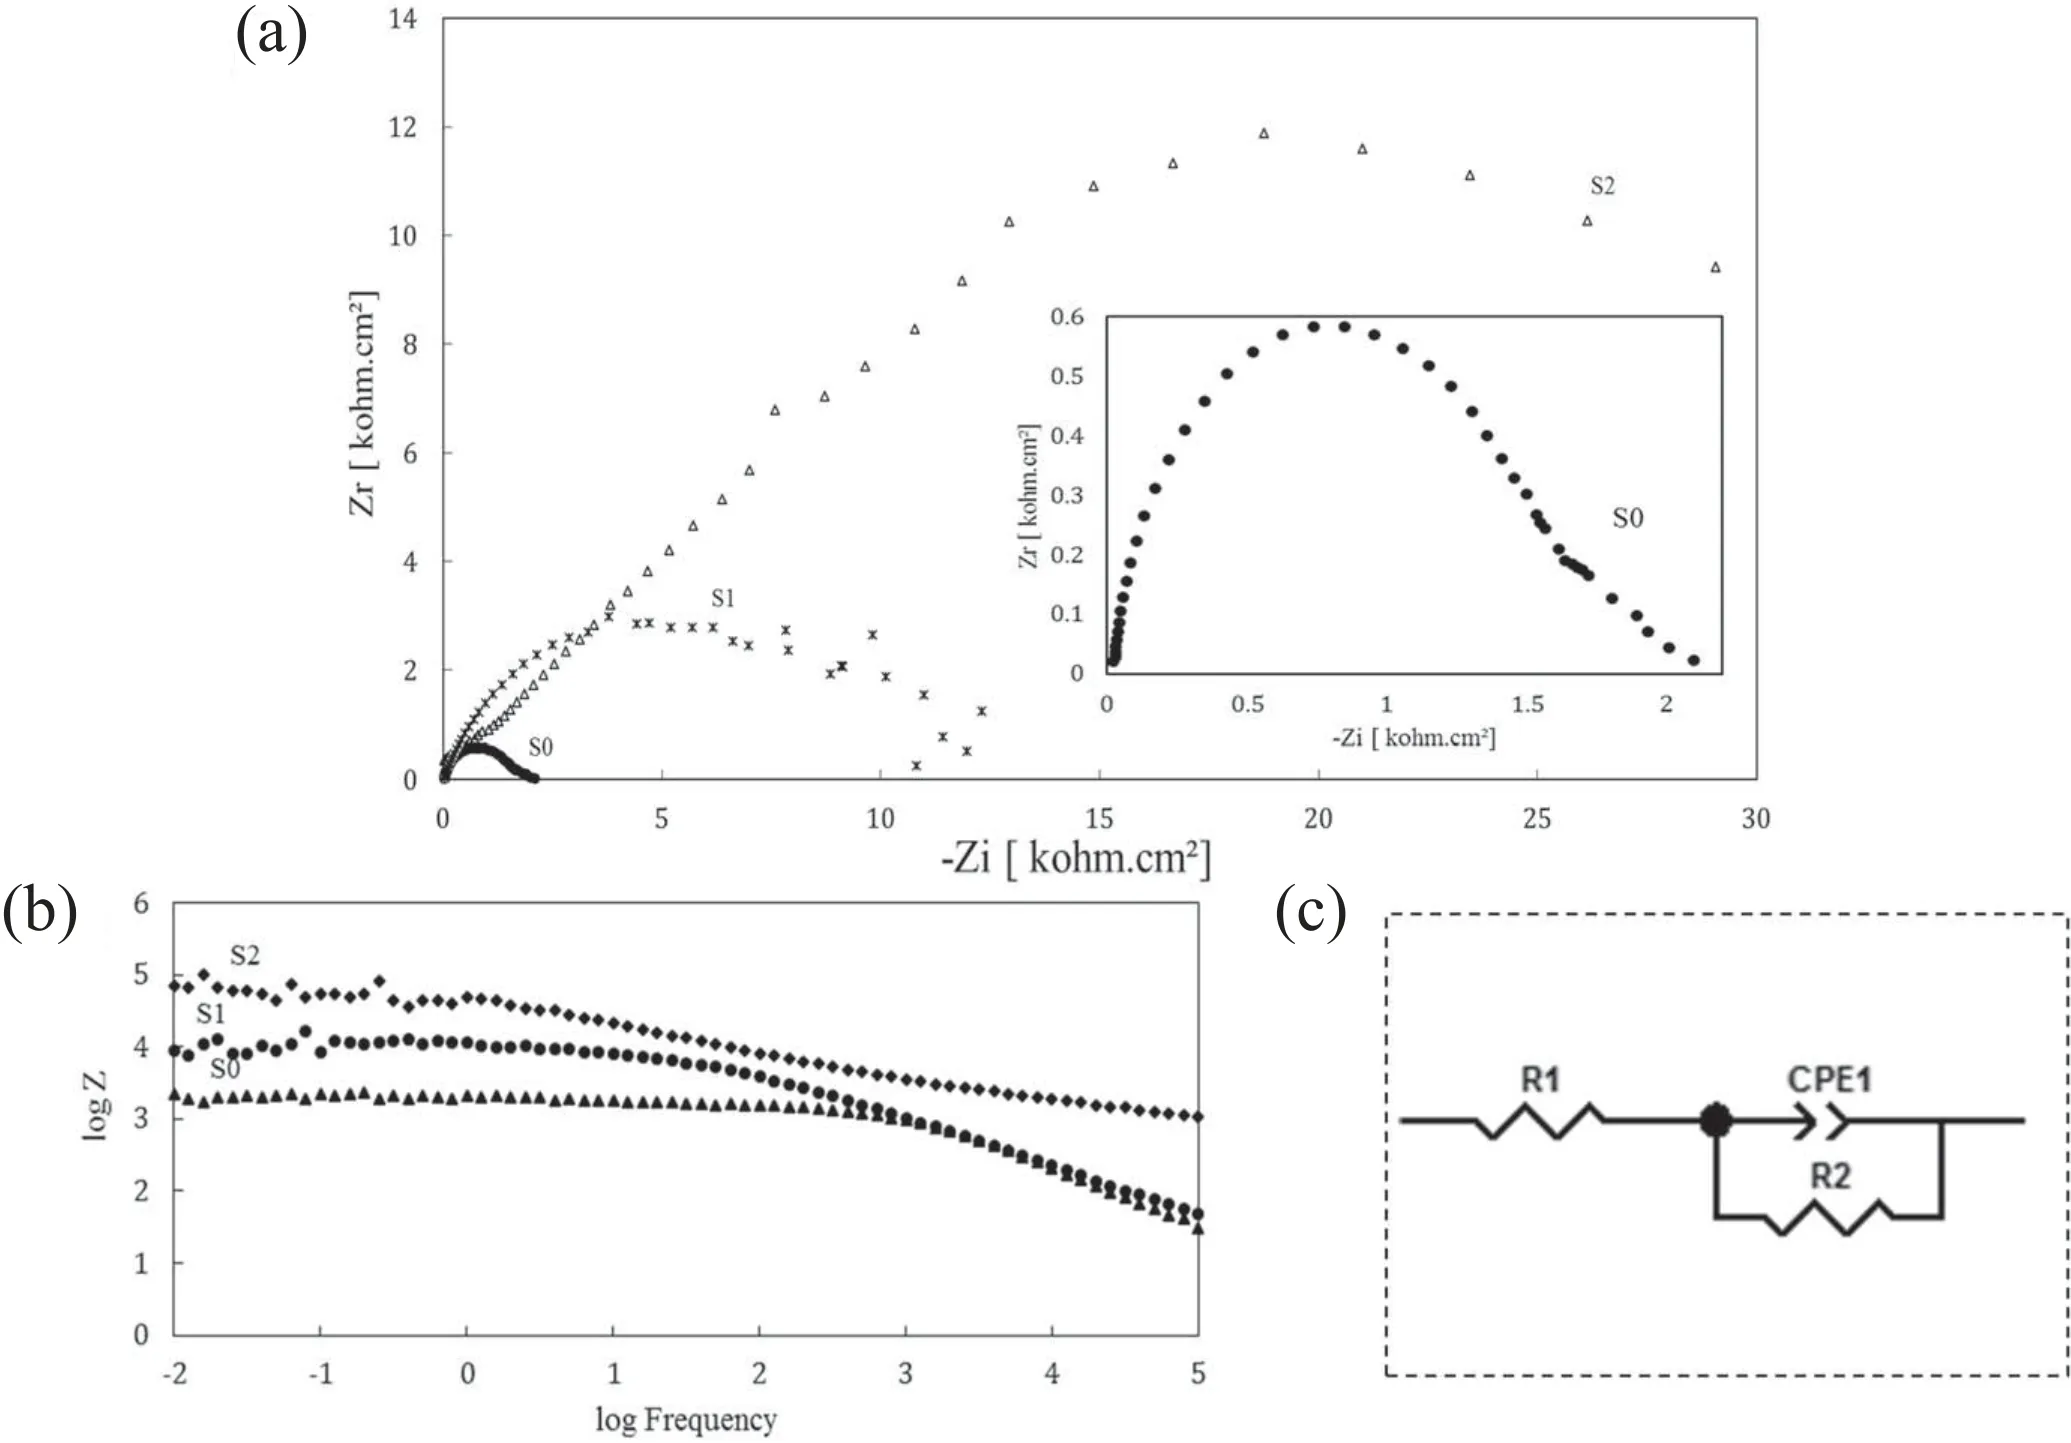
Figure 11.Results of the EIS test in 3.5 wt% NaCl solution: (a) Nyquist plots, (b) Bode module, and (c) equivalent circuits for fitting the impedance data.
4. Conclusion
(1) An Al2O3/MoS2nanocomposite coating was fabricated on an aluminum 1050 substrate using the PEO method.
(2) The zeta potential of MoS2nanoparticles is about?25 mV, which suggests that microparticles of MoS2are a better choice for producing Al2O3/MoS2composite.
(3) The mechanism of the fabrication of the Al2O3/MoS2nanocomposite is based on energy discharge.
(4) By filling the pores appearing in the coating, MoS2nanoparticles reduced their susceptibility to the penetration of aggressive ions such as Cl?, thereby leading to an enhanced electrochemical performance.
 Plasma Science and Technology2020年6期
- Plasma Science and Technology的其它文章
- First-principles study on the mechanical properties and thermodynamic properties of Mo–Ta alloys
- Estimation of the sheath power dissipation induced by ion cyclotron resonance heating
- Influence of toroidal rotation on the tearing mode in tokamak plasmas
- Conversion between Vickers hardness and nanohardness by correcting projected area with sink-in and pile-up effects
- In-port-plug transmission line design of the ITER plasma position reflectometer
- Effects of the critical breakdown path on the ignition performance in heaterless hollow cathodes
