MAXIMUM TEST FOR A SEQUENCE OF QUADRATIC FORM STATISTICS ABOUT SCORE TEST IN LOGISTIC REGRESSION MODEL?
School of Mathematics and Statistics,South-Central University for Nationalities,Wuhan 430074,China
E-mail:13554546673@163.com
Jiayan ZHU?
School of Information Engineering,Hubei University of Chinese Medicine,Wuhan 430065,China
E-mail:zhujiayan999@163.com
Zhengbang LI
School of Mathematics and Statistics&Hubei Key Laboratory of Mathematical Sciences,Central China Normal University,Wuhan 430079,China
E-mail:lizhengbang@mail.ccnu.edu.cn
Abstract This article proposes the maximum test for a sequence of quadratic form statistics about score test in logistic regression model which can be applied to genetic and medicine fields.Theoretical properties about the maximum test are derived.Extensive simulation studies are conducted to testify powers robustness of the maximum test compared to other two existed test.We also apply the maximum test to a real dataset about multiple gene variables association analysis.
Key words Maximum test;quadratic form statistics;score test;asymptotic statistical property.
1 Introduction
In recent years,with development of next generation sequencing technology,a large amount of high-dimensional locus genetic information can be derived by researchers at low cost.Therefore,jointly analyzing associations between complex diseases and multiple SNPs(Single Nucleotide Polymorphism)become more and more popular.There existe some tests for testing association between complex diseases and high-dimensional SNPs.It is still needed to explore tests that can improve powers to a certain extent and identify the susceptible SNPs effectively.Researchers often pay more attention to exploring robust statistical tests for testing the associations with high-dimensional genotype data.
In case-control trials about complex diseases,researchers often want to test association between a complex disease and some SNPs with high dimension.For this purpose,we propose a simple and robust statistical test,which can be applied to test the association.In order to study association between a complex disease indicated by Y(a binary trait taking value 0 or 1 for normal or disease status respectively)and p SNPs with linkage disequilibrium,Chatterjee et al.(2009)[6]took following logistic regression model,

where genetic variable Gkrepresents value of the kth SNP adopting an additive genetic model with values 0,1,and 2 for k=1,2,···,p.The corresponding null hypothesis is as follows

Denote score test for kth(k=1,2,···,p)SNP by Mk.We combine all p score statistics to obtain a p dimensional score vector denoted by M=(M1,M2,···,Mp)′.There have existed some tests to study the above association testing problem.Those tests can be roughly divided into three categories.The first category includes quadratic form tests composed of all score test components,such as the traditional Hotelling T2test([9,26]),genetic distance regression test([24]),variance component tests([11,20,22,22,25]),and C-alpha test([17]).The second category includes summation form tests by integrating a transformation of each single score test linearly to gain a new global test,for example,principal component regression tests([7,10,23]).The third category includes tests by combining the p-value of each SNP marginal association test and other tests,such as direct combination p-values test[8]and maximin efficiency robust test[27].As we know,as dimension p is large,none of those above tests has an absolute advantage.A comparative study about powers for some of those statistics can be found in literatures([3,5,19,21]).
It is easy to prove that score vector M asymptotically follows a multivariate normal distribution with mean vector μp×1and covariance matrix Σp×punder some regular conditions as sample size becomes large.The above association testing problem is equivalent to testing that p-dimension mean vectorμp×1equals to 0 from a multivariate normal population.In order to further investigate the association testing problem,we abstract it into a mathematical statistics problem.Suppose that a random vector X=(X1,···,Xp)′follows p dimensional multivariate normal distribution with mean vector μp×1and covariance matrixHypothesis testing problem about H0is equalling to following hypothesis testing problem,

Suppose that collection of independent identical distribution samples with sample size n denoted byis obtained.Denote sample mean vector and sample covariance matrix of these samples as follows

When sample size n is larger than dimension p,denote the core of traditional Hotelling T2byUnder null hypothesis,the asymptotic distribution ofis related to a χ2distribution with degree freedom p as n is large.As p is giant,power ofis very low even if n is still more than dimension p.In recent years,Bai et al(1996)[4]proposed a test with the core part denoted byKatayama et al(2013)[13]investigated asymptotic distribution aboutwith details.
The structure of remained parts of this article is as follows.In Section 2,we derive asymptotic normality with details.In Section 3,we conduct extensive monte carlo simulations to view performances of the proposed test compared to other two tests.In Section 4,we adopt our test to analyse a real genotype data with nine genes in association analysis about pancreatic cancer.In Section 5,we summarize the advantages and disadvantages of our proposed methods,and prospect some future research work about this field.
2 Statistical Methods
2.1 Joint asymptotic theory for any two quadric form statistics
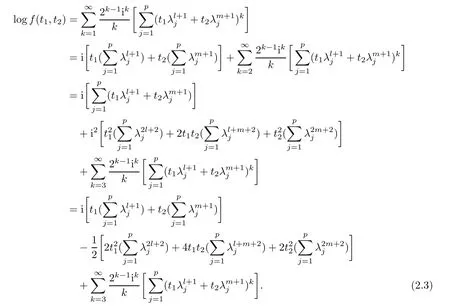
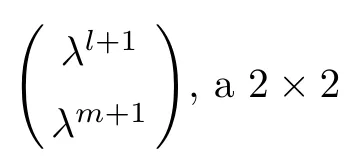
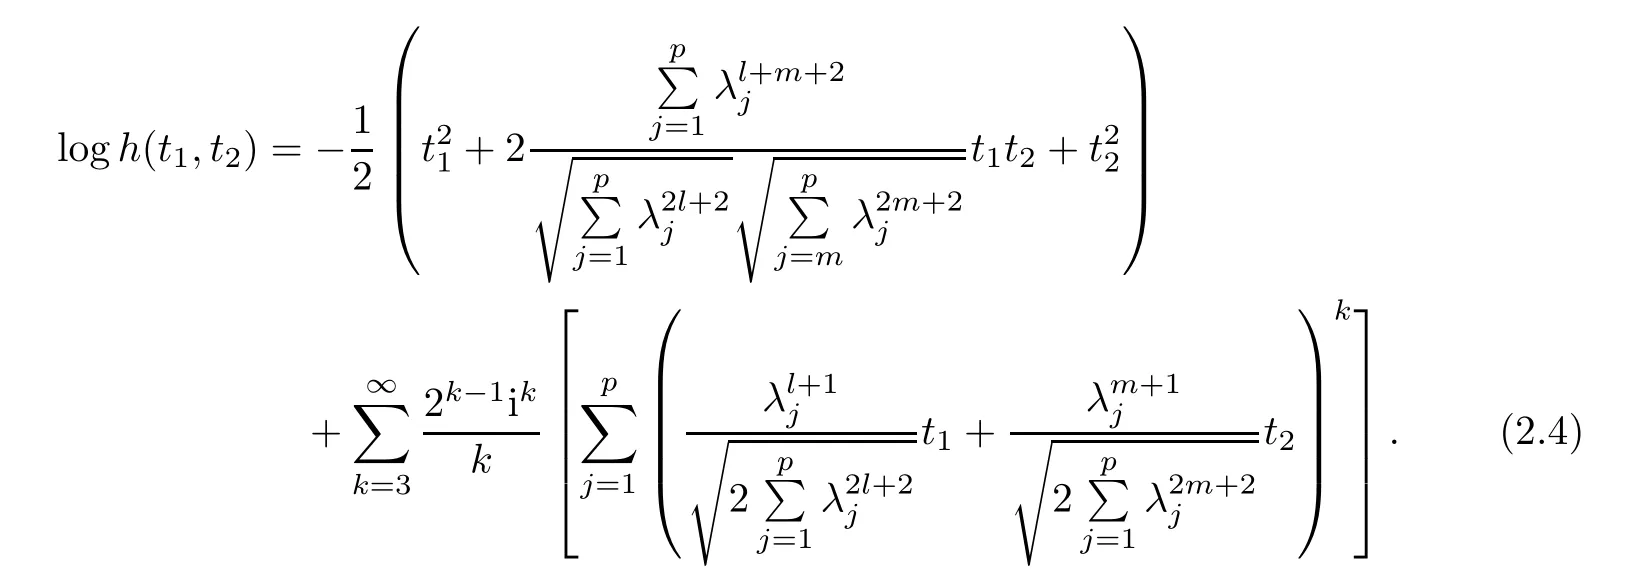
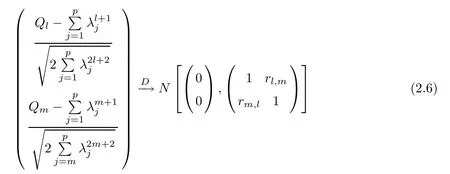
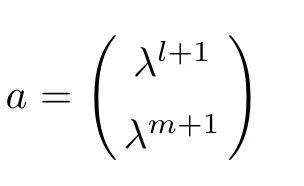
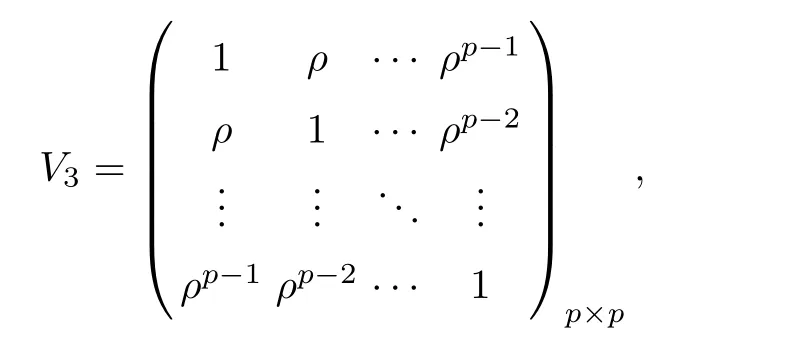
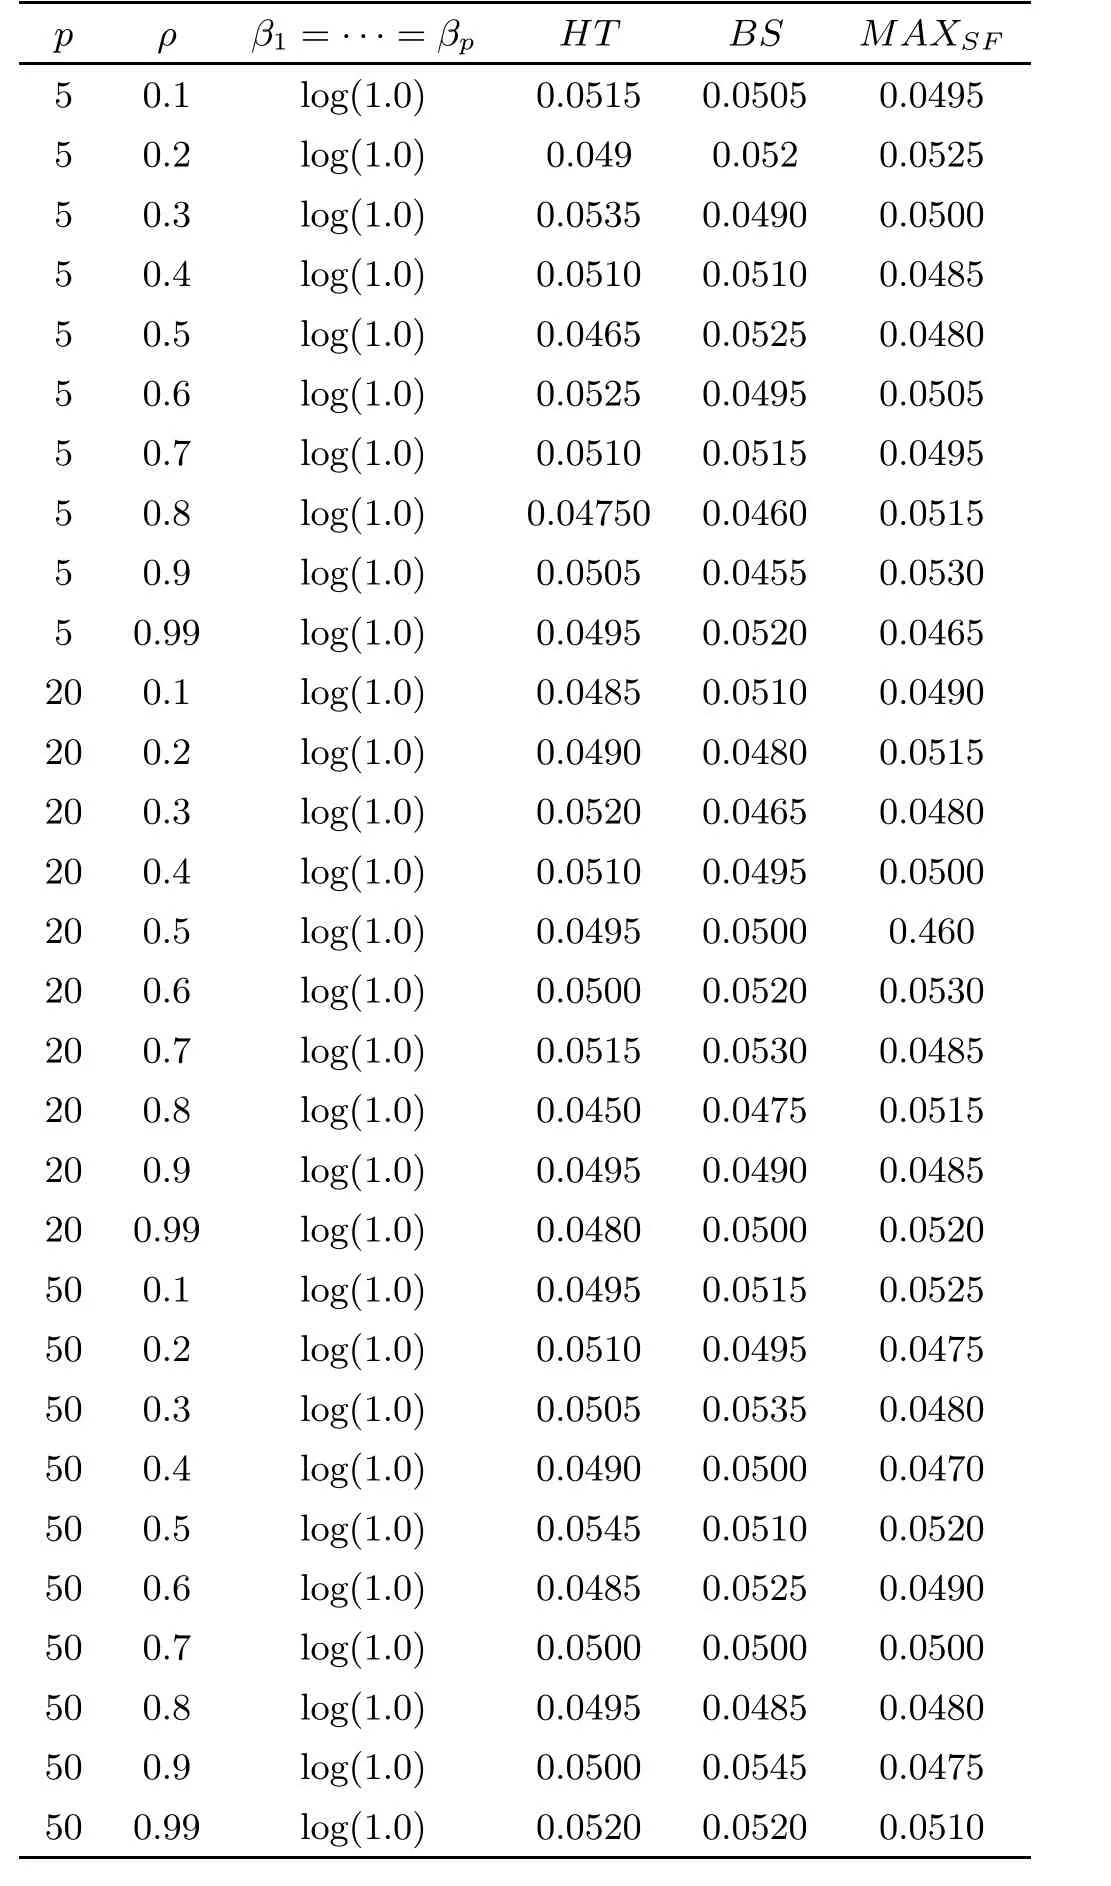
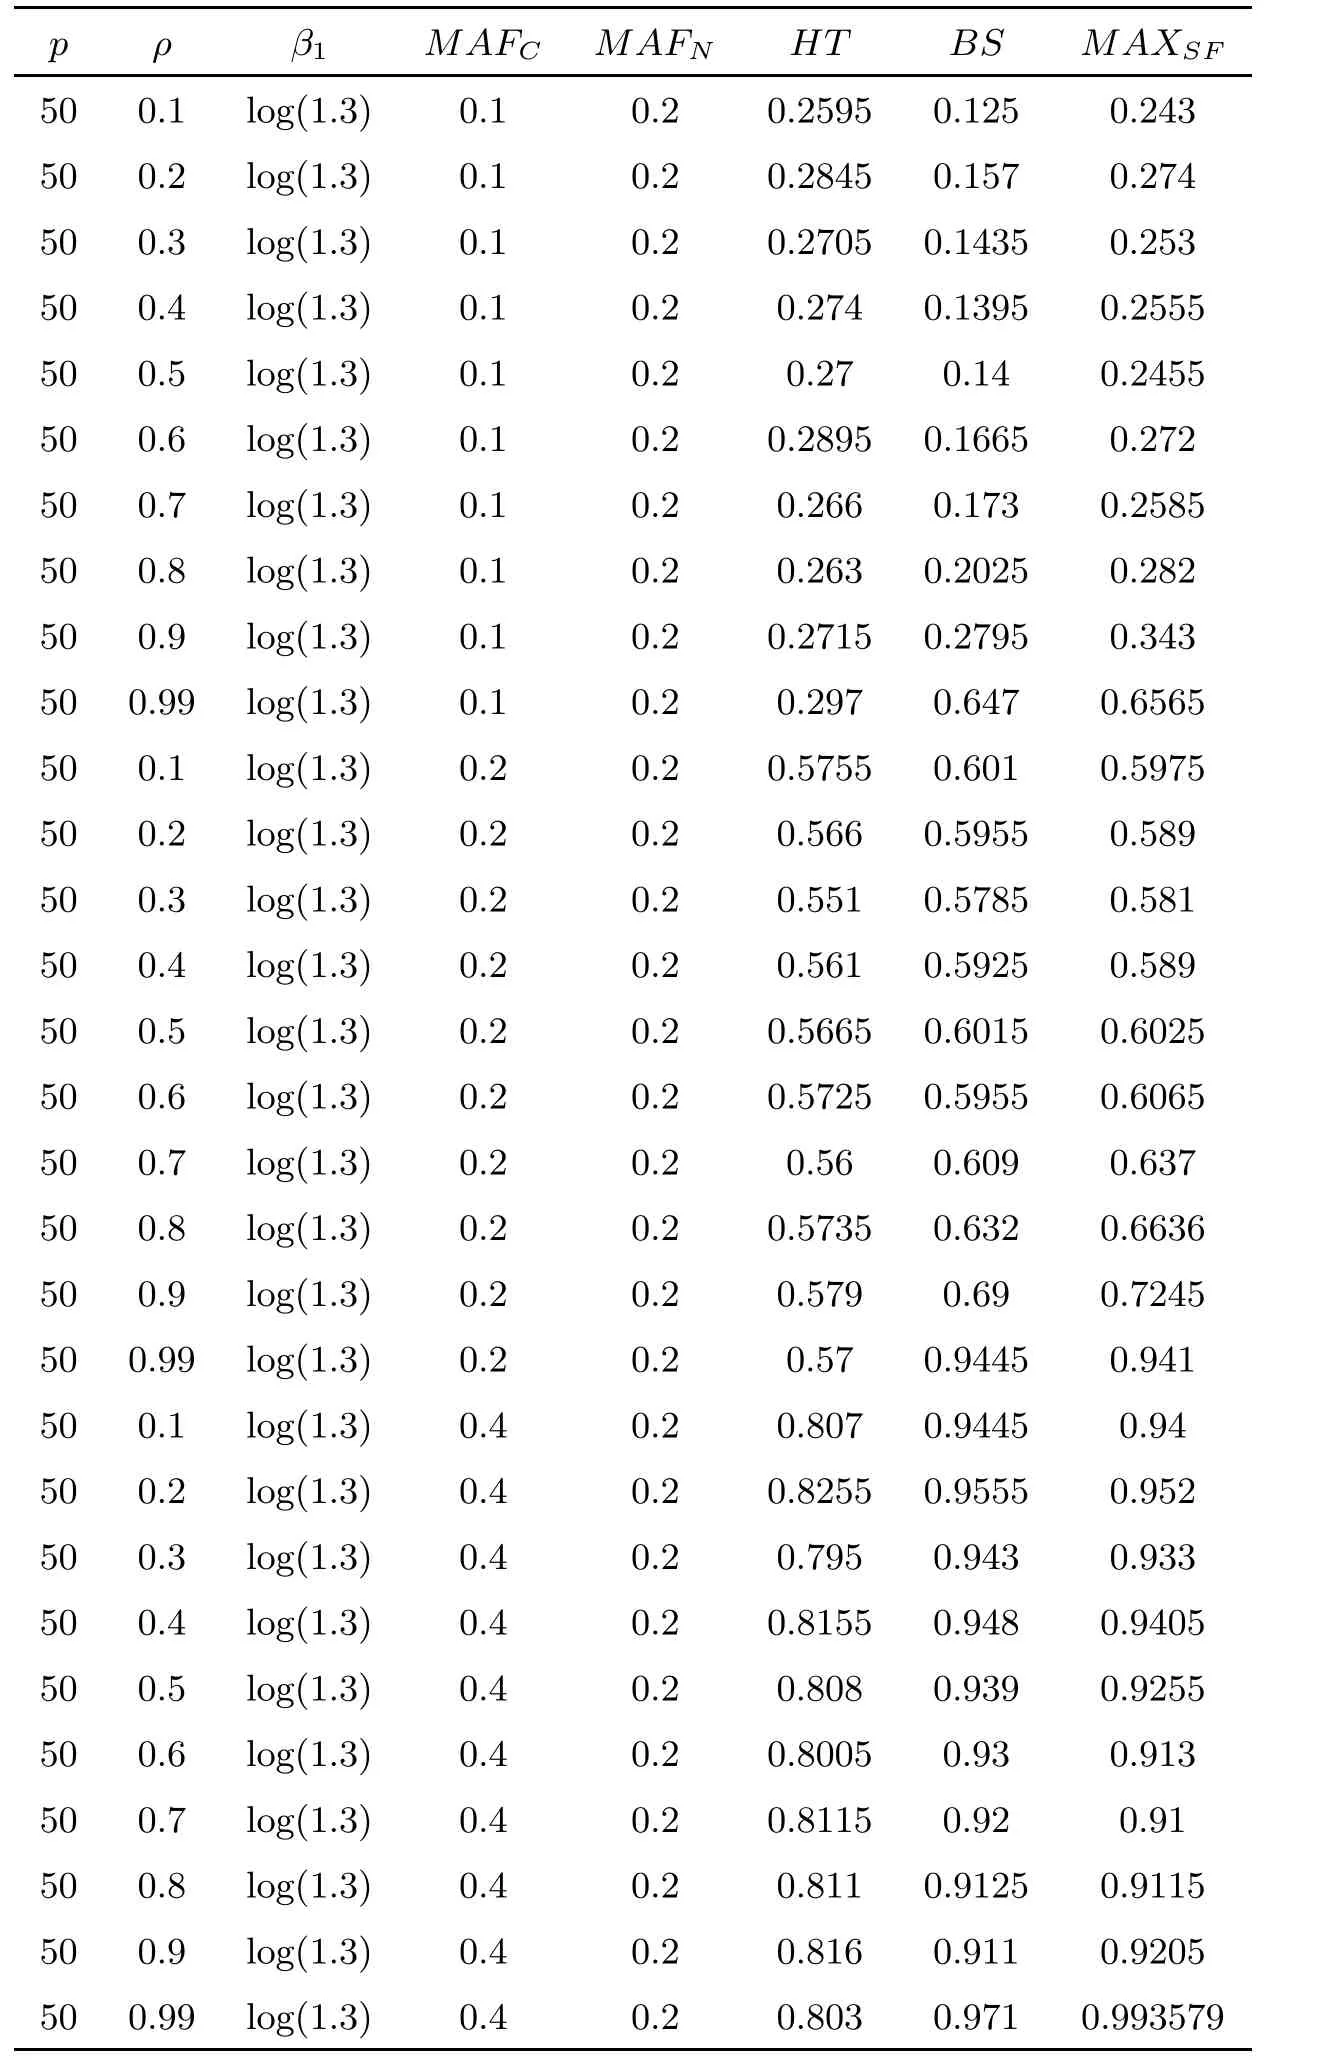
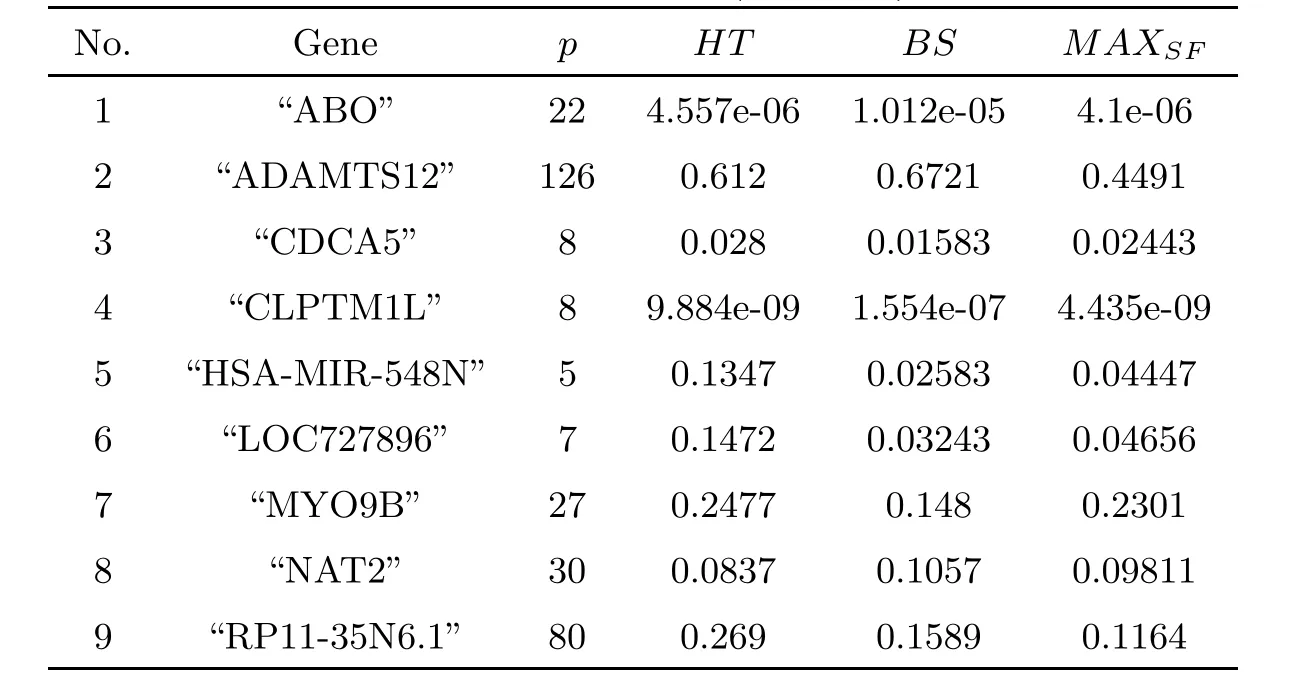
For simplicity,suppose that p dimensional random vectorfollows a multivariate normal distribution Np(0,Σ).Suppose that any two different integers l and m satisfy to l ProofDenote a p×p orthogonal matrix ξ=(ξ1,···,ξp)satisfiedLettingwe can obtain cov(U,U)=Ip(p dimensional identity matrix).For any two integers l and m,according to the real symmetric matrix theory,we can obtain.We can obtainandLet W1,···,Wpare independent and identical random vectors drawn from a p dimensional standard normal distribution,and W′=(W1,···,Wp).According to the matrix theory,we obtainDenote f(t1,t2)the characteristic function of two-dimensional random vector η =(Qk,Ql)′.According to the probability limit theory,we obtain According to the following Taylor expansion where Z is any complex number satisfying|z|<1(|z|means the modulus of z),we can obtain Namely,we can obtain as p→∞. In practice,we do not know the population covariance matrix Σ,so we need to estimate it.According to the theory in the second chapter of literature[1],the sample covariance matrix S is a consistent estimate of the total covariance matrix Σ,as n → ∞ with fixed p and n>p. Because Lemma 2.2Suppose that p dimensional random variable ξ=(ξ1,···,ξp)′follows multivariate normal distribution with mean vector(0,···,0)′and covariance matrix Σ.For any p×p symmetry matrix A,we can obtain Lemma 2.3Suppose that p dimension random variable ξ=(ξ1,···,ξp)′follows p dimension multivariate normal distribution with mean vector(0,···,0)′and covariance matrix equalling to identity matrix Ip.For any p×p symmetry matrix A,we obtain ProofLet characteristic function of ξ′Aξ be as follows: Theorem 2.4Ifconverges in probability to zero as n,p→ ∞ with n>p,we obtain the result that two dimensional statistic vectorand two dimensional statistic function η have a common asymptotic distribution.Asymptotic distribution ofis bivariate normal distribution with mean vector(0,0)′and covariance matrix as n,p is large with n>p. ProofAccording to(2.7),we obtain According to(2.8),we obtain If X′(Sm?Σm)X converges in probability to zero under some regular conditions as n,p→∞with n>p,we can obtain conclusion(2.9)according to Chebychev’s inequality and Slutsky’s theory. Modern researches shown that testsandhave high power in situations,where non-zero elements in mean vector are not very sparse.In case of same mean vector,powers ofandare affected by covariance structure.None oforis overwhelming in power performances.To obtain robust power performances,we propose a novel test as follows: To calculate p-value of test MAXSF,we present the following theorem. ProofAs the conditions described in this theorem are satisfied,we can obtain as p is large according to(2.1)with l=?1,and m=0.Using property of multivariate normal distribution,we obtain conclusion(2.12). According to Theorem 2.4 and Theorem 2.5,p-value of test statistic MAXSFequals towhere and f(z1,z2;V2)is the probability density function of a two dimensional normally distributed random vector whose mean vector is(0,0)′and covariance matrix is V2. In this section,we apply MAXSFto real data analysis in GWAS.Suppose that the genetic information of interest is composed of p SNPs from n1case samples(Y=1)and n0control samples(Y=0).For i=1,2,···,n1,n1+1,n1+2,···,n1+n0,j=1,2,···,p,let Yi=1 or 0 denotes the ith sample from case group or control group,and genotype of the ith sample and the jth SNP can be genetically encoded with Gij(taking values 0,1,and 2)representing the number of alleles.Let Gi=(Gi1,Gi2,···,Gip)′represents genotype data vector composed of p SNP of the ith sample for i=1,2,···,n1,n1+1,n1+2,···,n1+n0.In absence of covariate information,following logistic regression model is adopted to conventional practice of GWAS,Logit Pr(Yi=1|Gi)= β0+ β1Gi1+ ···+ βpGip.Denoting model parameter vector β =(β1,···,βp)′,null hypothesis of testing problem studied is H0:β =(0,···,0)′.According to literature[6],it is obtained that corresponding score test related to H0denoted by With p dimensional score vector T and its estimated asymptotic covariance matrix W,We can construct test MAXSFaccording to statistical theorems in previous section. In this subsection,we evaluate powers of test MAXSFby extensive simulations.To fully and objectively view power performances of MAXSF,we compare MAXSFto other two common tests(denoted by HT below)and(denoted by BS below). The following two scenarios are simulated by the empirical sizes and powers,respectively.We designate covariance matrix with structure, where 0<ρ<1. Scenario 1:Estimating Empirical SizesWe generate a p(=5,20,50)dimensional multivariate normal distribution with mean vector μp×1,and covariance matrix is Vp×pat first.These data are converted into a Haplotype with a value of 0-1 according to minor allele frequencies(MAFs).Secondly,we obtain a large population of haplotype data by means of 100000 repetitions.Thirdly,we randomly combined two haplotype data to obtain the genotype data of a sample.For simplicity,without loss of generality,we specify that the first SNP is causal SNP,and remaining SNPs are non-causal SNPs.At last,on the basis of the following logistic regression model,Logitwe generate n1=2000 case(Yi=1)samples and n2=1000 control(Yi=0)samples with β0= ?1.5 and log odds ratio β1= β2= ···= βp=0. For simplicity,the MAFs of all causal SNPs and noncausal SNPs are equalling to 0.2.The significance level is 0.05.All simulation results were obtained by repeating simulation process 2000 times.All simulation results about empirical sizes are displayed in Table 1.We can see that three tests HT,BS,and MAXSFcan control empirical sizes well from Table 1,because empirical sizes of three tests HT,BS,and MAXSFare all around 0.05.For example,asp=5, ρ =0.1,and β1= ···= βp=log(1.0),empirical sizes of three tests HT,BS,and MAXSFare 0.0515,0.0505,and 0.04950,respectively;as p=5,ρ=0.8,and β1= ···= βp=log(1.0),empirical sizes of three tests HT,BS,and MAXSFare 0.0475,0.046,and 0.0515,respectively;as p=20,ρ =0.2,and β1= ···= βp=log(1.0),empirical sizes of three tests HT,BS,and MAXSFare 0.0490,0.0480,and 0.0515 respectively;as p=20,ρ =0.9,and β1= ···= βp=log(1.0),empirical sizes of three tests HT,BS,and MAXSFare 0.0495,0.0490,and 0.0485,respectively;as p=50,ρ =0.5,and β1= ···= βp=log(1.0),empirical sizes of three tests HT,BS,and MAXSFare 0.0495,0.0505,and 0.0460,respectively;as p=50,ρ =0.6,and β1= ···= βp=log(1.0),empirical sizes of three tests HT,BS,and MAXSFare 0.0485,0.0525,and 0.0490,respectively. Scenario 2:Estimating Empirical PowerWe also generate genotype dada that are similar as Scenario 1 except that MAFs of causal SNPs and noncausal SNPs are different.And β2= ···= βp=0,butWe calculate empirical powers of three tests by repeating the above process 2000 times under the significance level α=0.05.MAFs of all causal SNPs(denoted by MAFC)may not equal to the MAFs of noncausal SNPs(denoted by MAFN)in this scenario.All numerical results about empirical powers are displayed in Table 2.From Table 2,we see that none of HT,BS,and MAXSFhas absolute advantages about powers.MAXSFperforms robustly comparing to HT and BS.For example,in Table 2,as p=50,ρ =0.1,causal MAF 0.1,non-causal MAFs 0.2,β1=log(1.3),empirical powers of three tests HT,BS,and MAXSFare 0.2595,0.125,and 0.243,respectively;as p=50,ρ=0.8,causal MAF 0.1,non-causal MAFs0.2,and β1=log(1.3),empirical powers of three tests HT,BS,and MAXSFare 0.263,0.2025,and 0.282,respectively;as p=50,ρ=0.2,causal MAF 0.2,non-causal MAFs 0.2,and β1=log(1.3),empirical powers of three tests HT,BS,and MAXSFare 0.566,0.5955,and 0.589,respectively;as p=50,ρ=0.9,causal MAF 0.2 non-causal MAFs 0.2,and β1=log(1.3),empirical powers of three tests HT,BS,and MAXSFare 0.579,0.69,and 0.7245,respectively.For another example,in Table 2,as p=50,ρ=0.3,causal MAF 0.4,non-causal MAFs 0.2,and β1=log(1.3),empirical powers of three tests HT,BS,and MAXSFare 0.795,0.943,and 0.933,respectively;as p=50,ρ=0.7,causal MAF 0.4,non-causal MAFs 0.2,and β1=log(1.3),empirical powers of three tests HT,BS,and MAXSFare 0.8115,0.92,and 0.91,respectively. Table 1 Empirical Sizes for HT,BS,MAXSF Table 2 Empirical Powers for HT,BS,MAXSF In this section,we apply three tests HT,BS,and MAXSFto analyze a real dataset about pancreatic cancer in GWAS[16].A total of 26,247 SNPs in reconstituted data were also analyzed in literature[28].Nine genes ABO,ADAMTS12,CDCA5,CLPTM1L,HSA-MIR-548N,LOC727896,MYO9B,NAT2,and RP11-35N6.1 are selected.Some literatures([2,18])also reported to association between pancreatic cancer and two genes ABO and CLPTM1L.The other Seven genes are selected because they have different linkage disequilibrium structures.Similar to literature[28],we mainly analyze samples data from Europe.SNPs of which MAFs less than or equaling to 0.05 are excluded from genotype data.In final genotype data,there were 3834 case samples and 3904 control samples.Final numbers of SNPs about these nine genes are presented in Table 3.There are some covariates including study area,age,gender,and the top 10 principal component variables representing the group stratification information.The analysis results of HT,BS,and MAXSFare shown in Table 3.From Table 3,we can see that numerical results of HT,BS,and MAXSFare similar to those of simulation.For some genes,associations can be detected significantly by MAXSF.MAXSFhas smaller p-values than other two tests HT,and BS.For example,for gene “ABO”,p-values of HT,BS,and MAXSFare 4.557 e-06,1.012 e-05,and 4.1 e-06,respectively.For gene “CLPTM1L”,p-values of HT,BS,and MAXSFare 9.884e-09,1.554e-07,and 4.435e-09,respectively. For some genes,test HT can not significantly detect associations,but test BS and MAXSFcan significantly detect association.For example,for gene “HSA-MIR-548N”,p-values of HT,BS,and MAXSFare 0.1347,0.02583 and 0.04447 respectively;for gene “LOC727896”,p-values of HT,BS,and MAXSFare 0.1472,0.03243,and 0.04656,respectively.On the basis of results in Table 3,it can be concluded that test MAXSFperforms robustly in a sense and can be applied in GWAS. Table 3 Real Data Analysis Results(p-values)for HT,BS,MAXSF In this article,we propose a novel test to examine association between complex diseases and multiple SNPs.This test optimize traditional Hotelling T2test HT and modern test BS.The novel test is investigated theoretically with large samples size and high dimension,so one can calculate p-value of proposed test easily.It can be concluded that novel test is a good test with robust powers.When the degree of linkage imbalance of gene loci is strong or very strong,powers of novel test are same as or slightly lower than those of other tests commonly used nowadays for“small n big p” (number of statistical terms,refers to sample size is smaller than dimension of sample)scenario.We need to point out that there are also other two covariance matrix structures that should be considered.Because results performances of empirical sizes and powers for other two covariance matrix structures are nearly same as that for V3in this article,so we only present results of empirical sizes and powers for V3.Our method can also be extended to experiment designs[12]and nonparametric statistics([14,15]) fields.As datasets about gene association analysis include covariate information such as gender,age,race and so on,the novel test can also be used,but information of covariates should be adjusted when calculating score test vector and its corresponding covariance matrix.Idea of the proposed test can also be extended to modern principal component analysis,which will be further studied in future.






2.2 The maximum test of two quadric form tests about score test


3 Application to Genome Wide Association Study(GWAS)


3.1 Simulation research
3.2 Real data analysis
4 Discussion
 Acta Mathematica Scientia(English Series)2020年2期
- Acta Mathematica Scientia(English Series)的其它文章
- ULAM-HYERS-RASSIAS STABILITY AND EXISTENCE OF SOLUTIONS TO NONLINEAR FRACTIONAL DIFFERENCE EQUATIONS WITH MULTIPOINT SUMMATION BOUNDARY CONDITION?
- EXPANDABLE PARALLEL FINITE ELEMENT METHODS FOR LINEAR ELLIPTIC PROBLEMS?
- PROPERTIES ON MEROMORPHIC SOLUTIONS OF COMPOSITE FUNCTIONAL-DIFFERENTIAL EQUATIONS?
- INITIAL BOUNDARY VALUE PROBLEM FOR THE 3D MAGNETIC-CURVATURE-DRIVEN RAYLEIGH-TAYLOR MODEL?
- STRONG INSTABILITY OF STANDING WAVES FOR A SYSTEM NLS WITH QUADRATIC INTERACTION?
- ON THE AREAS OF THE MINIMAL TRIANGLES IN VEECH SURFACES?
