How bead shapes affect the plasma streamer characteristics in packed-bed dielectric barrier discharges:a kinetic modeling study
Pan ZHAO (趙攀),Jianguo GU (顧建國),Hongyu WANG (王虹宇),Ya ZHANG (張雅),4,Xiaoying XU (徐曉英),4 and Wei JIANG (姜巍)
1 Department of Physics,Wuhan University of Technology,Wuhan 430070,People’s Republic of China
2 School of Physics,Huazhong University of Science and Technology,Wuhan 430074,People’s Republic of China
3 School of Physics Science and Technology,Anshan Normal University,Anshan 114007,People’s Republic of China
4 Authors to whom any correspondence should be address.
Abstract
Keywords:plasma catalysis,surface ionization waves,bead shape
1.Introduction
Plasma catalysis is attracting substantial interest in various environmental applications such as gas contaminant removal,gas conversion,and O3production[1–11].Plasma catalysis is a combination of plasma and catalyst,with the advantages of catalyst selectivity and plasma high efficiency.The plasma reaction itself does not have good selectivity.In order to improve its performance,such as higher reaction efficiency and better selectivity [8,12–16],catalytic materials are inserted into the discharge gap to form packed-bed dielectric barrier discharges (DBDs).The plasma and catalyst promote each other for catalytic reactions and improve the selectivity of reactive plasma species on catalyst surfaces.On one hand,reactive species could affect catalyst properties,such as work function and morphological characteristics [1].On the other hand,the presence of catalysts can influence the discharge characteristics,like the discharge type (surface or volume)[17].Micro-discharges(MDs)can be generated on the surface of catalyst or in the gap between catalytic materials,resulting in higher densities of active species on and near the catalyst surface [18].
In the past few years,DBDs have been extensively studied in plasma catalysis applications,and in most cases,DBDs typically occur in a filamentary mode at atmospheric pressure [19–23].Filaments are generated by electron avalanche at a high driving voltage (higher than a certain threshold).Therefore,they can produce high concentrations of active species under nanoseconds in the presence of high electron concentrations in narrow gaps of catalytic materials[24–29].Then they propagate from cathode to anode,forming negative streamers.Kushner and Babaeva et al used a twodimensional (2D) hydrodynamic model to investigate the influence of small dielectric particles (less than tens of micrometers in diameter) on streamer properties at atmospheric pressure[30].Later they reported the results of the ion energy and angular distributions on dielectric surfaces in air[26].Papageorghiou et al studied filaments in nitrogen at atmospheric pressure by using a 2D fluid model [25].Their model has a discharge gap of 1 mm and discharge has two distinct phases.Akishev et al applied a 1D fluid model to study the surface streamers for DBDs in Ar at atmospheric pressure [27].By using 1D simulation,much more kinds of plasma species and primary reaction processes can be included in the simulation compared to 2D or 3D simulations.In our previous work,we have employed a 2D particle-in-cell/Monte Carlo collision (PIC/MCC) model to study the formation,propagation and discharge properties of a streamer in a packed-bed-DBD,and the results were compared to an unpacked DBD [20],then we investigated the formation process and characteristics of MDs in both the μm and nm sized catalyst pores and the results were compared with the earlier results [31].Thereafter,we studied filament formation and mode transition between bulk and surface discharges in an N2/O2mixed gas at atmospheric pressure [32].Furthermore,we investigated the propagation of a plasma streamer in three types of pores in DBDs in the air at atmospheric pressure [33].
As mentioned above,the packed bed DBD (PB-DBD)reactor has much better energy efficiency and attracts growing research interest.A 2D fluid model was also used by Kang et al to analyze the MDs in a ferroelectric PB-DBD [34].However,they only focused on the surface discharge under a strong electric field for two packed beads with spherical shape in a few nanoseconds.Chang and Takaki et al used a 1D parallel plate model in N2to determine the density and the energy of the electron and electric field strength [35],assuming that the gap between the beads was spherical.Three different types of discharges (positive restrikes,filamentary MDs and surface discharges) were generated in PB-DBD reactor at atmospheric pressure in dry air[17,18,32,36–38].Changes in the driving voltage and gas mixing ratio will directly result in a transition in the discharge mode.In addition,the characteristics of the packed beads,such as dielectric constant,size and radii of curvature,may affect the electric field strength and electron density,resulting in a mode transition of discharge[34,39–42].Although several types of research have been tried to understand the properties in a PBDBD reactor better,the importance of different bead shapes,which may influence the development of the plasma species,thus modifies the steamer properties and may restrict the propagation direction of it.
In this work,we employ a 2D PIC/MCC model to investigate the plasma generation on the surface and gaps of packing beads with different shapes.In particular,we stressed the influence of bead shapes on the electron density,ion density,electric field,electron-impact excitation and ionization rates,for two configurations of seed electrons,where the streamer is initiated.The results indicate that the packing bead shape significantly affect both propagation direction and the discharge properties,moreover,the surface discharge or surface-to-surface discharge is selectively enhanced with the presence of different shapes of beads,thus charged species enhanced uniformly on the surface or in the gap between dielectric surfaces,which are important for general catalyst experiments with different shapes of catalyst materials.
2.Description of the model
In this work,we use the PIC/MCC model based on the VSim simulation package [43]for 2D simulations of a DBD with three kinds of bead shapes.PIC/MCC model is capable of simulating the formation of a streamer from an individual charged particle in an electric field,which is not possible by using a fluid model [20,44].Indeed,streamers can only propagate along the surfaces of beads or through the gap.Thus,we assume that a small gap(included in figure 1),exists between packing beads for allowing the propagation of streamers [45].
The geometry of our discharge is shown in figure 1.The width of the model is 1.65 mm in the y-direction and the length is 4 mm in the x-direction.The discharge gap is created between two electrodes covered by a dielectric plate,respectively.The discharge gap is 1 mm.The thicknesses of the dielectric plates are 0.3 mm.The width of the top electrode is 0.05 mm.The top electrode is powered by a pulsed voltage of -20 kV with a rise time of 0.1 ns,which is considered as the cathode.Whereas the bottom electrode is grounded,which is considered as an anode.The dielectric coefficient constant isεr=22for all plates and beads,which is characteristic of ZrO2.ZrO2has some advantages for a PDDBD reactor,with a relatively large dielectric constant,where both the dielectric beads and the dielectric plates can be polarized strongly,resulting in a strong locally enhanced electric field [46,47].And due to the electric field enhancement,the packing beads increase the discharge intensity,and correspondingly the electron density is also high [20].
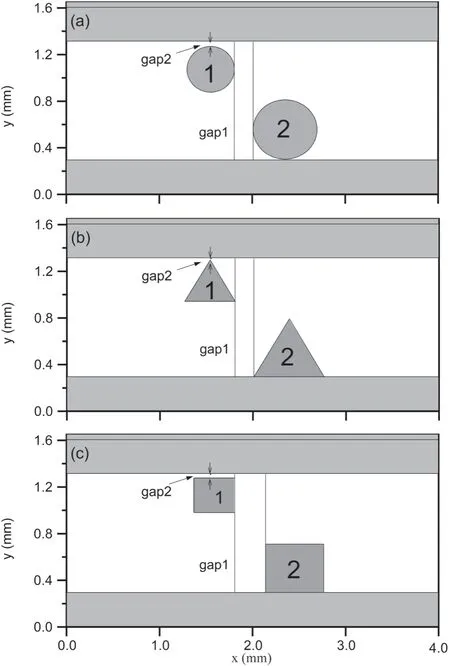
Figure 1.Geometry used in the model.The entire simulation domain is 4 mm in the x dimension and 1.65 mm in the y dimension.The discharge gap is 1 mm,and the top and bottom electrodes are covered by 0.3 mm thick dielectric plates.The top electrode is 0.05 mm thick,and it acts as a powered electrode.The bottom electrode(x=0)is grounded.Dielectric packing beads are placed in the gap.The numbering is used later in the paper.
The geometry of the beads is different,we number the beads as 1 and 2 in figure 1(a),the bead 1 near the upper electrode has a smaller radius of 0.22 mm,the bead 2 has a larger radius of 0.26 mm,and the horizontal distance (i.e.the gap 1 in figure 1(a)) between the two beads is 0.1 mm.In figures 1(b)and(c),the distance from the center of the bead 1 to the vertex is 0.22 mm,and the distance from the center of the bead 2 to the apex is 0.26 mm.Therefore we can calculate the side lengths of triangle and square bead 1 and 2 asandand the horizontal distance in figure 1(b) is the same as in figure 1(a),while the horizontal distance in figure 1(c) is 0.3 mm.In order to avoid the upper square obscuring the seed electrons,we move the two squares to the sides by a distance of half the seed electron width.We take two different distances of gap 2 (0.02 mm and 0.06 mm)which has shown in figure 1.When changing the position of seed electrons,the position of each circle,triangle and square bead remains the same in figure 1.
The discharge gap between the two dielectric plates is filled with N2gas at atmospheric pressure and a temperature of 300 K.The filaments are generated from the seed electrons near the upper dielectric plate.Due to electron impact ionization and secondary electron emission,an avalanche is generated in the direction of the grounded electrode,i.e.the anode,so that the filament can exist for several nanoseconds.Since the total ionization rate in the model is generally less than 10%,only charged particles (electron and ions) are simulated.
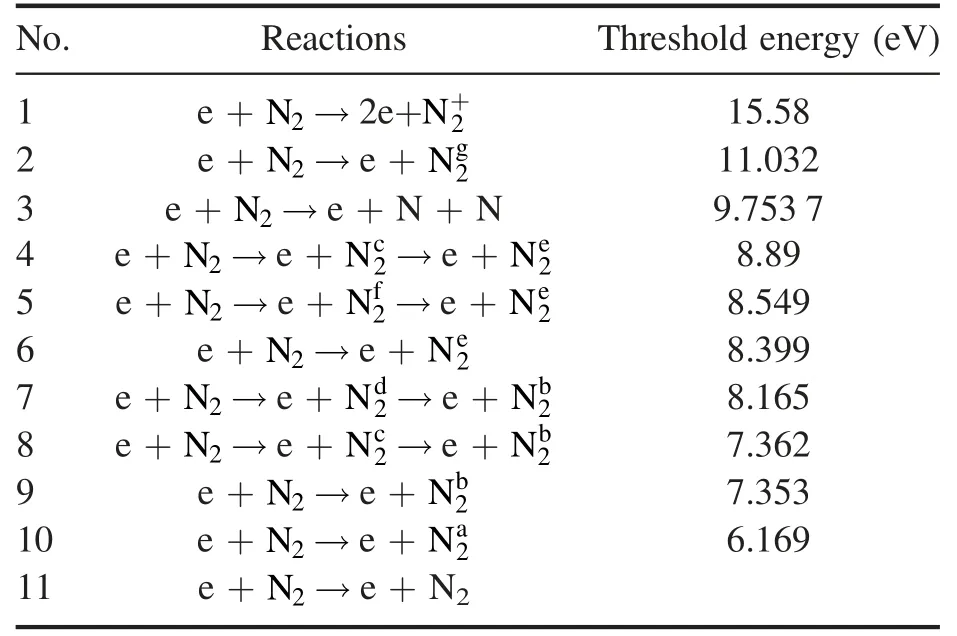
Table 1.The reaction set and the threshold energy of electron impact ionization and excitation collisions in N2 [48–52].
A standard MCC scheme [48–52]is applied to consider an e-N2collision process of elastic,excitation and ionization collisions.More specifically,electron impact excitation and ionization from the N2ground state are accounted for,the electron impact dissociation reaction and elastic collisions of e-N2are considered.The reaction set and the threshold energy of electron impact ionization and excitation collisions are listed below in table 1.As shown in table 1,the charged particles involved in the reaction,i.e.which are considered in the model,include electrons,+N2ions and excitation state nitrogen.Electrons collide with N2molecules to generate+N2andN2*during ionization and excitation.N2*,i.e.N2a,N2b,N2c,Nd2,Ne2,Nf2andNg2in table 1,represents the metastable level of N2.
3.Results and discussion
In this work,we study in detail the influence of packed bead shapes on plasma surface discharge,mainly on electric field distribution in both gas phase and dielectrics,ion density,electron density,ionization rate,and excitation rate for different discharge modes.The seed electrons are placed in two different cases,i.e.gap 2 in figure 1,is set to 0.02 and 0.06 mm,seed electrons can be placed directly above the beads and the center of gap 1 (see figure 1).Three different bead shapes are considered,i.e.circle beads with a larger radius of 0.26 mm and a smaller radius of 0.22 mm,triangle beads with a longer distance of the center to the vertex of 0.26 mm and a shorter one of 0.22 mm,square beads have the same value from the center to the apex as the triangle beads.These configurations help to build an asymmetric model that is more generally valid,in order to better understand asymmetric geometries in actual catalyst structure.Although these three bead shapes are not necessarily the same as in actual catalyst materials,they represent some extreme conditions of actual catalyst materials,which can help us to generally understand the influence of the bead shapes on the streamer generation and thus on the streamer types,such as surface or volume discharge.
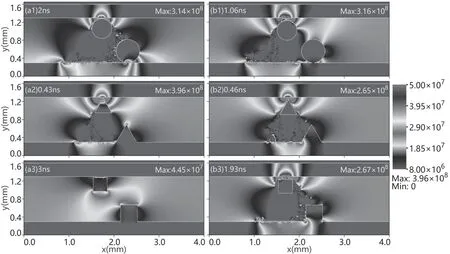
Figure 2.Comparisons of electric fields(V m-1)with different distances of gap 2 when the seed electrons are placed directly above the bead,i.e.(a1)–(a3) gap 2 of 0.02 mm,(b1)–(b3) gap 2 of 0.06 mm.The maximum values are noted in each panel.
3.1.The seed electrons are placed directly above the bead near the upper electrode plate.
The electric field distributions for the three different bead shapes are shown in figure 2 with the seed electrons placed directly above bead 1 for figures 2(a1)–(a3)gap 2 of 0.02 mm and figures 2(b1)–(b3)gap 2 of 0.06 mm.For the circle beads,it is clearly seen from figure 2(a1) that the presence of the circle beads greatly enhances the electric field between bead 1 and the top dielectric layer,and at the contact point of bead 2 and the bottom dielectric layer.This is due to the highlyconcentrated charged species formed during the streamer propagation.This feature is consistent with previous results in references [17,20],however,where only circle beads were considered.
For the triangle beads,the electric field exhibits quite different distributions from the circle bead,as shown in figure 2(a2).The maximum electric field occurs at and around the upper corner point of triangle bead 1,with a larger value compared to the case of circle beads.Indeed,the electric field is enhanced not only between the triangle bead 1 and the top layer,but also the electric displacement filed reaches a similar maximum value inside the corner of triangle bead 1.This is because the presence of sharp boundary of the triangular beads enhances the electric field in the gap between the beads.Indeed,the electric potential strongly depends on the geometric structure.So that the electric field can be enhanced around the tip-like bead structure,as it was predicted that the enhancement of the electric field can reach 1000 times or larger for higher aspect ratio structures [53].
For the square beads,the electric field distribution is strikingly different from those of circle beads and triangle beads,indicating the significant effect of the bead shape on the electric field both in the gas gap and the dielectric material.Indeed,the maximum value of the electric field is about one order of magnitude larger than the cases of circle and triangle beads,and the electric field is enhanced in a quite limited region.For example,the electric field is slightly pronounced at the longitudinal boundaries of the square beads and the bulk gas,as shown in figure 2(a3),since these boundaries separate the gas phase and the dielectrics,and the Poisson equation differs between the gas phase and the dielectric material.However,there is no electric field enhancement occurring in the gap between bead 1 and the top dielectric layer,where no discharge is examined,and thus no streamer is formed in this case.This is because the seed electrons are placed in gap 2 directly above bead 1,where the density of the seed electrons is~1017m-3and the Debye length is~0.04 mm with the energy of~1 eV.Thus the Debye length is larger than the size of gap 2 (0.02 mm),this explains why no streamer occurs.
Therefore,in order to generate plasma streamer,we set the size of gap 2 a bit larger,i.e.0.06 mm (larger than the Debye length of 0.04 mm that we calculated before) in figure 2(b).For the circle beads,as shown in figure 2(b1),the electric field reaches a similar maximum in gap 2 compared to figure 2(a1),but there is almost no maximum appears at the contact point between bead 2 and the bottom dielectric layer,as the streamer has not reached there (see figures 3(a1)–(a4)below).
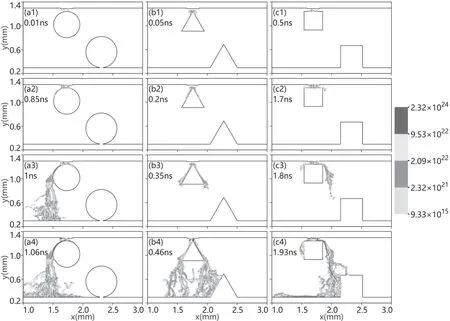
Figure 3.The electron density (m-3) at different times for different bead shapes,i.e.circle (a1)–(a4),triangle (b1)–(b4),square (c1)–(c4),when the seed electrons are placed directly above the bead 1 with gap 2 of 0.06 mm.The same color scale is used in all panels to allow comparison.The different time intervals for different bead shapes are based on the different filament formation times for different conditions.
For the triangle beads,as shown in figure 2(b2),the electric field exhibits quite similar distributions as in the figure 2(a2),but the maximum value is lower than that in figure 2(a2).The reason is that the dielectric beads and layers are strongly polarized by the applied electric field,which induces a smaller drop of the electric potential in the dielectric,but a larger drop of the electric potential in the gas gap,where the charged species are accumulated and trapped,so that a larger gap(gap 2)yields a smaller local electric field,and thus a lower maximum.This feature has also been reported in references [20,54].
For the square beads,the electric field is enhanced between bead 1 and the top dielectric layer,at the contact point of bead 2 and the bottom dielectric layer,and on the surface of the bottom dielectric layer.On one hand,this is due to the highly-concentrated charged species formed on the surfaces of bead 1 and the bottom layer during the streamer propagation.On the other hand,this is due to the presence of the contact point of bead 2 and the bottom layer,where the electric potential changes strikingly at this contact point,resulting in the highest electric field.This indicates the significant influence of the size of gap 2 between bead 1 and the top dielectric plate,on the electric field enhancement,and thus on the streamer formation.Therefore,for the case of large gap 2 (0.06 mm),the electron density,excitation and ionization rates,and ion density,are shown in figures 3,4 and 5,respectively.
Figure 3 shows the electron density with different bead shapes,during the generation and propagation of plasma surface ionization waves(SIWs),where the seed electrons are placed directly above the bead with gap 2 of 0.06 mm.Note that,the validation of the simulation model is that the total ionization degree (maximum plasma density/neutral gas density) is less than 10%,thus the upper limit of the plasma density is about 2.5×1024m-3with the neural gas density of ≈2.5×1025m-3.In our calculation,the maximum electron density is 2.32×1024m-3(shown in figure 3),and the maximum ion density is 1.53×1024m-3(shown in figure 5),which are within the limitation.
For the circle beads,the SIWs are generated and begin to propagate at approximately 0.01 ns,later the filaments extend along the left side of the bead to the anode.It is obvious that the strongest electron density occurs on the surface of the circle bead 1,while the electron density of the streamer directed from the surface of bead 1 to the surface of the bottom dielectric layer is relatively small,realizing the enhancement of the SIWs with the presence of the circle beads.The SIWs propagation is asymmetric with respect to bead 1.The reason is that,on one hand,although the geometry of bead 1 is symmetric,the entire model configuration is asymmetric for the purpose of actual catalyst applications.On the other hand,a filament mode is more likely to be asymmetric [12].Indeed,the asymmetry also depends on the inherent statistical properties of the streamers.Filament discharges are fully chaotic and thus induce an asymmetric structure of the electron streamer.
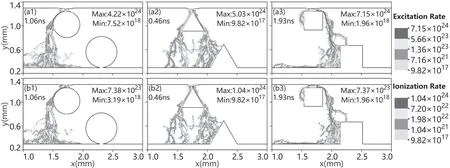
Figure 4.The excitation rate (m-3 s-1) and ionization rate (m-3 s-1) when gap 2 is equal to 0.06 mm and the seed electrons are placed directly above the bead.

Figure 5.The ion density (m-3) with the same condition as in figure 3.
For the triangle beads,the filaments propagate along both sides of the upper triangle bead and toward the left surface of the triangle bead below.In comparison with figures 3(a) and(b),the electron density in figure 3(b) is about two orders of magnitude lower than the density in figure 3(a),but the surface discharge is almost in the same order of magnitude.
For the square beads,the streamer formation is much slower than the cases of the circle and triangle beads,thus the simulation time is different from the first two cases (see above).This is because the discharge formation is very slow in the narrow gap 2 in the case of square bead,resulting in a much slower excitation and ionization process (see figures 4(a3)and(b3)below)due to the limited region where the electron-impact collisions take place.The filaments propagate toward the vertex of the square bead 2 and then propagate along the left surface of bead 2,forming a surfaceto-surface discharge.The electron density is also characterized by a maximum on the surface of bead 1 similar with the cases of circle and triangle beads.However,the similar maximum electron density also occurs on the bottom dielectric surface during the surface-to-surface discharge formation process,as shown in figures 3(c1)–(c4).Thus both the surface discharge and the surface-to-surface discharge are dominated in the square beads case.Whereas,the volume discharge is very weak.This again indicates that the bead shapes affect not only the streamer behavior but also the discharge mode,which may play an important role in optimizing relevant plasma catalyst experiments.
By comparing the electron density at these three different bead shapes,it is clear that although all of the maxims appear on the surface of bead 1,the streamer distributions are strikingly different,both in shape and in absolute value.Note that the electron density distribution characterizes different discharge modes in the case of different bead shapes.Indeed,there occur three kinds of discharge modes in figure 3.For the cases of circle beads and triangle beads,the streamer is dominated by uniform surface discharge on bead 1,while both the surface-to-surface discharge and the volume discharge are relatively weak.For the square beads,the streamer is dominated by both the uniform surface discharge and uniform surface-to-surface discharge,while the volume discharge is very weak.
Figure 4 shows the ionization rate and excitation rate with the circle,triangle and square bead shapes at 1.06,0.46 and 1.93 ns,respectively.For circle beads (figures 4(a1) and(b1)),the maximum excitation rate and the maximum ionization rate both appear on the surface of bead 1,and the maximum excitation rate is an order of magnitude higher than the maximum ionization rate,the minimum excitation rates and ionization rates are all on the same order of magnitude,but the ionization rate on the upper surface of bottom electrode is also high.For the triangle beads,although the filaments travel along both sides of the triangle bead,the maximum excitation rate and the maximum ionization rate both appear at the apex of the triangle near the upper electrode,and the values on the right side of the triangle bead are also quite high.And volume discharges are much weaker than in the square bead case.For the square beads,the maximum excitation rate and the maximum ionization rate both appear at the vertex of the square,and the values in the surface-tosurface discharge between two beads and the upper surface of bottom electrode are quite high.
When the shapes of the packed beads are the circle and square,their maximum excitation rates are one order of magnitude lower than the maximum ionization rates,and the minimum excitation rates and the minimum ionization rates are on the same order of magnitude.But in the triangle case,the maximum and minimum excitation rates and ionization rates are all on the same order of magnitude.The vertex of the upper triangle bead near the seed electrons is a typical tip-type structure,where the coupling is better,resulting in high ionization rate and excitation rate.
Figure 5 shows the ion density when the streamer has reached the anode.After this time,the densities of ion and electron and the streamer will no longer change,which means that the data will not change in later time,so the ion density is plotted with the circle,triangle and square bead shapes at 1.06,0.46 and 1.93 ns,respectively.As shown in figures 3 and 5,they are much similar with each other and have the same order of magnitude,as the electron density in plasma is almost same as the density of ions and electrons,i.e.ne≈ni.For the circle beads (figure 5(a)),the ion density on the surface of bead 1 is the strongest,and the ion density from the surface of bead 1 to the surface of the bottom dielectric layer is relatively small,which is similar to the case of figure 3,as the presence of beads enhances the SIWs.For the triangle beads,the filaments propagate along both sides of bead 1,later the streamer on the left side extends toward the surface of the bottom dielectric layer,the streamer on the right side propagates toward the surface of bead 2 and the surface of the bottom dielectric layer.The strongest ion density occurs between the apex of bead 1 and the upper dielectric layer,while the ion density of the streamer on the right surface of bead 1 is relatively small.For the square beads,the streamers propagate toward the vertex of bead 2,later extend along the left side surface of bead 2.The strongest ion density occurs between bead 1 and the upper dielectric layer,the ion density of the streamer directed from bead 1 to the vertex of bead 2 is also quite high.
3.2.The seed electrons are placed in the gap 1 near the upper electrode plate.
Figure 6 shows the electron density when the seed electrons are placed in the gap 1,and the distance of gap 2 is equal to 0.02 mm.For the circle beads,the SIWs are generated and begin to propagate at approximately 0.05 ns(figure 6(a1)),the filaments extend toward the surface of bead 2 and propagate along with bead 2 to the surface of the bottom dielectric layer.Indeed,the maximum electron density appears at the surface of bead 2 (figure 6(a4)),while the electron density on the surface of the bottom dielectric layer is also high.But the electron density around the seed electrons is much smaller than the electron density on the surface of bead 2,which is distinctly different from when the seed electrons are above the bead 1.For the triangle beads,two main streamers are clearly visible,as they are respectively attracted by different bead surfaces (shown in figure 6(b2)).The streamer on the left extends toward the right surface of bead 1,while the streamer on the right extends toward the left surface of bead 2.It is clear that the strongest electron density is presented on the surface of the bead 2 (figure 6(b4)),and the electron density on the surface of the bottom electrode is relatively small,which is similar with the case of circle beads.For the square beads,the streamer is bundled into one beam and propagate towards the vertex of bead 2(figure 6(c2)),later the streamer extends along the left surface of bead 2 to the surface of the bottom dielectric layer,as shown in figures 6(c3) and (c4).The maximum electron densities are shown at the surface of the bottom dielectric layer.In addition,the electron densities at the vertex and the left surface of bead 2 are still enhanced.

Figure 7.The ion density (m-3) when the gap 2 is equal to 0.02 mm and the seed electrons are placed in the gap 1.
Figure 7 shows the ion density when the gap 2 is equal to 0.02 mm.The relationship with figures 2 and 3 is very similar to figures 6 and 7.The ion density is almost equal to the electron density,but there are still different,because in the plasma,the ion and electron density are in dynamic equilibrium and the graph in this paper is taken at one point.Note that different color scales used in figure 7 to clearly modify the profiles,for instance,the maximum ion density scale is half of the maximum electron density scale and the minimum ion density scale is an order of magnitude lower than the minimum electron density scale.For the circle beads,as shown in figure 7(a),a considerable part of the streamers is attracted by the beads 1,and most of the streamers is directed toward the surface of the beads 2,and obviously,the strongest ion density occurs on the surface of bead 2,which is almost the same with the case of electron density.For the triangle beads(figure 7(b)),two streamers are generated from the seed electrons,the left one extends toward the right surface of bead 1 then toward the surface of the bottom dielectric layer,while the right one extends toward the left surface of bead 2,and the strongest ion density occurs on the surface of bead 2.For the square beads,the strongest ion density occurs at the vertex of bead 2,and the ion density of the streamer directed from the place around the seed electrons to the vertex of bead 2 is relatively small.As shown in figure 7(c),volume discharge dominates in the case of square beads,which is distinctly different from the case of circle and triangle beads.
Figure 8 shows the ionization rate and excitation rate when the gap 2 is equal to 0.02 mm.It is clear that the ionization rate and excitation rate on the surface of three different bead shapes are highest,especially in the case of triangle beads,the SIWs are very strong and uniform,which is beneficial to plasma catalysis.The minimum ionization and excitation rates of three different cases are the same,as shown in figure 8,but the maximum excitation rates are one order of magnitude higher than the maximum ionization rates,which is consistent with the electron density and ion density (see in figures 6 and 7 above).
Figure 9 shows the ionization rate and excitation rate when the gap 2 is equal to 0.06 mm and the seed electrons are placed in the same position as in figure 8.As shown in figure 9,the minimum ionization and excitation rates are the same as 9.82×10¹⁷m-3s-1in all three cases.The maximum ionization rates in three cases are one order of magnitude lower than the maximum excitation rates,which is the same as in the case of figure 8.For the distance of gap 2 is longer,the discharge of plasma is much different from the case of figure 8.For the circle case,the discharge is still normal and the SIWs are strong.For the triangle case,the SIWs on the bead are not as strong as the case of circle packed beads,but the volume discharge is strong.For the square beads,the excitation rate on the surface of the bead below is in the order of 1023m-3s-1,while the ionization rate is around 1022m-3s-1,and the discharge is still dominated by volume discharge.
Figure 10 shows comparisons of electric fields and discharge modes when the seed electrons are placed in gap 1.The electric field distributions for the three different bead shapes are shown in figure 10 with the seed electrons placed in gap 1 for figures 10(a1)–(a3) gap 2 of 0.02 mm and figures 10(b1)–(b3) gap 2 of 0.06 mm.The streamers can be generated and propagated in two types (different distances between the cathode and the seed electrons).It is clear that in most cases,the maximum electric field occurs near the seed electrons,and there are still other points where the electric field strength is very strong.For the circle beads,as shown in figure 10(a1),the presence of the circle beads in the discharge greatly enhances the electric field on the surface of bead 2,and in the streamer between bead 2 and the bottom dielectric layer.The electric field distribution in figure 10(b1)is almost the same as figure 10(a1),but the streamers are more concentrated compared with figure 10(a1).
For the triangle beads,the electric field exhibits different distributions from the circle bead,the maximum electric field appears between the upper apex of bead 1 and the top dielectric layer,at the left surface of bead 2 and on the surface of the bottom dielectric layer,as shown in figure 10(a2).Indeed,the electric field at the contact point of bead 2 and the bottom dielectric layer (the point that x≈2.1 mm,y=0.35 mm) is also high.But the electric field distribution in figure 10(b2) is different from figure 10(a2).The surface discharge is much weaker in figure 10(b2),the maximum electric field appears at the seed electrons positions,where the streamers start,and on the surface of the bottom dielectric layer.Note that the positions of the maximum electric field in the two figures are similar,as the shape of beads affects the discharge characteristics.
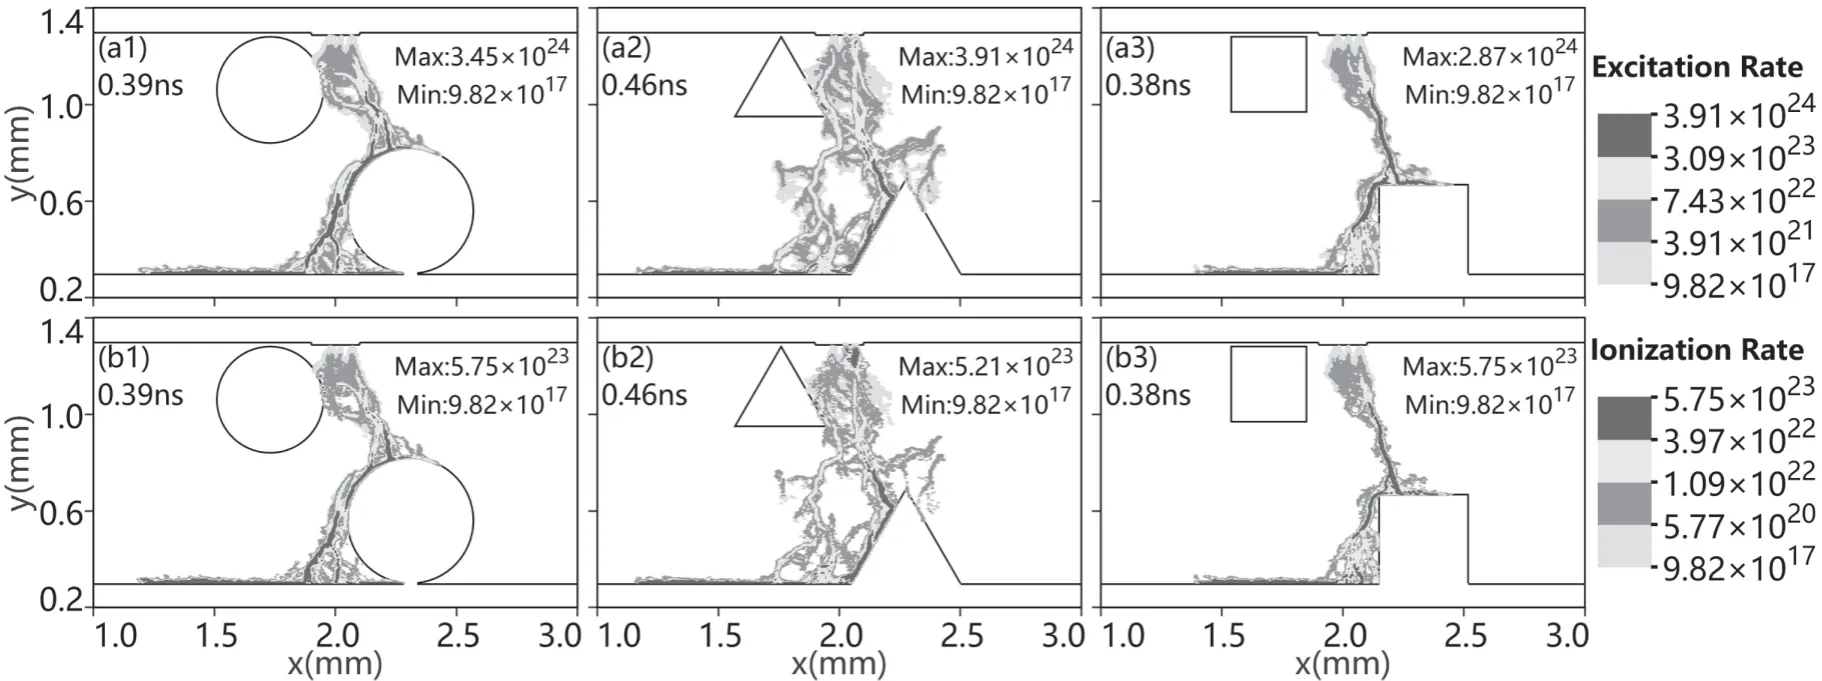
Figure 8.The ionization rate(m-3 s-1)and excitation rate(m-3 s-1)when the gap 2 is equal to 0.02 mm and the seed electrons are placed in the gap 1.
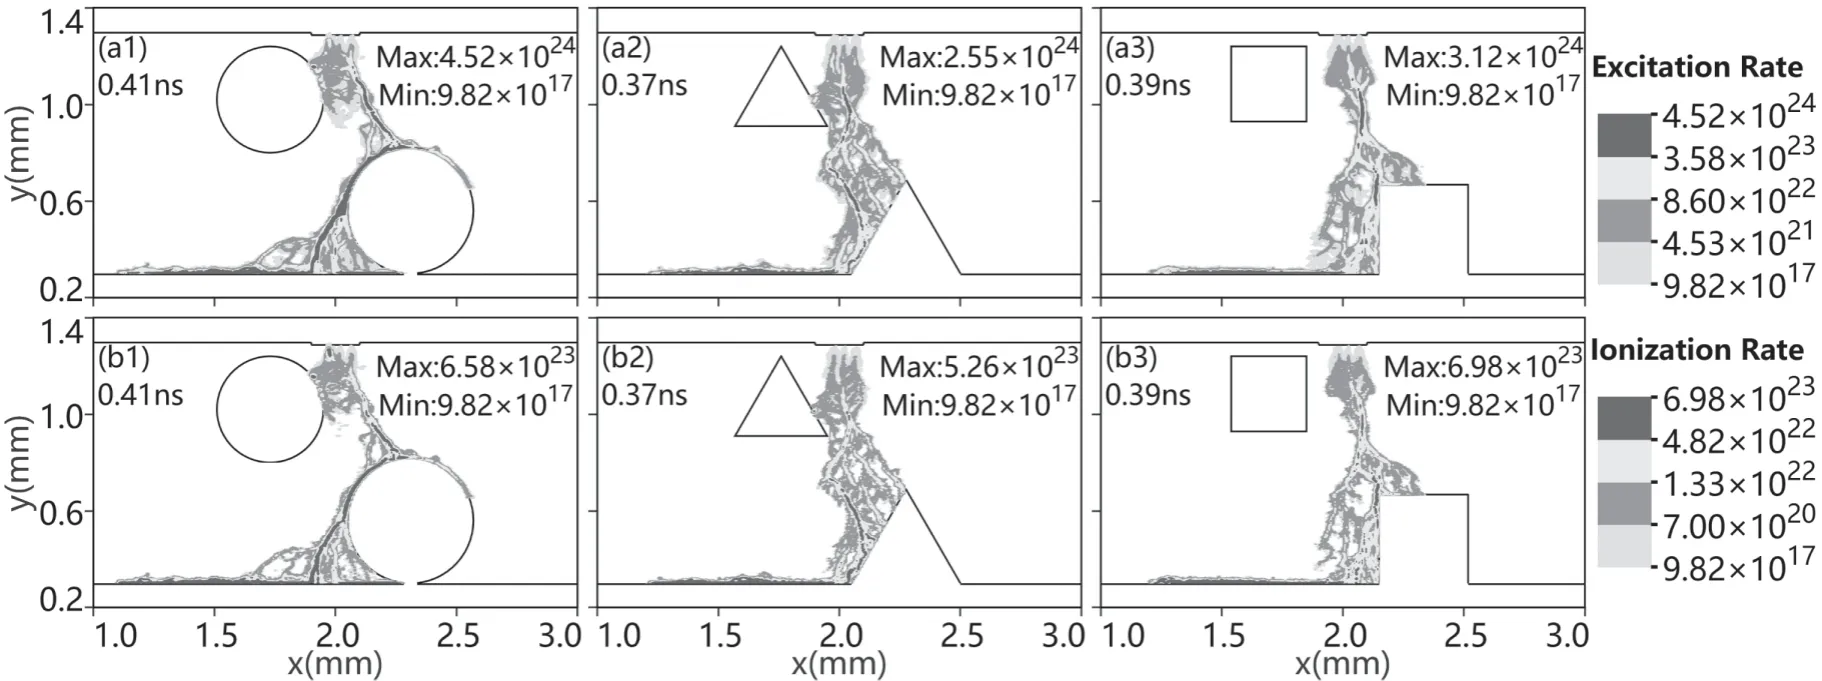
Figure 9.The ionization rate(m-3 s-1)and excitation rate(m-3 s-1)when the gap 2 is equal to 0.06 mm and the seed electrons are placed in the gap 1.
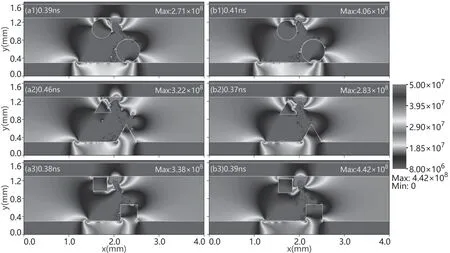
Figure 10.Comparisons of electric fields (V m-1) and discharge modes when the seed electrons are placed in the gap 1.
For the square beads,the electric field distribution is greatly different from those of circle beads and triangle beads,the electric field is enhanced in a very limited area.In figures 10(a3)and(b3),the electric field is enhanced between seed electrons and the top dielectric layer,between bead 1 and the top dielectric layer,at the contact point of bead 2 and the bottom dielectric layer,and on the surface of the bottom dielectric layer.As mentioned above,the geometric structure of beads inserted in the discharge greatly affects the electric potential,and the electric field near the tip structure can increase exponentially [53].
Comparing the circle packed beads (figures 10(a1) and(b1)),the discharge mode and the strengths of their electric field are almost the same.For the triangle bead,it is obvious that when gap 2 is equal to 0.02 mm(figure 10(a2)),SIWs are stronger and more uniform,while gap 2 is equal to 0.06 mm(figure 10(b2)),the volume discharge becomes dominant.For the square bead,the surface and volume discharges in figure 10(a3) are all stronger than in figure 10(b3),but the maximum electric field strength is lower,as the coupling is faster at the apex of the square near the seed electrons,thus the electric field is enhanced.
4.Conclusion
In this paper,we studied the effect of the different shapes of packed beads on the generation and propagation of plasma streamers,thus on the discharge mode,which is important for plasma catalysis.Three different shapes of beads (circle,triangle and square),and two cases of seed electron configurations are considered,i.e.in the first case,seed electrons are placed directly above the bead 1,the distances between the upper electrode (cathode) and seed electrons,i.e.gap 2 in figure 1,are set to 0.02 mm and 0.06 mm,in the second case,seed electrons are placed in the center of gap 1 (shown in figure 1),gap 2 of 0.02 mm and 0.06 mm.
For circle beads shape,the streamers can be generated and propagated in all cases with a certain strength of volume and surface discharge,while for triangle and square beads shapes,it requires certain conditions to generate streamers and SIWs.When the seed electrons are in the center of gap 1,a faster ionization avalanche occurs,causing the streamers to spread faster to the anode.When the seed electrons are located in the gap 1 and the distance from the upper electrode is 0.02 mm with circle or triangle beads,strong uniform SIWs are generated on the surface of the beads 2,which is very interested in plasma catalysis.In addition,the size of gap 2 between bead 1 and the top dielectric plate,also significantly influence the electric field enhancement,and thus in the streamer formation and propagation.
Therefore,our results indicate three different discharge modes with different bead shapes.For the cases of circle beads and triangle beads,the streamer is dominated by uniform surface discharge on the surface of beads 1,while both the surface-to-surface discharge and the volume discharge are relatively weak.For the square beads,the streamer is dominated by both the uniform surface discharge and uniform surface-to-surface discharge,while the volume discharge is very weak,inducing uniform and highly-concentrated charged species on the surfaces and in the gap between surfaces.
Acknowledgments
This work was supported by the National Magnetic Confinement Fusion Energy Research Project (Nos.2017YFE0301803 and 2015GB120003),National Natural Science Foundation of China (Nos.11775164 and 11775090),and the Fundamental Research Funds for the Central Universities(WUT:2017IVA79 and 2018IB011).
 Plasma Science and Technology2020年3期
- Plasma Science and Technology的其它文章
- DBD coupled with MnOx/γ-Al2O3 catalysts for the degradation of chlorobenzene
- Investigation on pulsed discharge mode in SF6-C2H6 mixtures
- Temporal evolution of atmospheric cascade glow discharge with pulsed discharge and radio frequency discharge
- Comparative analysis of the arc characteristics inside the convergingdiverging and cylindrical plasma torches
- 1,2,4-trichlorobenzene decomposition using non-thermal plasma technology
- Continuous compositional spread investigation of SiC-based thin films prepared by MW-ECR plasma enhanced magnetron co-sputtering
