Effects of fast ions produced by ICRF heating on the pressure at EAST
Zhen ZHENG(鄭振),Nong XIANG(項(xiàng)農(nóng)),Cheng YANG(楊程) and Yingfeng XU (徐穎峰)
1 Institute of Plasma Physics, Chinese Academy of Sciences, Hefei 230031, People’s Republic of China
2 University of Science and Technology of China, Hefei 230026, People’s Republic of China
3 Center for Magnetic Fusion Theory, Chinese Academy of Sciences, Hefei 230031, People’s Republic of China
Abstract Ion cyclotron resonance heating (ICRH), which can produce fast ions, is an important auxiliary heating method at EAST. To analyze the effect of ICRH-induced fast ions on the plasma pressure at EAST,simulations are performed using TRANSP and TORIC codes.It is found that the ICRF-induced fast ion pressure cannot be negligible when the ICRF power is sufficiently high.The magnitude of the total ion pressure can be raised up to 60%of the total pressure as the input power rises above 3 MW. The pressure profile is also significantly modified when the resonant layer is changed.It is shown that by changing the wave frequency and antenna position,the total ion pressure profile can be broadened,which might provide an option for profile control at EAST.
Keywords: ICRH, equilibrium, fast ion, pressure, minority heating
1. Introduction
Plasma equilibrium [1-5], which is comprised of the plasma geometry and important profiles of the plasma pressure,current,and safety factor, plays an important role in analyzing the experimental data, magneto-hydrodynamic (MHD) activities,and transport process. The fast ions produced by neutral beam injection(NBI)and ion cyclotron resonance heating(ICRH)can trigger many interesting physics, e.g. edge-localized modes [6]and Alfvén eigenmodes [7]. In addition, they can contribute to the plasma pressure greatly and affect the plasma equilibrium.There are several methods and numerical codes developed for equilibrium reconstruction. In this paper, the equilibrium is obtained using EFIT code [1, 2].
Recently, a variety of high-performance experiments have been successfully performed on the EAST tokamak[6-10]. These experiments aimed to explore how the plasma would behave under the high-performance conditions. ICRH is one of important auxiliary heating methods at EAST,which can produce considerable fast ions.Fast ions can contribute to the plasma pressure at EAST, which can influence the MHD activities and plasma confinement. The effects of fast ions produced by NBI on the EAST equilibrium have been discussed in the previous work [11]. In this work, we discuss how ICRH-induced fast ions affect the plasma pressure when high ICRH power is used at EAST.
The injection of waves in the ion cyclotron range of frequencies is a well-established method of heating and current drive in the tokamak. At EAST, the minority heating scheme is chosen to heat ions. The wave power is mainly absorbed through collisionless wave-particle interactions by hydrogen ions,which are then slowed down via electron drag or collisions with the background ions. More recently, much measured information related to ICRH has been obtained on EAST, indicating the existence of a considerable number of fast ions [12, 13]. To analyze the diagnostic data and understand the physical processes involved, a reliable equilibrium is needed which should include contribution of fast ions. In this paper, the TRANSP /TORIC [14, 15] codes are adopted to calculate the power deposition during ICRF and the resulting fast ion pressure. To demonstrate the fast ion effects on plasma pressure, the dependence of the fast ion pressure on the input power is discussed.
It is well known that the bootstrap current strongly depends on the plasma pressure gradient, and many MHD instabilities such as the neoclassical tearing mode(NTM)and ballooning modes are determined by the bootstrap current gradient. The importance of the bootstrap current for tokamaks has already been pointed out[16,17].It has been shown that a high bootstrap current would improve prospects for energy production[18].Moreover,a high bootstrap fraction is beneficial for the high-performance phase of ITER and CFETR[19,20].Therefore,whether the plasma pressure can be modified by fast ions is of interest. It is shown that the pressure profile can be modified by changing the position of the power deposition and the fast ion pressure, ultimately promoting the bootstrap and resulting in hollow current and reverse q profile.To achieve this aim,we simulate the effects of different antenna positions, resonance layer positions, and ICRF powers on the plasma equilibrium.
This paper is organized as follows. The numerical tools,including TRANSP and TORIC, are introduced in section 2.Section 3 shows the simulation results of the effects of fast ions induced by ICRF waves on the dependence of the RF power, RF frequency, and antenna positions. The summary and discussion are presented in section 4.
2. Physical model and simulation setup
The equilibrium used in this paper is based on the previous work on kinetic equilibrium reconstruction for the H-mode plasma on the EAST tokamak [11]. The electron and ion temperature profiles, as a function of the square root of the normalized toroidal flux, ρ, are shown in figure 1(a). The electron density profile is shown in figure 1(b). For this discharge, the toroidal magnetic field is about 2.25 T.The plasma consists of hydrogen(H),deuterium(D),and impurity ions.The H ion concentration is 3.4%. The equilibrium and fundamental cyclotron resonance for H and the second harmonic for D ions with the wave frequency of 34 MHz are plotted in figure 1(c). There are two ICRF antennas located at windows B and I, whose frequencies andφn (the toroidal mode number) spectrum are nearly the same. They are both in the equatorial plane. Since the fast ion pressure is our primary concern and the fast ion pressure produced by the ICRF heating mainly depends on the input power,wave frequency and antenna position as shown later.We assume that there is one ICRH antenna launching a wave with the toroidal mode numberφn = 23 for the sake of simplicity.
The TRANSP code has been applied to compute fast ion distribution functions. It requires the plasma equilibrium and kinetic profiles. TRANSP then applies an equilibrium solver taking the plasma pressure and bootstrap current into account.When TRANSP calculates the total fast ion pressure, a fullwave code is needed to analyze physical quantities related to fast ions,such as the wave distribution and power deposition.

Figure 1.Measured and fitted profiles of (a) electron density, (b)electron temperature, and ion temperature. (c) Position of the main resonance layer for fRF = 34 MHz on EAST; n is the harmonic number of ICRH.
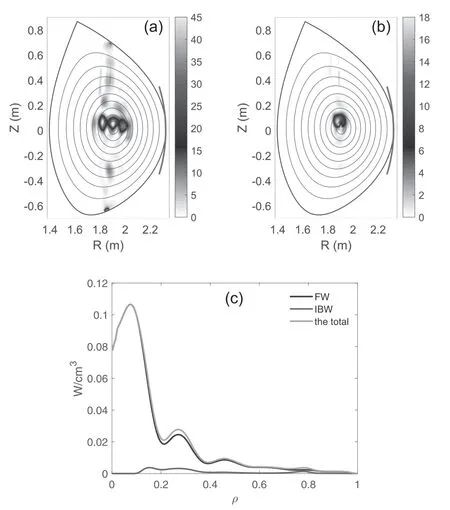
Figure 2.2D profiles of power density to (a) minority ions and (b)bulk ions,in W/cm3.(c)Power density to electrons absorbed by the fast wave and IBW.
TORIC has been widely used to study the ion cyclotron wave propagation and power deposition in the tokamak plasma[21-24].The physics for ICRF are well described in the TORIC solver including the wave propagation, mode conversion, and power deposition in a tokamak.It has been successfully applied to the design and modeling work on the ICRF heating scenarios on EAST [25, 26]. The Maxwell’s wave equation for ICRF in arbitrary axisymmetric toroidal geometry,including the tokamak equilibrium, can be solved in TORIC:
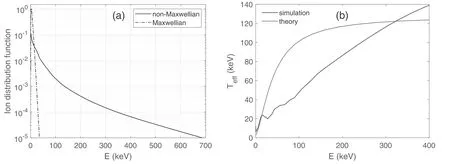
Figure 3.(a) Hydrogen ion energy distribution function (normalized) at ρ = 0.025. (b) Effective temperature.

where E is the wave electric feild,represents the antenna current,andis the response current of the plasma derived by solving the linear Vlasov equation based on the fniite Larmor radius assumption [15, 27].
In TRANSP,the FPPRF[28]module computes the minority ion phase space distribution. This module uses the bouncedaveraged Fokker Planck equationin whichμ is the magnetic moment,C is the bounced-averaged and linearized collision operator, Q is the complete bounce-averaged quasilinear operator, S represents sources and sinks, and R is a radial transport operator.
In this work, we focus on the effect of the fast ion produced by ICRF heating on the plasma pressure. We choose the equilibrium of #62585@3.8 s because of the good measurements of temperature and density profiles, which can be used for the equilibrium.We use TORIC in TRANSP to give out the wave distribution and power deposition; then the fast ion pressure can be obtained by FPPRF.
3. Simulation results
3.1. Fast ion pressure for 1.6 MW RF power
Firstly, we simulate the case with fRF= 34 MHz and 1.6 MW of RF power. The cyclotron resonance of the hydrogen ions is located at R = 1.9 m. Figures 2(a) and (b) illustrate the power deposition to the minority ions and deuteron ions.The width of the resonance region observed in figures 2(a) and (b) is conditioned by the Doppler shift from equationThe simulation shows that most of the power is deposited in the core region. About 77.7% power is transferred to the minority ions via H fundamental cyclotron resonance. The fraction of power directly absorbed by the electrons via transit time magnetic pumping and Landau damping is 7.2%.The power to deuteron ions is about 11.2% via D harmonic cyclotron resonance.The remaining 3.9%of the power goes to the impurities.It can be seen that the electron absorption is very weak.Figure 2(c) indicates that most of the power damping by electrons is from the fast wave.Nevertheless,the ion heating is very effective, as about 90% of total absorbed power goes to ions,and the minority ion heating dominates,as the minority ions are effectively heated in the core region.This can be seen clearly in figure 3.
The heating of ICRF dramatically increases the perpendicular energy of minority ions through the collisionless,wave-particle resonant interaction in the resonance region,which will cause a part of the minority ions to become anisotropic. As a result, a large minority H tail is formed (see figure 3(a)) and fast ions are generated. These fast ions deliver their energy to the bulk ions via collision, heating the plasma.The ions with energies over the critical energy [29] =Ecrabout 33 keV, will primarily transfer their energy to electrons.Fast ions will contribute to the total pressure, which is what we are concerned with in this paper.This tail temperature can be estimated by Stix’s isotropic model [30]. In this model, when E approaches infinity, Teffapproaches the asymptotic value127 keV.This shows a good agreement between the theoretical and simulation models when E < 14 keV (see figure 3(b)). The effective tail temperatures for the two models are different but have the same order when E > 14 keV;a possible reason is that the theoretical curve is from a simple isotropic model,which is less precise than the anisotropic model used in the simulations as mentioned in section 2.
Once the H distribution function is obtained, the fast ion pressure is then determined. As can be seen from figure 4,the fast ion pressure peak appears in the core region where the power is mainly deposited.The contribution of fast ions to the total pressure in the core region is about 40%,while it is less than 5%in the edge region.Clearly,the pressure is unaffected for ρ > 0.4. Such a weak effect of fast ions on the total pressure might be due to the low input power.Since the ICRF system at EAST has the capability of a 12 MW power source,it is necessary to find out the fast ion contribution to the total pressure with higher input power.
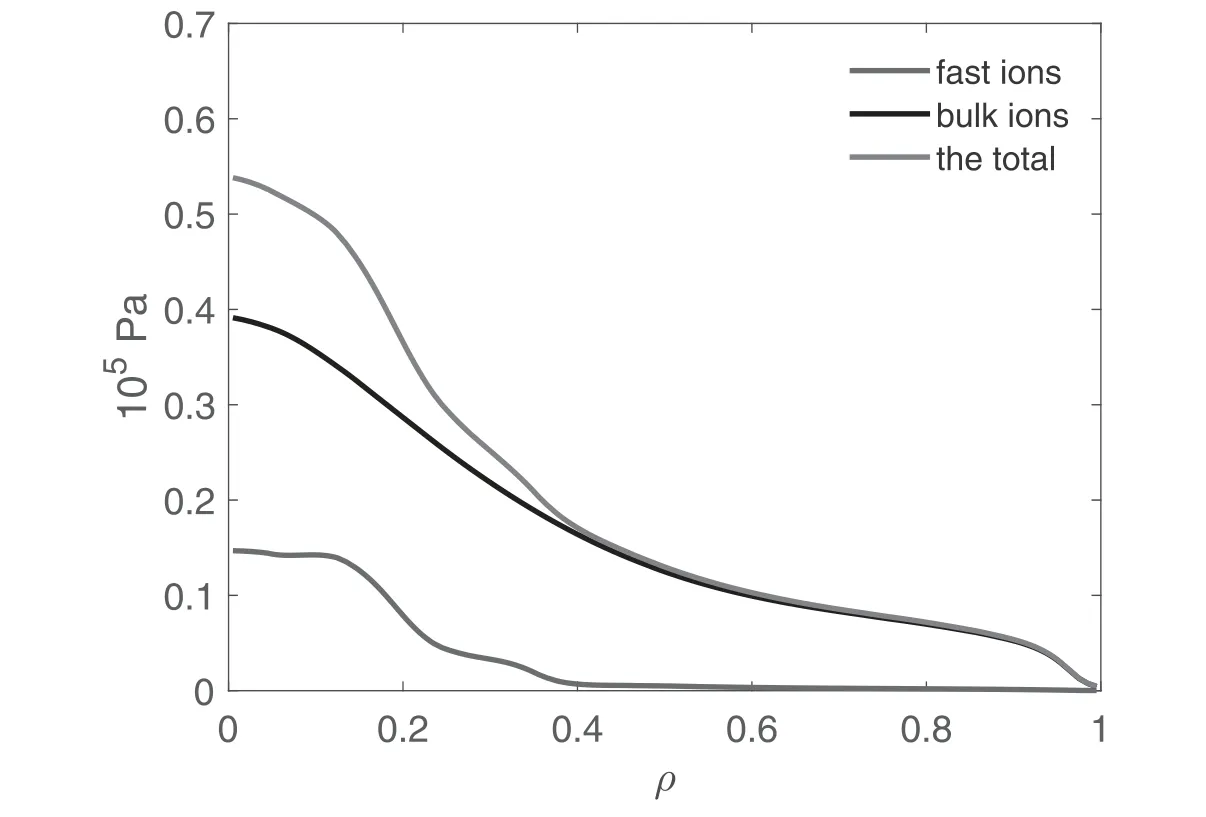
Figure 4.Fast ion pressure (red line), bulk ion (D) pressure (black line) and total pressure (magenta line).
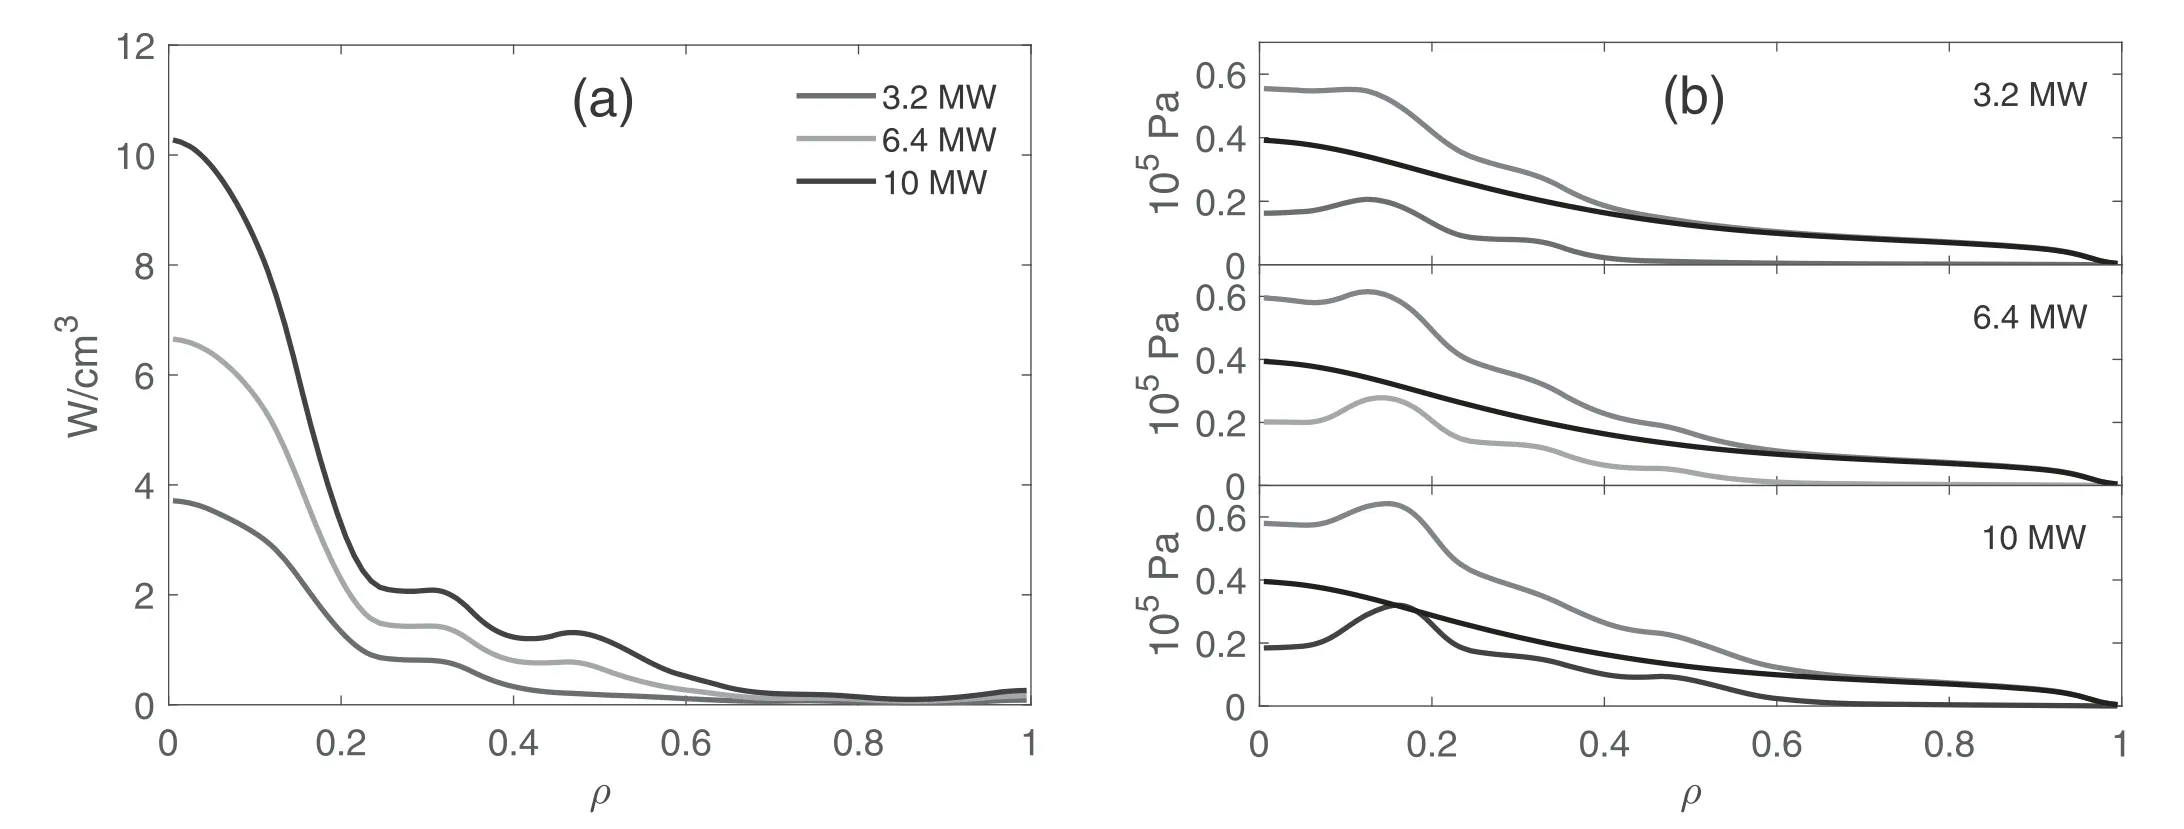
Figure 5.(a)Power density profiles with different RF powers.(b)Fast ion pressures,background pressures,and total pressures with different RF powers. Black lines represent the background pressures, and magenta lines represent the total pressures. Red, green, and blue lines represent the fast ion pressures at 3.2, 6.4, and 10 MW, respectively.
3.2. Dependence of fast ion pressure on RF power
The simulations are carried out with a scan of RF powers from 3.2 to 10 MW. The profiles of fast ion pressure and power density are plotted in figures 5(a) and (b). It can be found that the profiles of both pressure and power density increase with the increase in RF power, as expected. The powers are all deposited in the core region, and the background pressures are all the same. Then we examinenamely the ratio of the fast ion pressure to the background pressure. At the peaks,is 0.59, 0.85, and 1.0,respectively, for the cases in which the wave power is 3.2,6.4, and 10 MW. Clearly, theincreases with the RF input power.When the input power is larger than 3.2 MW,the maximum value ofis larger than 0.5, which means that the fast ion pressure is significant. The value ofincreases with the input power even in the outer region, for example at ρ = 0.5.decreases rapidly when moving outward to the plasma edge. The fast ion effects almost disappear for ρ > 0.6, even for 10 MW input power.
The location of the peak of the fast ion pressure should be noted.The position of the power density in the core region is within ρ = 0.3, just as depicted in figure 2(a). The power density and the fast ion pressure are close from the axis.However, the fast ions have their own banana orbits, and a flux surface average should be done on the fast ion pressure first. Also, the pressure is independent of the volume. As a result, the locations of the peaks of the fast ion pressure and power density are different but still close to the axis, within 0.1 < ρ < 0.3.
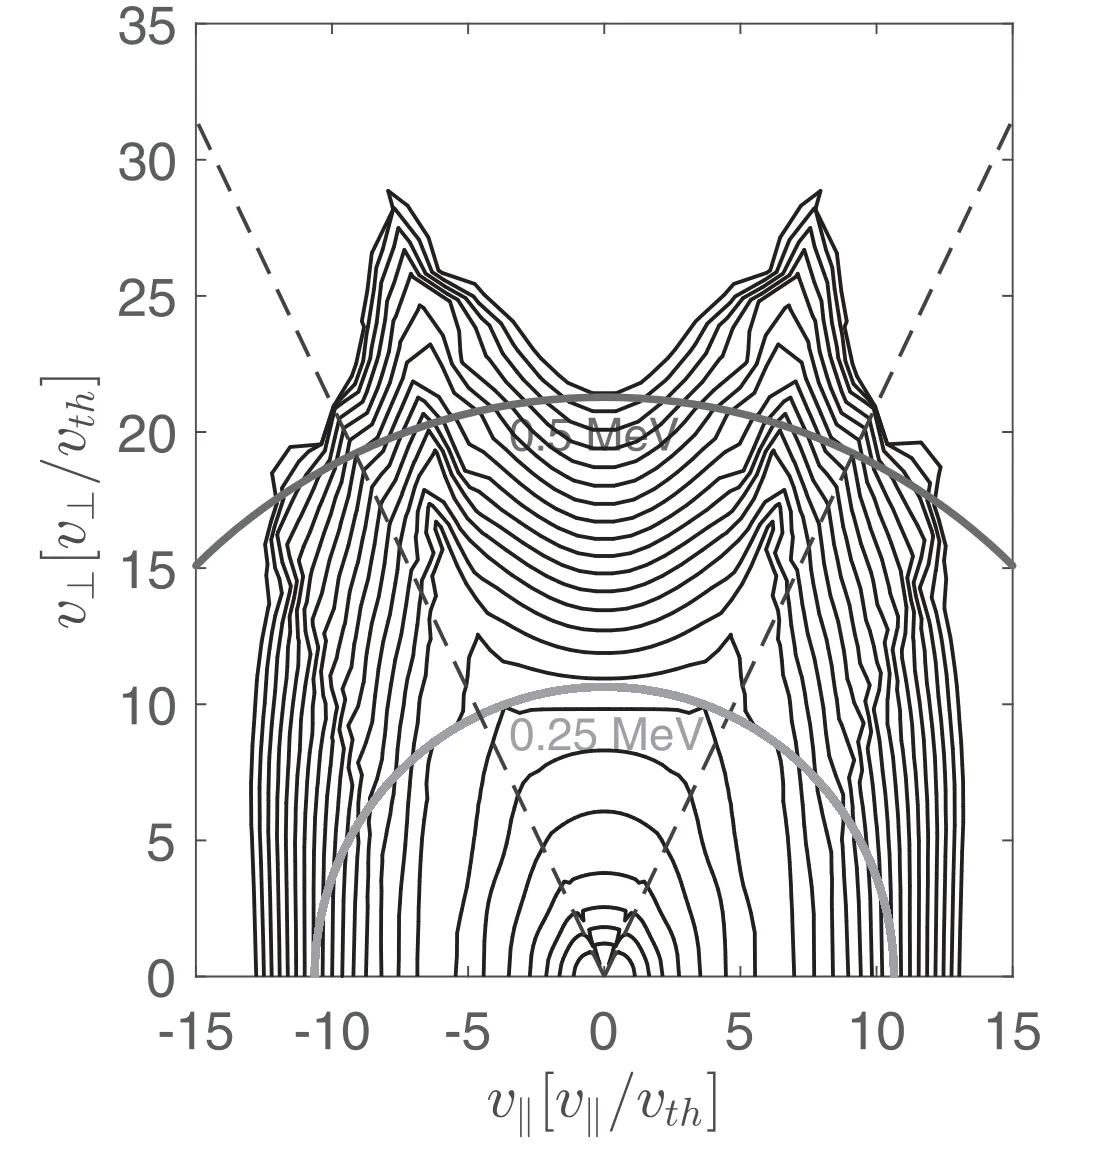
Figure 6.The hydrogen ion distribution function in velocity coordinate at ρ = 0.475 with 10 MW. Two energy levels, 0.25 and 0.5 MeV, are shown.
The contours of hydrogen ion distribution function in the velocity space coordinate at ρ = 0.475 is shown in figure 6.We can see that the velocity distribution is anisotropic and that the contour has a‘rabbit-ear’shape.The‘ears’are inside the passing-trapped boundary. The ‘ear’ shape of the contours shown in figure 6 is similar to the previous results[31-33]. The anisotropy and ear-like features suggest that a large number of trapped particles are produced. The tips of‘ears’are related to the trapped particles whose banana tips lie on the resonance layer. The ‘ears’ are a result of the fast ion resonance localization. The ICRF wave gives primarily particles perpendicular energy through wave-particle interaction,and thus resonant passing particles are turned to trapped particles. The ICRF heating trends to produce energetic trapped particles with banana tips near the resonant layer.
The simulation results of the on-axis heating indicate that the equilibrium in the core region is significantly modified as the input power exceeds 3.2 MW. This is because the cyclotron resonances are located in the core region where fast ions are produced.It can be expected that as the resonance is moved outward by changing the wave frequency and antenna position, off-axis heating might occur [34, 35]. As a result,the total pressures might be modified in the outer region,which is discussed in the following sections.
3.3. Dependence of fast ion pressure on RF frequency
The hydrogen resonance location along the major radius from the central region can be shifted to the low-field side by changing the RF wave frequency from 34 to 30 MHz with 1.6 MW RF power. Figure 7 shows the resonance layers of different frequencies.
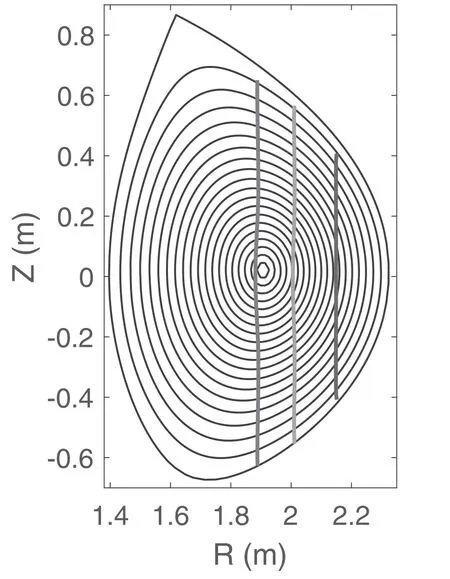
Figure 7.Resonance layers at 34 MHz (magenta), 32 MHz (green)and 30 MHz (red).
Figure 8 shows the power deposition to minority ions for the wave frequencies of 32 and 30 MHz. Generally, the fast wave is launched from different positions of the antenna,propagating toward the core region and being enhanced. In the off-axis heating case, the wave meets the resonance layer first. The wave resonates with the minority ions in the mid-ρ region and deposits the power here.With the resonance layer moving to the low-field side,more power will be deposited in the mid-ρ region. Consequently, the fast ion pressure profile is significant only off-axis.
The power density and fast ion pressure profiles for different incident frequencies are illustrated in figure 9. It is observed in figure 9(a)that as the frequency decreases from 34 to 32 MHz, the peaks of the power density profiles are still located in the core,but the peak of the latter is lower and more wave energy is deposited in the mid-ρ region.Accordingly,the peaks of the fast pressure profiles for the two cases appear in the core region while the fast pressure is broader for the lowerfrequency case. As the frequency becomes 30 MHz, a significant portion of the wave energy is deposited in the outer region, as shown in figure 8(b). As can be seen in figure 9(a),the peak of the power density profiles moves towards the mid-ρ region.Meanwhile the fast ion pressure peaks around ρ = 0.3 because the ion density increases rapidly with ρ.
In summary,as the frequency decreases,more power will be deposited in the outer region due to the fact that the cyclotron resonance moves from the core region to the outer region. Accordingly, the peak of the fast ion pressure also moves outwards and the fast ion pressure is greatly broadened. Such modification of the fast ion pressure should be more significant with a higher input power.Therefore,we will illustrate how the ion pressure can be modified by varying the cyclotron resonances.
We choose the case in which the frequency is 30 MHz,and increase the power to 6.4 MW to find out how the fast ion pressure will change with a higher power. The power density and fast ion pressure are shown in figure 10. It can be found that both the power density and the pressure increase dramatically. The pressure broadens in the region of ρ = 0.2-0.3,and the pressure in ρ = 0.7 also rises.Generally,the profile is broadened in the region of ρ = 0.1-0.8. It is as expected to broaden the profile off-axis. By choosing appropriate frequencies with more antennas, the fast ion pressure can be more important in the outer region.
3.4. Dependence of fast ion pressure on antenna positions
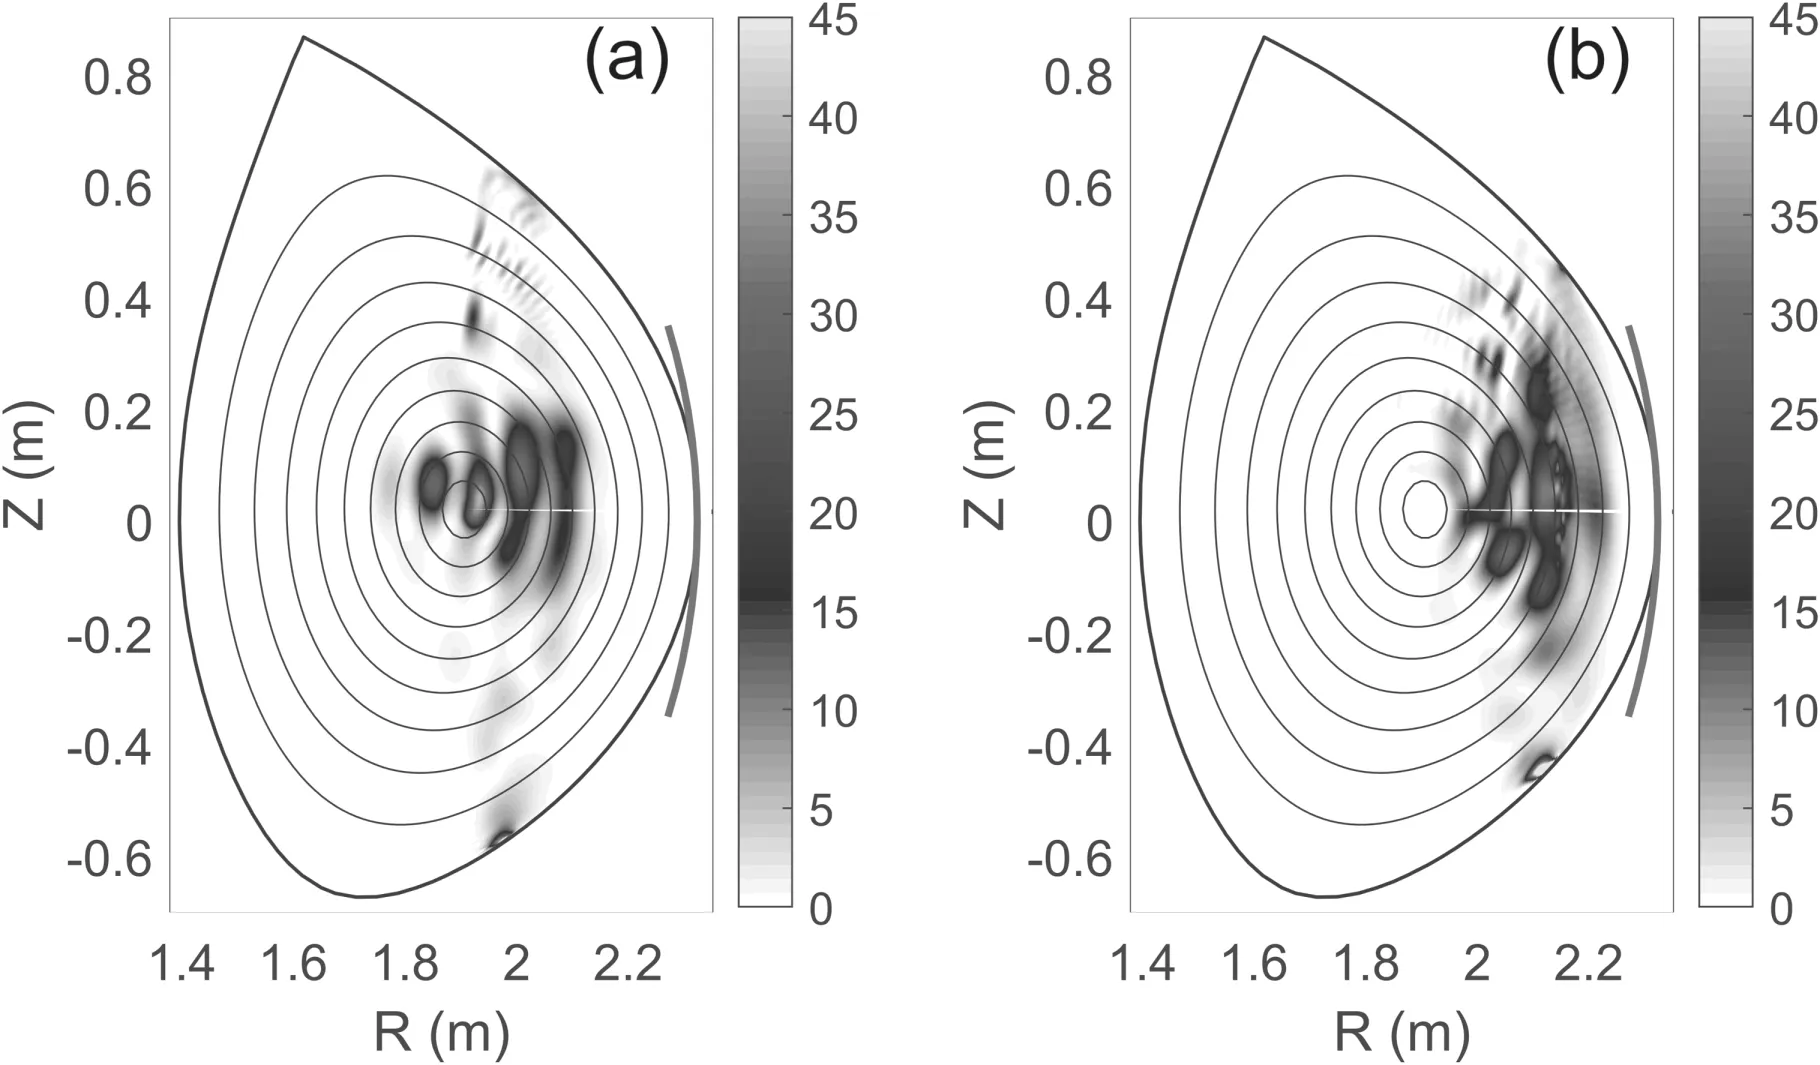
Figure 8.2D profiles of power density to minority ions for (a) 32 and (b) 30 MHz, in W/cm3.
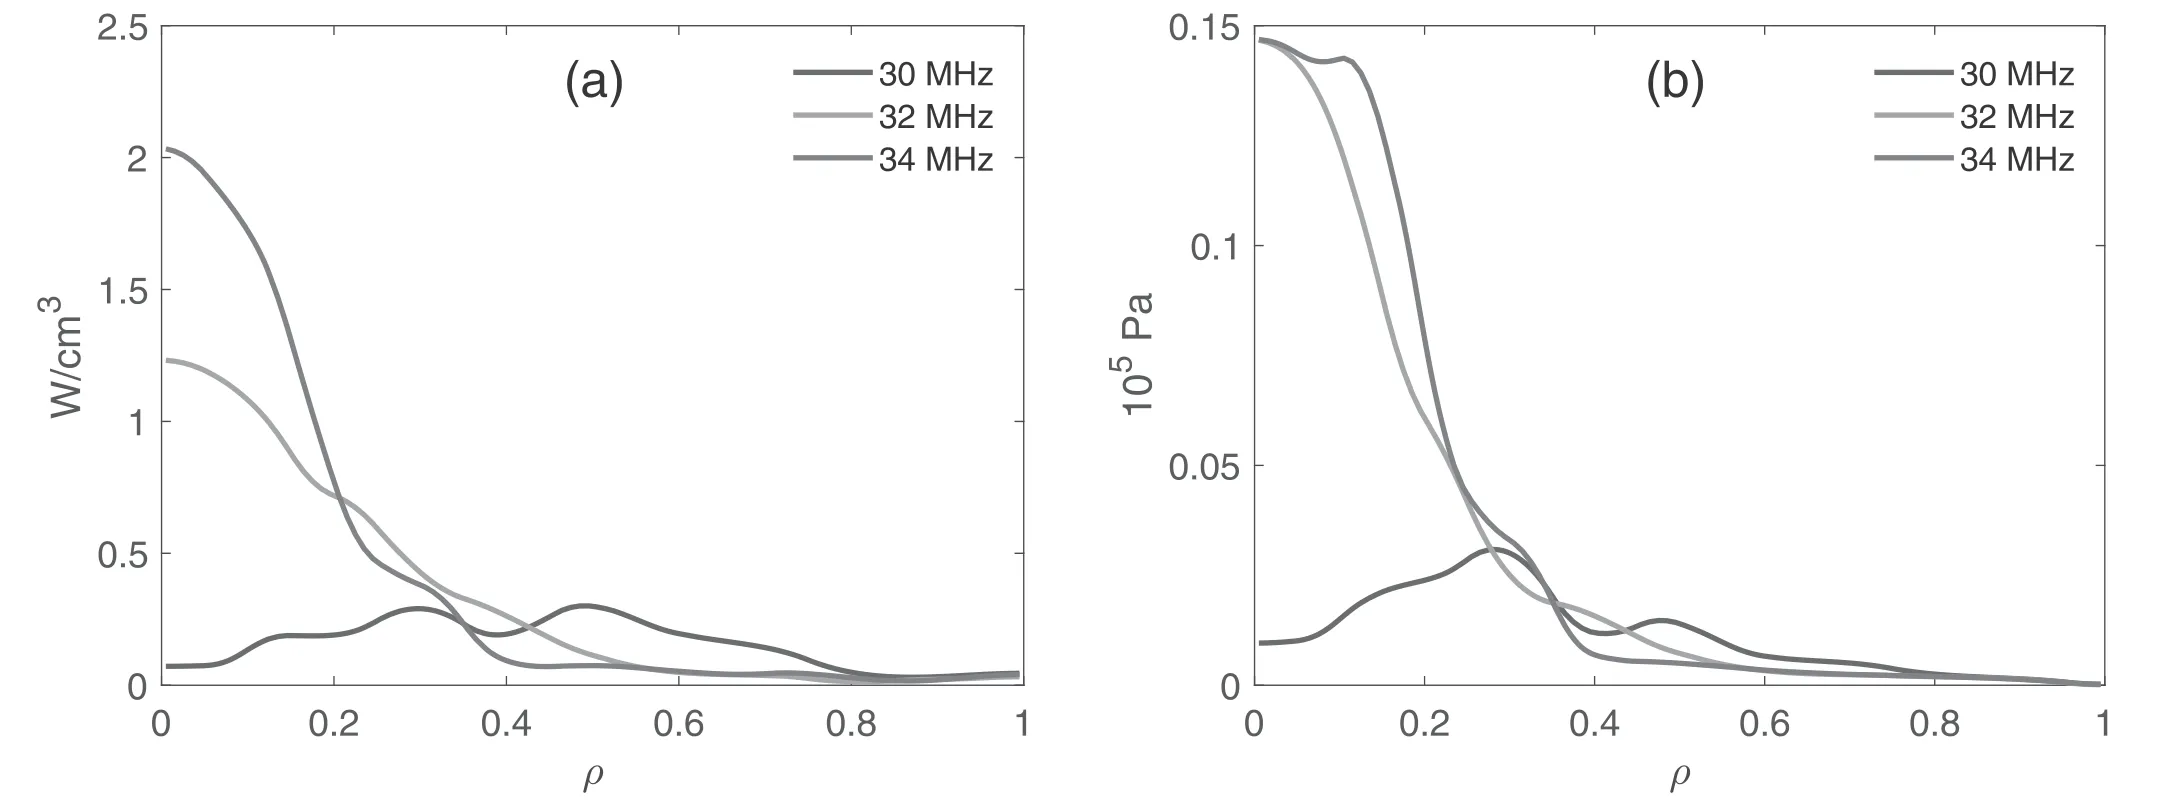
Figure 9.(a) Power density profiles at different frequencies. (b) Fast ion pressure profiles at different frequencies.
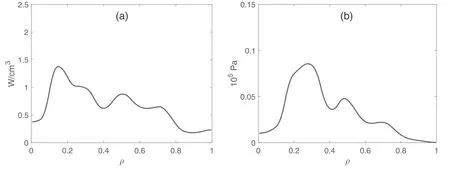
Figure 10.(a) Power density and (b) fast ion pressure profile at the frequency of 30 MHz and power of 6.4 MW.
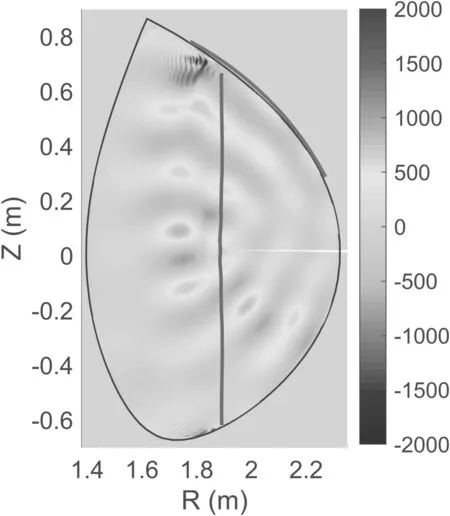
Figure 11.Distribution of the electric field as the wave is launched from the antenna at the upper right side.
As just shown, the fast ion pressure strongly relies on how the incident wave arrives at the resonant layer where the power is deposited.When the wave reaches the resonant layer at the outer region,the fast ion pressure could be much broadened as shown in figure 10(b), in which the resonance layer does not pass the core region.Thus we can imagine that for a given resonant layer,as shown in figure 1,the wave power could be absorbed in the outer region if the antenna is moved to the upper right side.Considering the geometries of the plasma and the antenna, the wave might not focus in the core region but propagate towards the off-axis region and then turn downward. Sometimes the wave reflects in the lower right side. During this process, the wave may penetrate the resonance layer once or several times,or never reach it, depending on where the wave is launched,φn ,and the location of the resonance layer.The footprint where the wave reaches the resonance layer is the power density region;as it is weak when the wave reaches the resonance layer at the second time, the power is mainly deposited in the first pass.Consequently, the power density and fast ion pressure profiles are expected off-axis. Figure 11 gives an example of how the wave propagates from the upper right side.
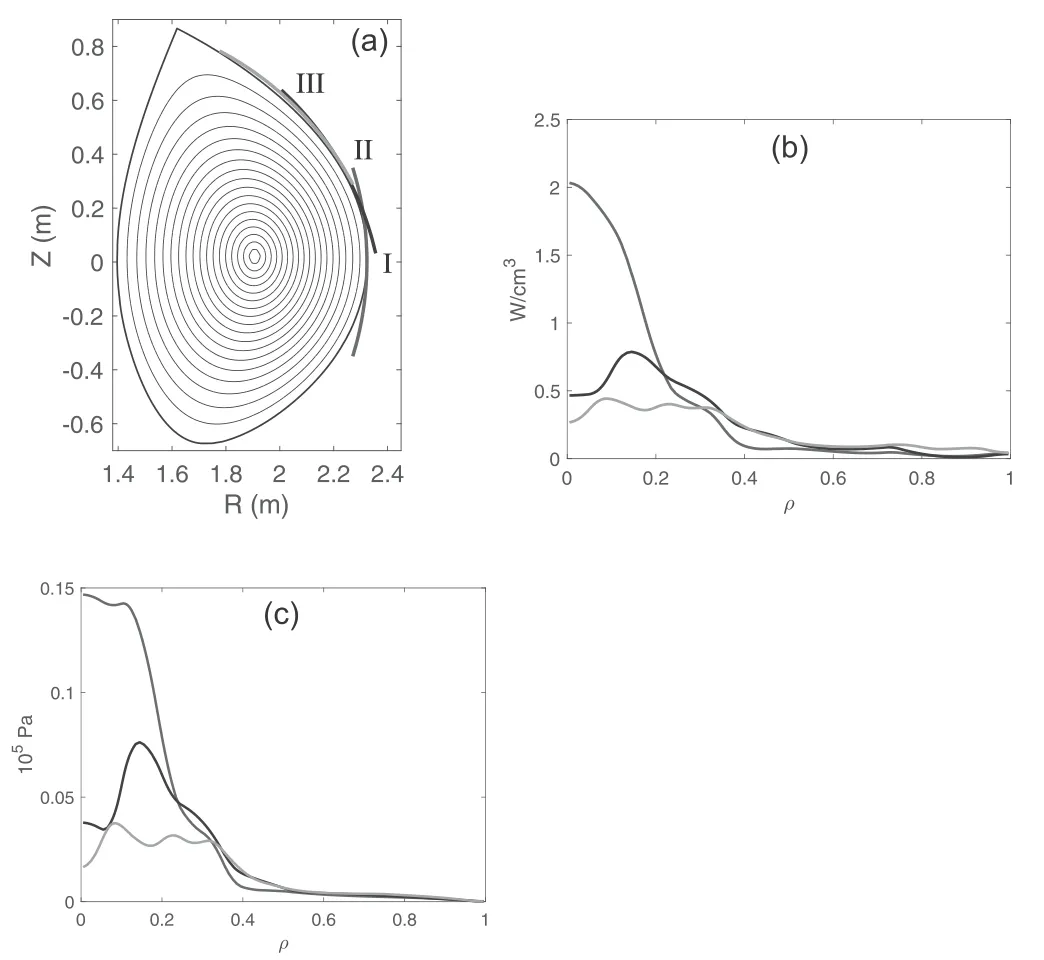
Figure 12.Profiles with different antenna positions. Red curves represent antenna position I, blue curves represent position II, and green curves represent position III. (a) Three antenna positions chosen to launch the fast wave. (b) Power density profiles. (c) Fast ion pressure profiles.
To study the effect of different antenna positions on the plasma, three positions (I, II, III) are set as depicted in figure 2(a). The RF wave frequency is 34 MHz and the RF power is 1.6 MW. Figures 12(b)-(c) illustrate the power density and the fast ion pressure.It can be found that the peak of the power density profile moves towards the outside and decreases as the antenna position changes from the middle plane to the upper side and the profile broadens in position III.The peak of the pressure profile is found to be related to that of the power density.In position I,the peaks of profiles are in the central region,within ρ < 0.4.As the antenna goes up to II, the fast ion pressure in the core region drops dramatically and the peak moves from ρ = 0 to ρ = 0.15. At ρ = 0.18,= 0.2.It can be noticed that the pressure rises and gets broader in the region 0.25 < ρ < 0.5. In position III, the profile becomes much lower but broadened and flattened. At ρ = 0.18,= 0.1. In the off-axis region, compared with position II, the profile rises little. In addition, all the profiles of the three positions are within ρ < 0.5. It is expected that the profile in the edge region will rise under a high-power injection, as mentioned before.
We choose the case at antenna position III, with RF powers scanning from 1.6 to 10 MW,to find out how the fast ion pressure will change with a higher power.The results are shown in figure 13. In antenna position III, the results are similar to those in antenna position I. Clearly, the pressure increases with power for all the profiles. The power density profiles, compared with the results in figure 12(c), rise apparently in the edge region. At ρ = 0.1,is 0.09,0.15, 0.26, and 0.37, respectively, which is much lower but flatter than that in antenna position I case.At ρ = 0.5,is 0.05,0.13,0.32,and 0.5,respectively,which is close to the result in antenna position I.In addition, the profiles rise even in the edge region with ρ > 0.6. Generally speaking, the pressure profiles become flatter in the outer region.
4. Summary and discussion
In this work, with different RF frequencies, RF powers, and antenna positions,the contribution of fast ions induced by ICRF to the plasma pressure is studied using TRANSP ad TORIC codes. Firstly, we simulate the case with fRF= 34 MHz and 1.6 MW of RF power. The ion distribution function is also given,which shows that numerous fast ions are generated by the heating of ICRF. Next, we simulate on-axis minority heating cases with different RF powers,and it is found that the fast ion pressure in the edge region cannot be affected by the on-axis heating. When the power is over 3.2 MW for the on-axis heating, the contribution of fast ions induced by ICRF cannot be neglected. Then we simulate cases with different RF frequencies,and it is found that the fast ion pressure profile can be broadened through off-axis heating and, moreover, that the fast ion pressure in the edge region can be increased.Finally,by changing the antenna position,we find that the fast ion pressure can also be broadened and even made flatter as the antenna position moves up. We also discover how the fast ion pressure changes at different RF powers in the antenna position III.
In our simulations, we use the RF power 10 MW. This is actually too high for EAST,and it may cause the fast ions to not be constrained by the magnetic field, eventually leading to fast ion losses to the first wall.In addition,the absorption efficiency of ICRF at EAST is about 40%-50%, and the technique of changing the antenna position is not feasible right now. However, the simulations still provide some reasonable predictions and give us some idea as to how the waves propagate from different launch locations and how this affects the profile of the fast ion pressure in the resonance region.This will be helpful,for example, in optimizing the antenna design in the future. Changing the frequency and the antenna position will broaden the peak of the pressure profile. By choosing appropriate RF frequencies and antenna positions, the purpose of controlling the fast ion pressure profile can be achieved,ultimately generating a broadened bootstrap current. A broadened bootstrap profile in the core region is beneficial to high-bootstrap and high-βNoperation in future devices such as ITER and CFETR.The width of the improved core confinement region should be large enough to avoid the development of a narrow domain with a too localized and very steep pressure gradient [36].
Acknowledgments
The authors would like to thank Doctors Guosheng Xu,Damao Yao, and Yongliang Li for helpful discussions.This work was supported by the National Key R&D Program of China (Nos. 2017YFE0300400 and 2017YFE0300406),and National Natural Science Foundation of China (Nos.11575239 and 11775265).
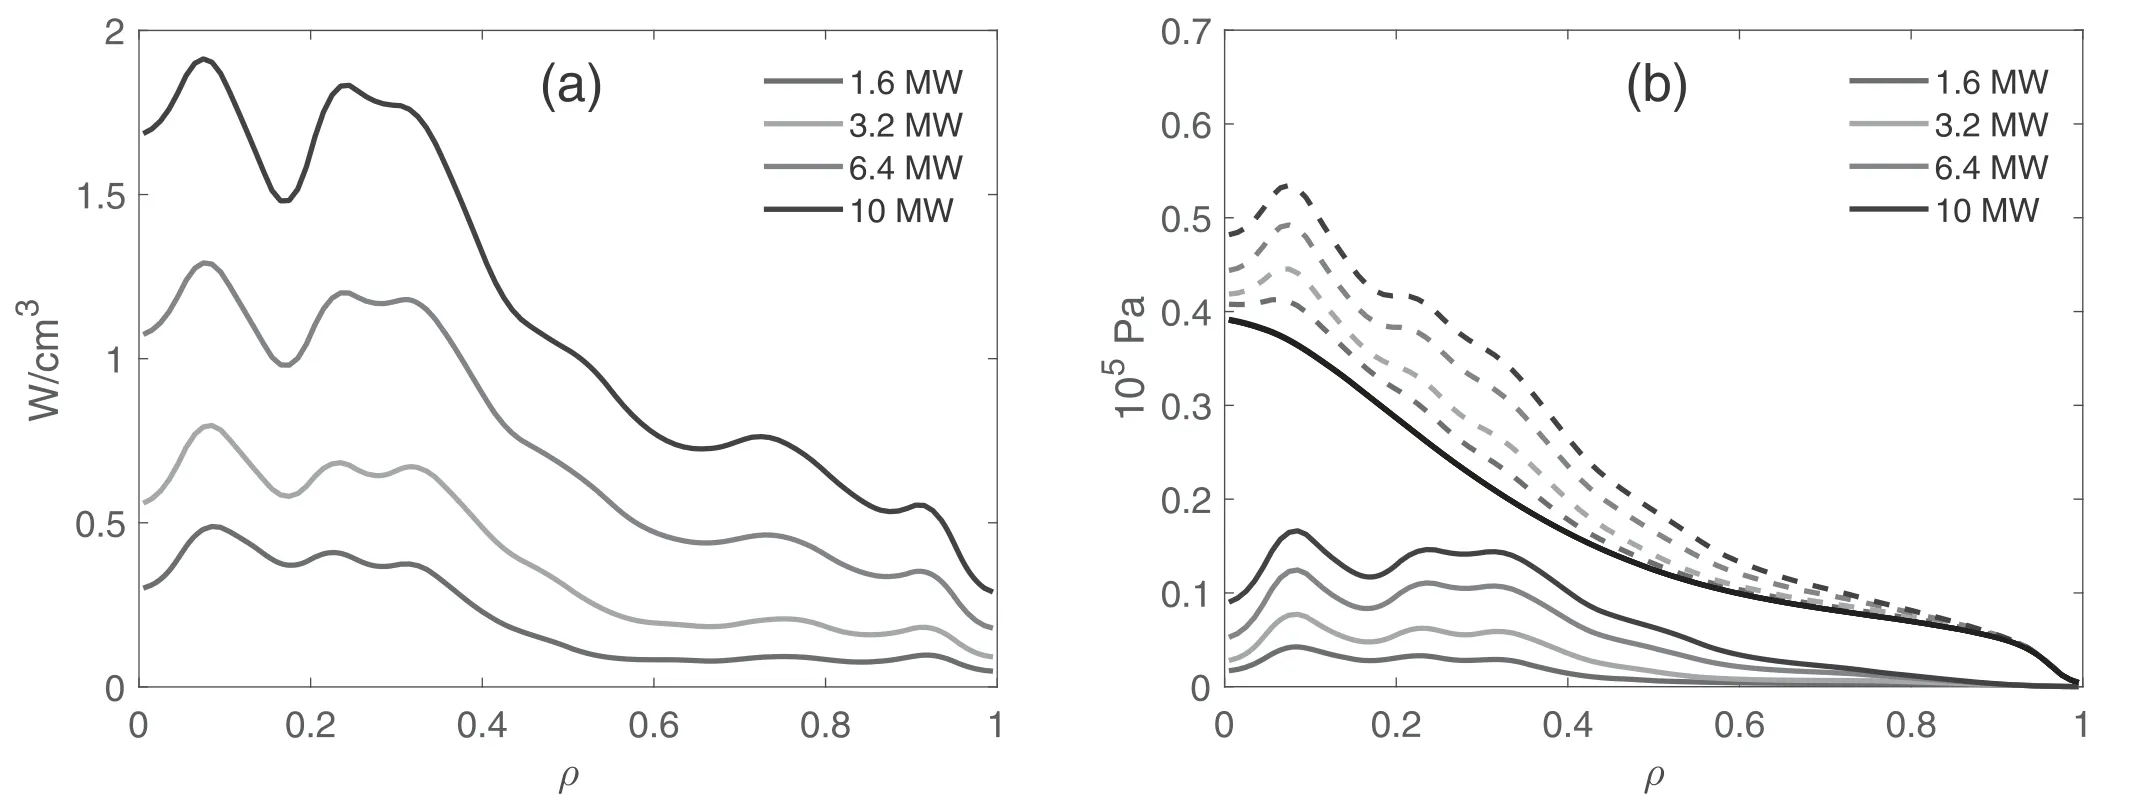
Figure 13.(a)Power densities with different RF powers in antenna position III.(b)Fast ion pressure profiles(solid lines)and total pressure profiles (dash lines) at different RF powers in antenna position III; black line represents the background pressure.
ORCID iDs
Zhen ZHENG (鄭振)https://orcid.org/0000-0001-6866-1903
 Plasma Science and Technology2020年2期
- Plasma Science and Technology的其它文章
- Analysis of the characteristics of the plasma of an RF driven ion source for a neutral beam injector
- Synthesis of vertical graphene nanowalls by cracking n-dodecane using RF inductivelycoupled plasma-enhanced chemical vapor deposition
- Application of persulfate in low-temperature atmospheric-pressure plasma jet for enhanced treatment of onychomycosis
- Magnetic field enhanced radio frequency ion source and its application for Siincorporation diamond-like carbon film preparation
- Microwave frequency downshift in the timevarying collision plasma
- Comparison of Reynolds average Navier-Stokes turbulence models in numerical simulations of the DC arc plasma torch
