
CHINALCO Group Plans To Launch The Horizontal Competition Business Integration Between CHALCO And Yunnan Aluminum In 2019
2019-09-02 06:58:44
China Nonferrous Metals Monthly 2019年8期
CHINALCO Group Plans To Launch The Horizontal Competition Business Integration Between CHALCO And Yunnan Aluminum In 2019
According to the recent response of CHALCO to a question from the investor on the interactive platform of Shanghai Stock Exchange, on January 2, 2019, CHALCO received thefrom the controlling shareholder CHINALCO Group, and the approval procedure of CHALCO’s acceptance of the free transfer of 51% state-owned stock of Yunnan Metallurgical Group has been completed. Due to the horizontal competition between Yunnan Aluminum under Yunnan Metallurgical Group and CHALCO in terms of alumina and electrolytic aluminium, CHINALCO Group, as the indirect controlling shareholder of Yunnan Aluminum and the direct controlling shareholder of CHALCO, has issued ato properly address the issue, according to which CHINALCO Group will launch the horizontal competition business integration between CHALCO and Yunnan Aluminum in 2019 and will solve the horizontal competition issue within 5 years.
Unit: metric ton
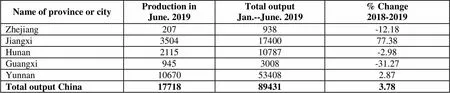
Name of province or cityProduction inJune. 2019Total outputJan.--June. 2019% Change2018-2019 Zhejiang207938-12.18 Jiangxi35041740077.38 Hunan211510787-2.98 Guangxi9453008-31.27 Yunnan10670534082.87 Total output China17718894313.78
Unit: metric ton
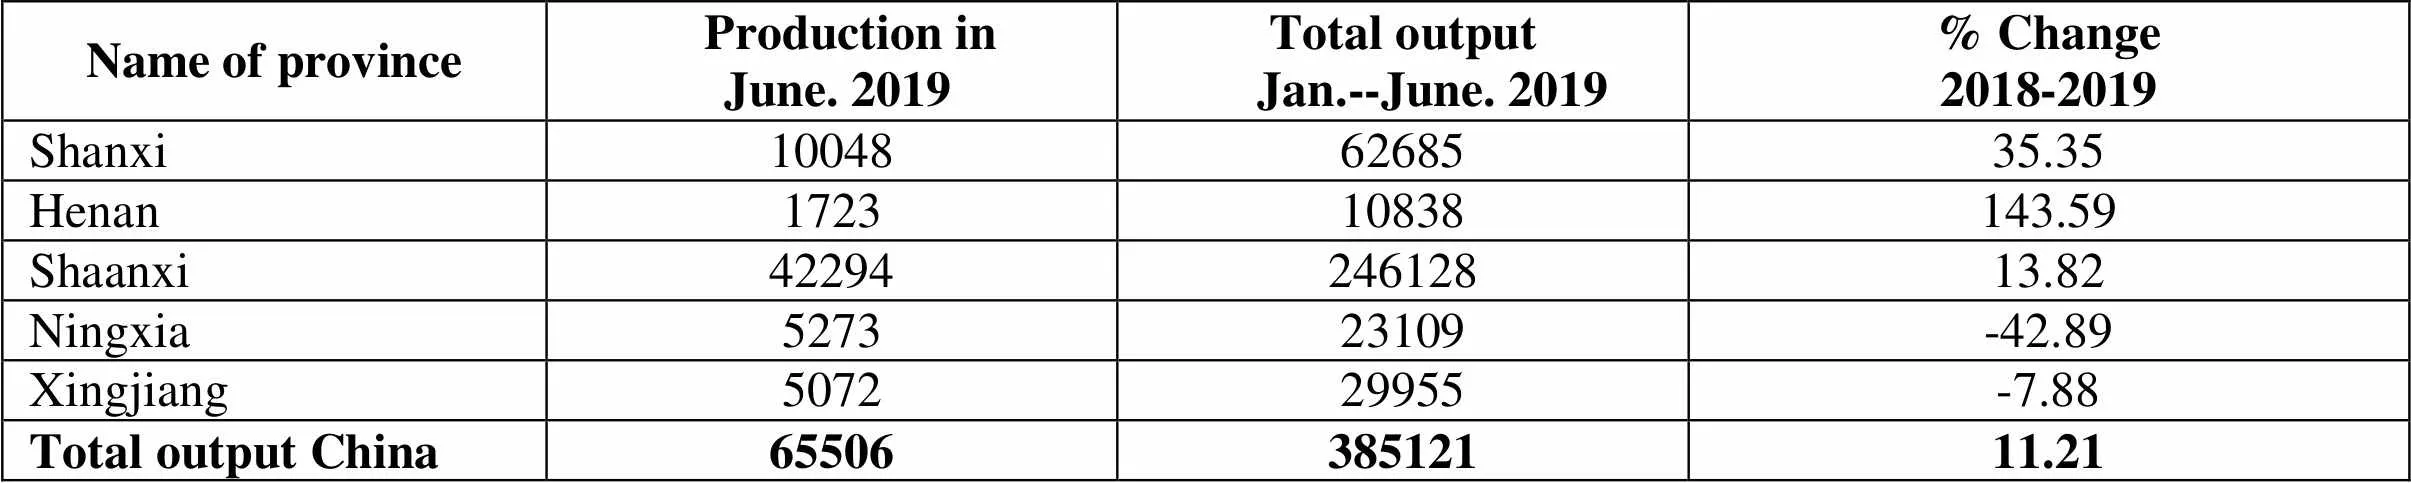
Name of province Production inJune. 2019Total output Jan.--June. 2019% Change2018-2019 Shanxi100486268535.35 Henan172310838143.59 Shaanxi4229424612813.82 Ningxia527323109-42.89 Xingjiang507229955-7.88 Total output China6550638512111.21
Unit: metric ton
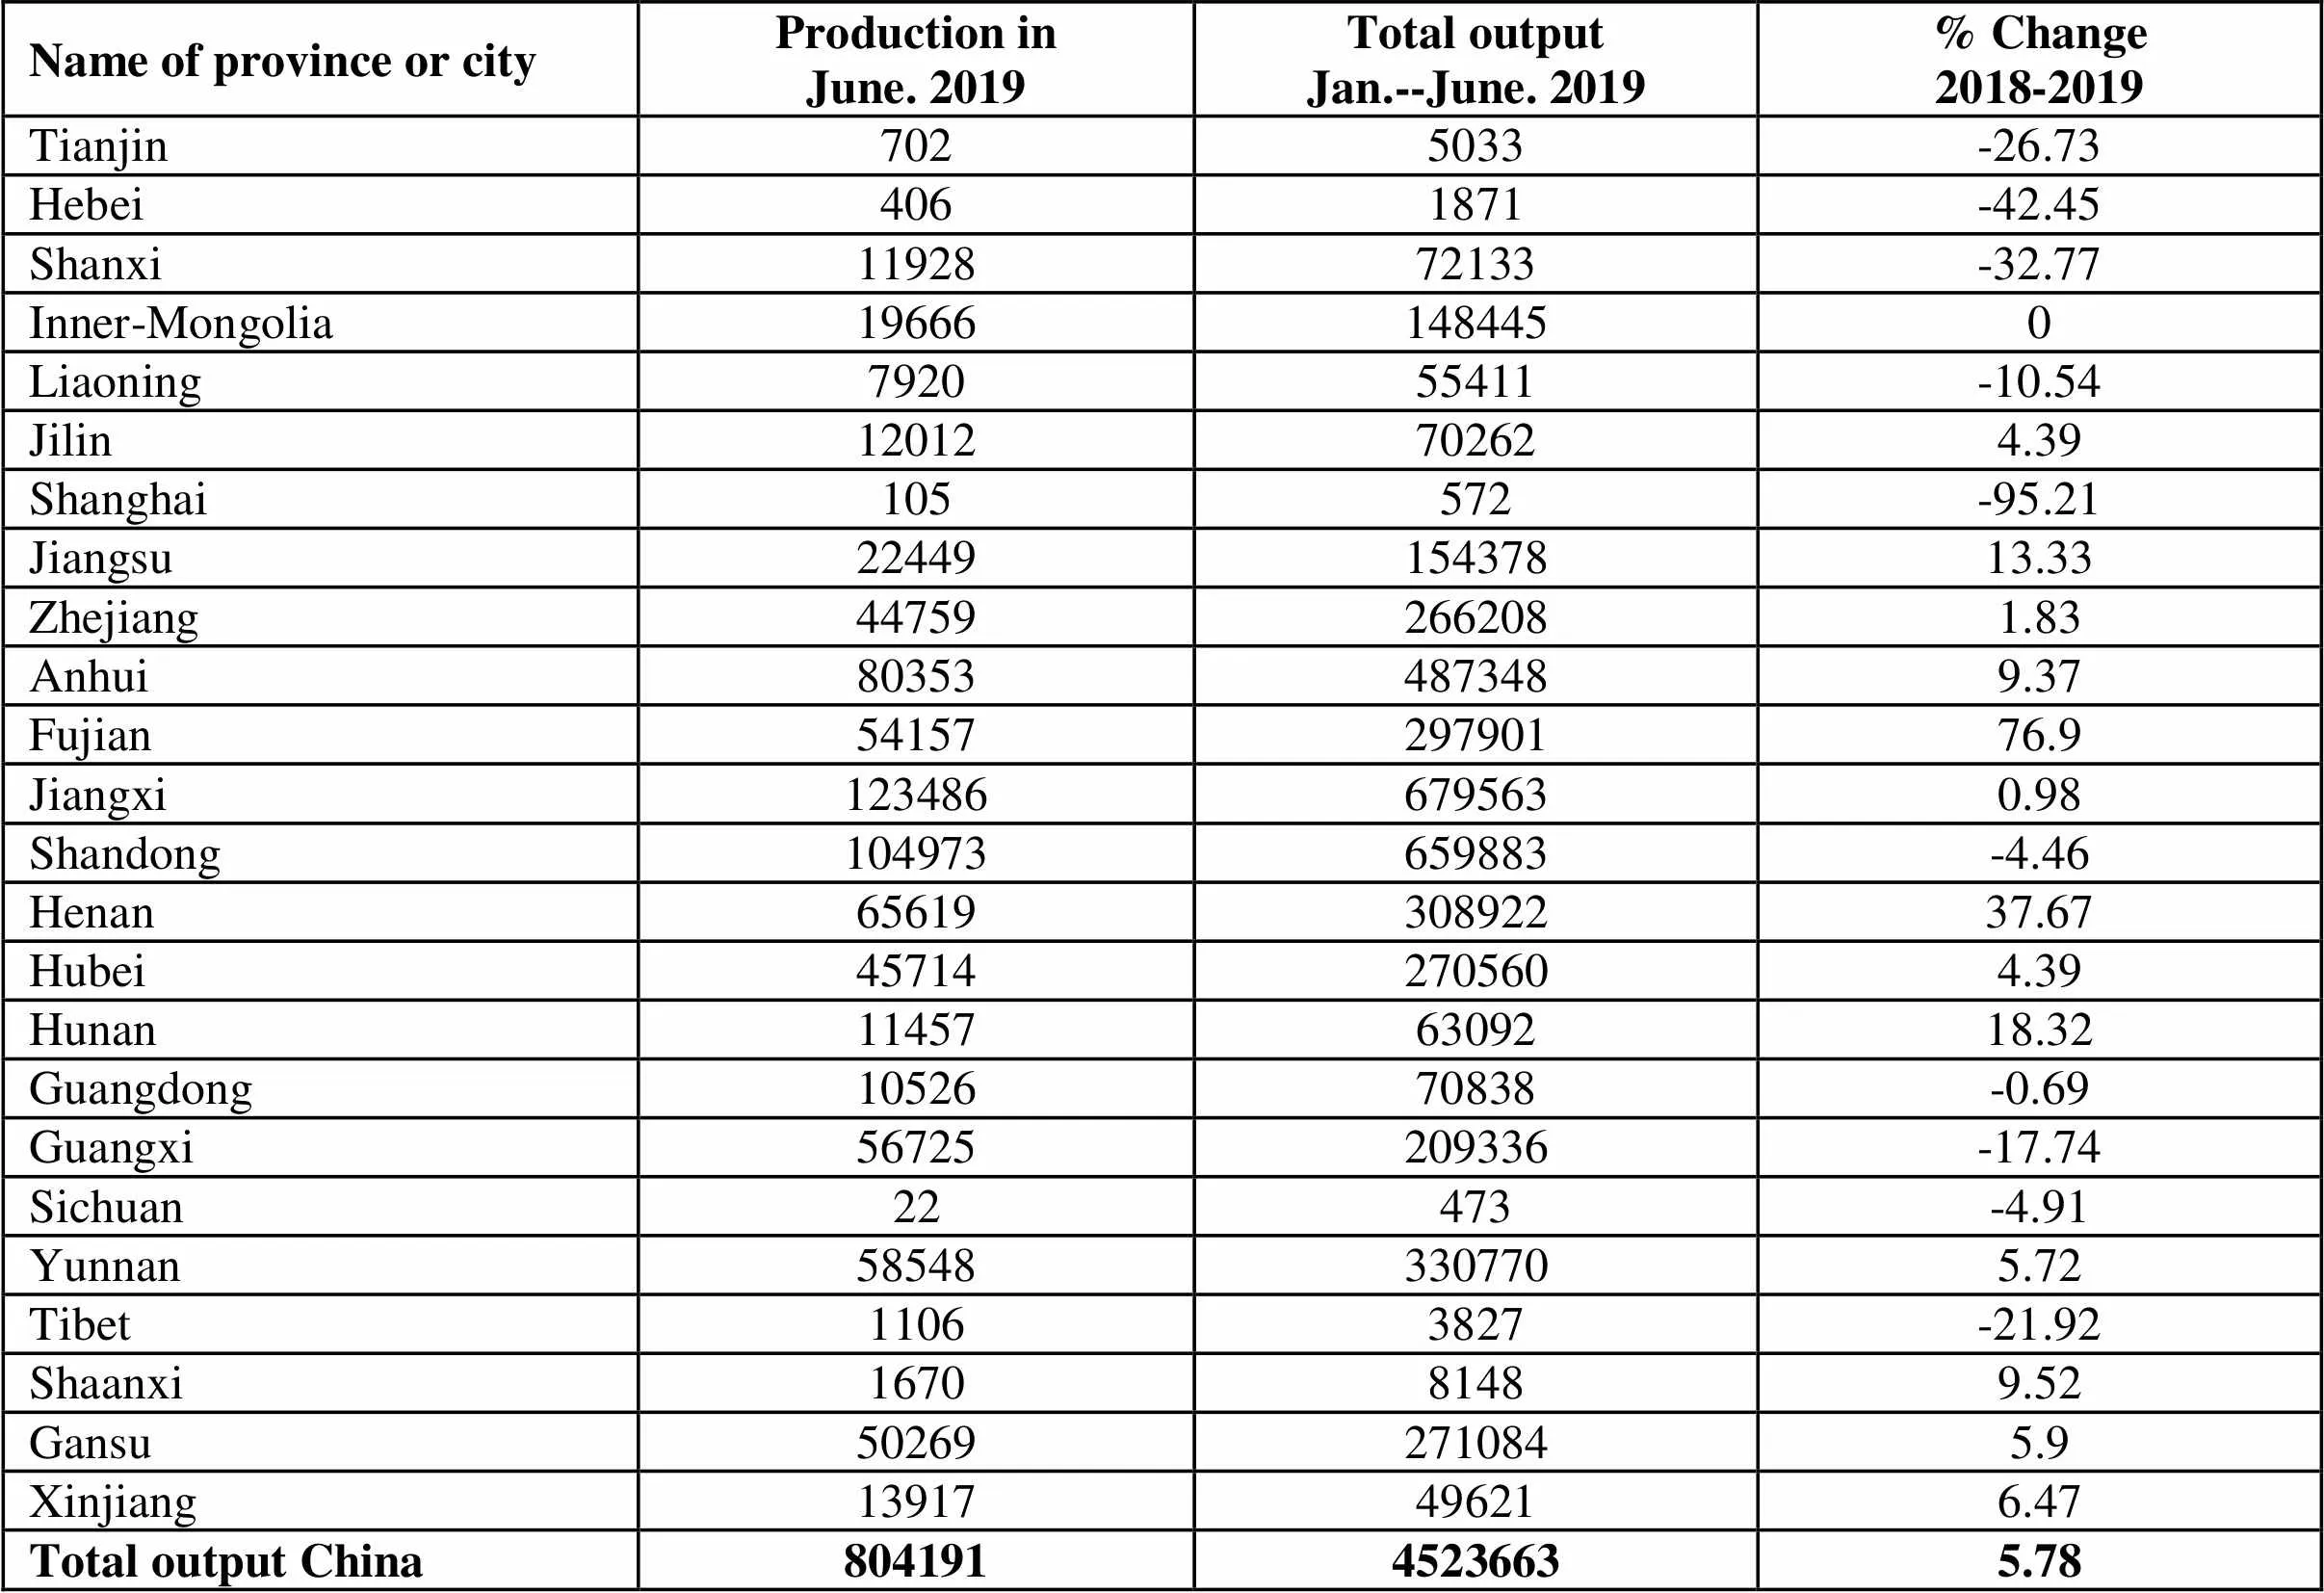
Name of province or cityProduction inJune. 2019Total outputJan.--June. 2019% Change2018-2019 Tianjin7025033-26.73 Hebei4061871-42.45 Shanxi1192872133-32.77 Inner-Mongolia196661484450 Liaoning792055411-10.54 Jilin12012702624.39 Shanghai105572-95.21 Jiangsu2244915437813.33 Zhejiang447592662081.83 Anhui803534873489.37 Fujian5415729790176.9 Jiangxi1234866795630.98 Shandong104973659883-4.46 Henan6561930892237.67 Hubei457142705604.39 Hunan114576309218.32 Guangdong1052670838-0.69 Guangxi56725209336-17.74 Sichuan22473-4.91 Yunnan585483307705.72 Tibet11063827-21.92 Shaanxi167081489.52 Gansu502692710845.9 Xinjiang13917496216.47 Total output China80419145236635.78
<
Unit: metric ton
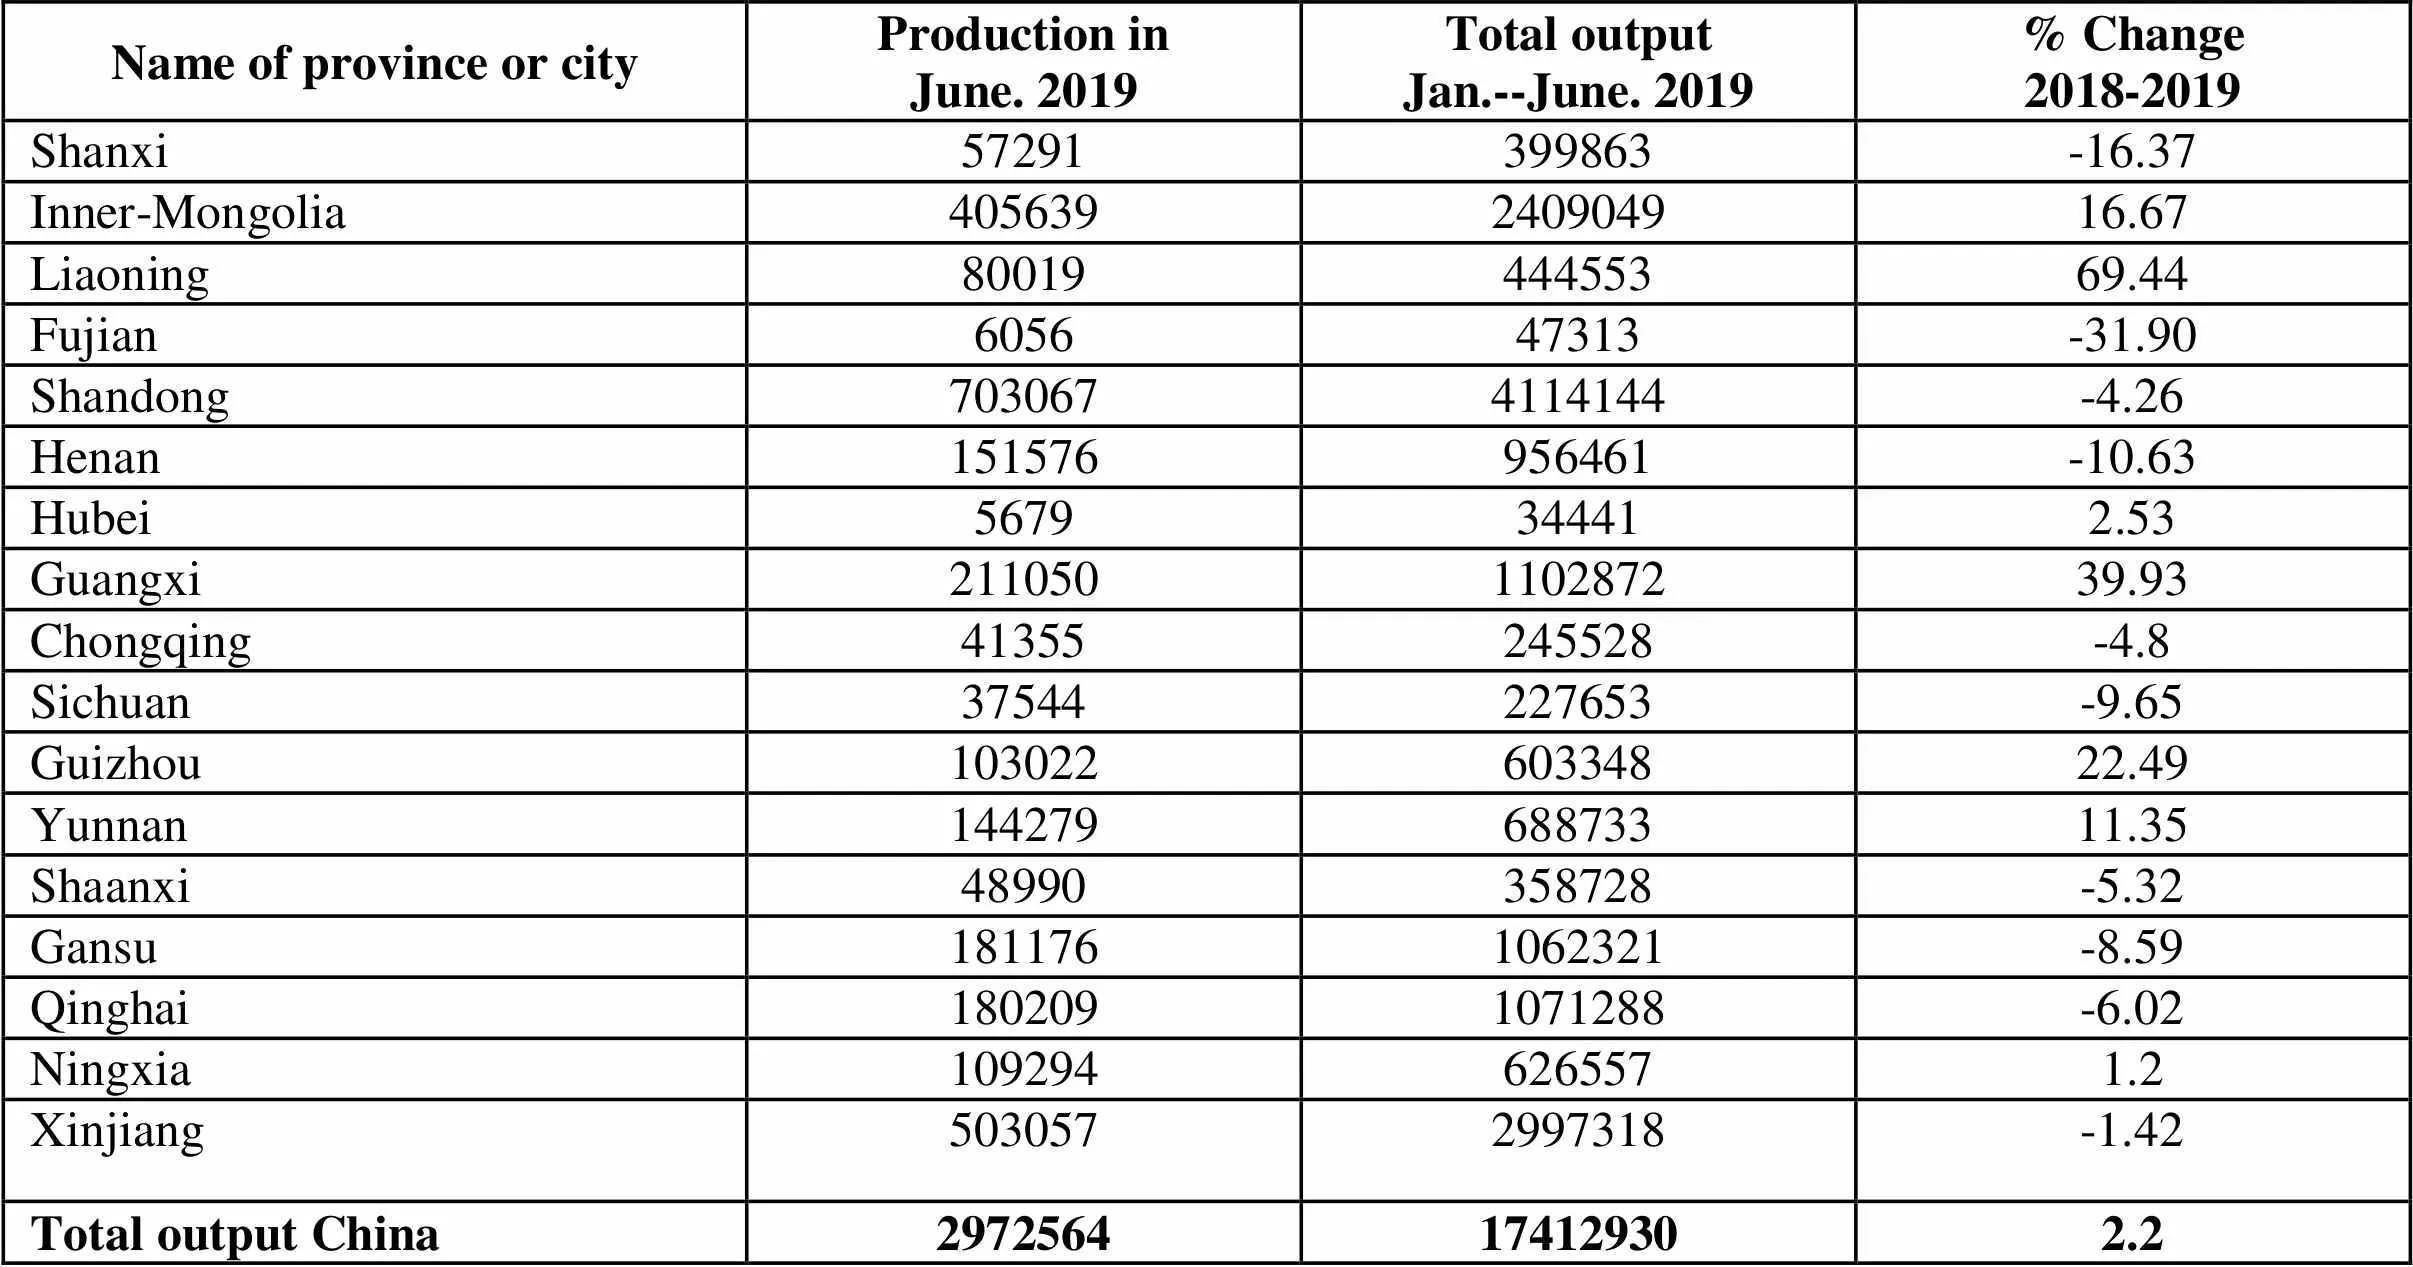
Name of province or cityProduction inJune. 2019Total outputJan.--June. 2019% Change2018-2019 Shanxi57291399863-16.37 Inner-Mongolia405639240904916.67 Liaoning8001944455369.44 Fujian605647313-31.90 Shandong7030674114144-4.26 Henan151576956461-10.63 Hubei5679344412.53 Guangxi211050110287239.93 Chongqing41355245528-4.8 Sichuan37544227653-9.65 Guizhou10302260334822.49 Yunnan14427968873311.35 Shaanxi48990358728-5.32 Gansu1811761062321-8.59 Qinghai1802091071288-6.02 Ningxia1092946265571.2 Xinjiang5030572997318-1.42 Total output China2972564174129302.2
<
Unit: metric ton
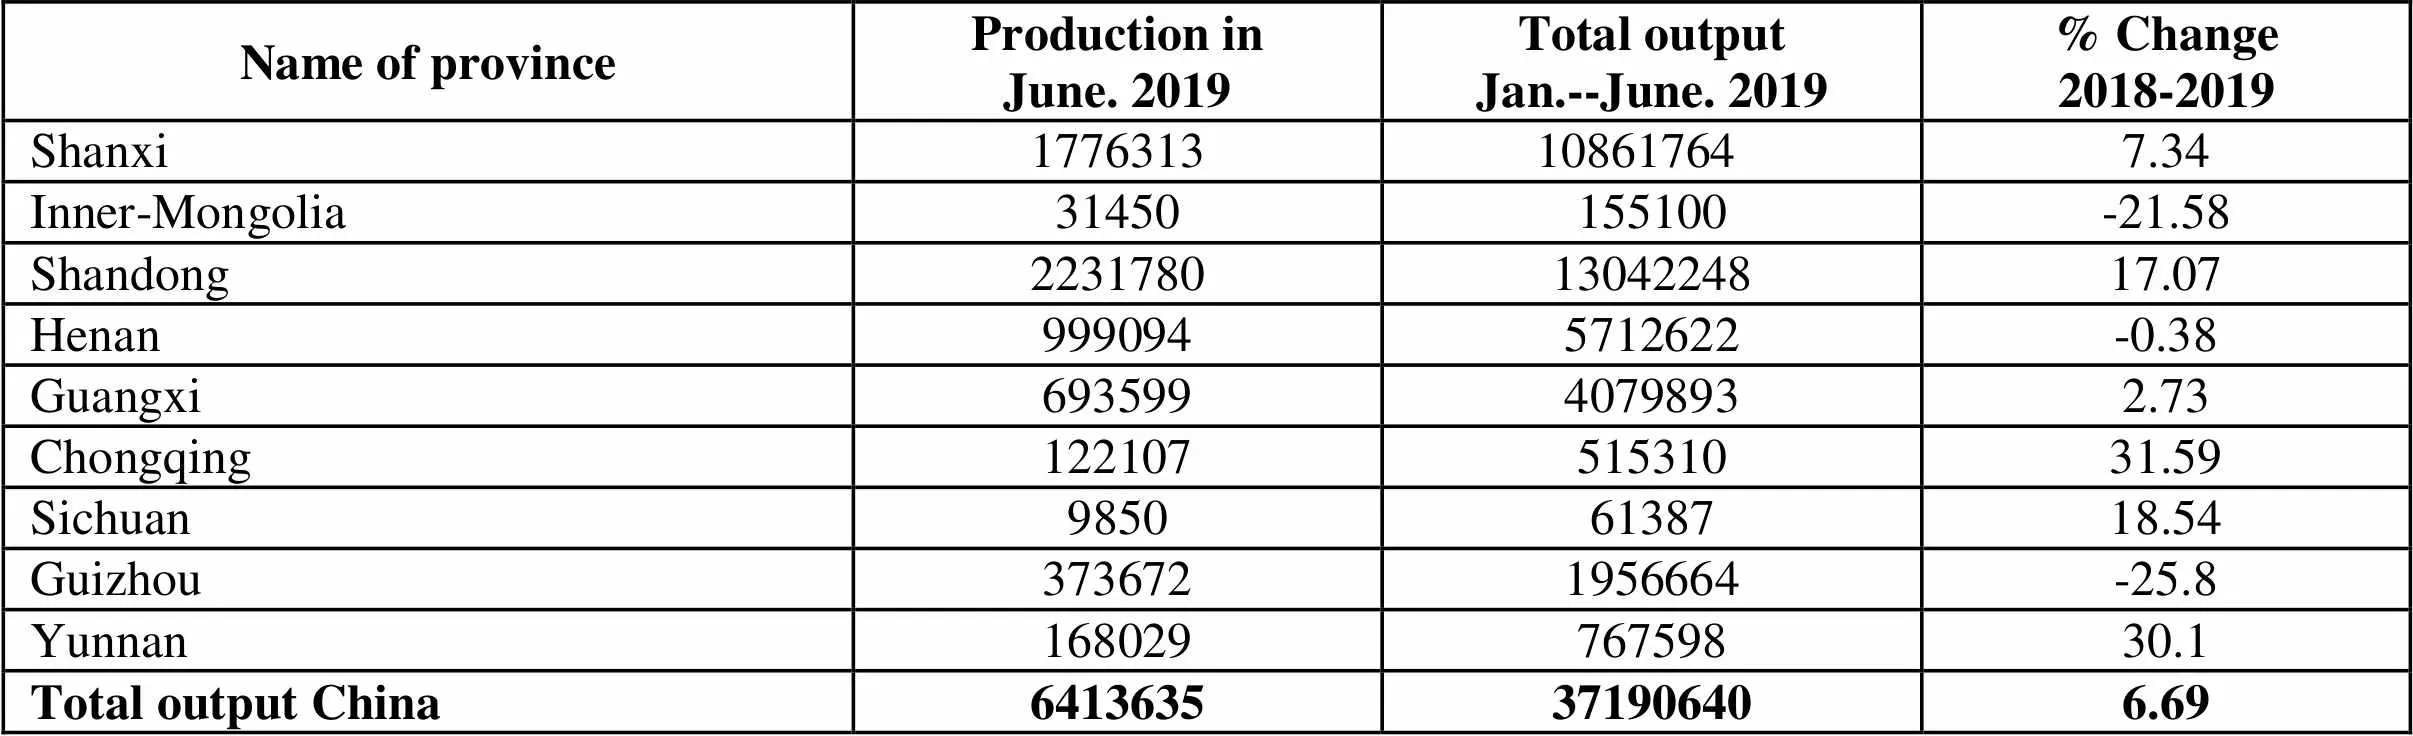
Name of province Production inJune. 2019Total outputJan.--June. 2019% Change2018-2019 Shanxi1776313 108617647.34 Inner-Mongolia31450155100-21.58 Shandong22317801304224817.07 Henan9990945712622-0.38 Guangxi69359940798932.73 Chongqing12210751531031.59 Sichuan98506138718.54 Guizhou3736721956664-25.8 Yunnan16802976759830.1 Total output China6413635371906406.69
Unit: metric ton
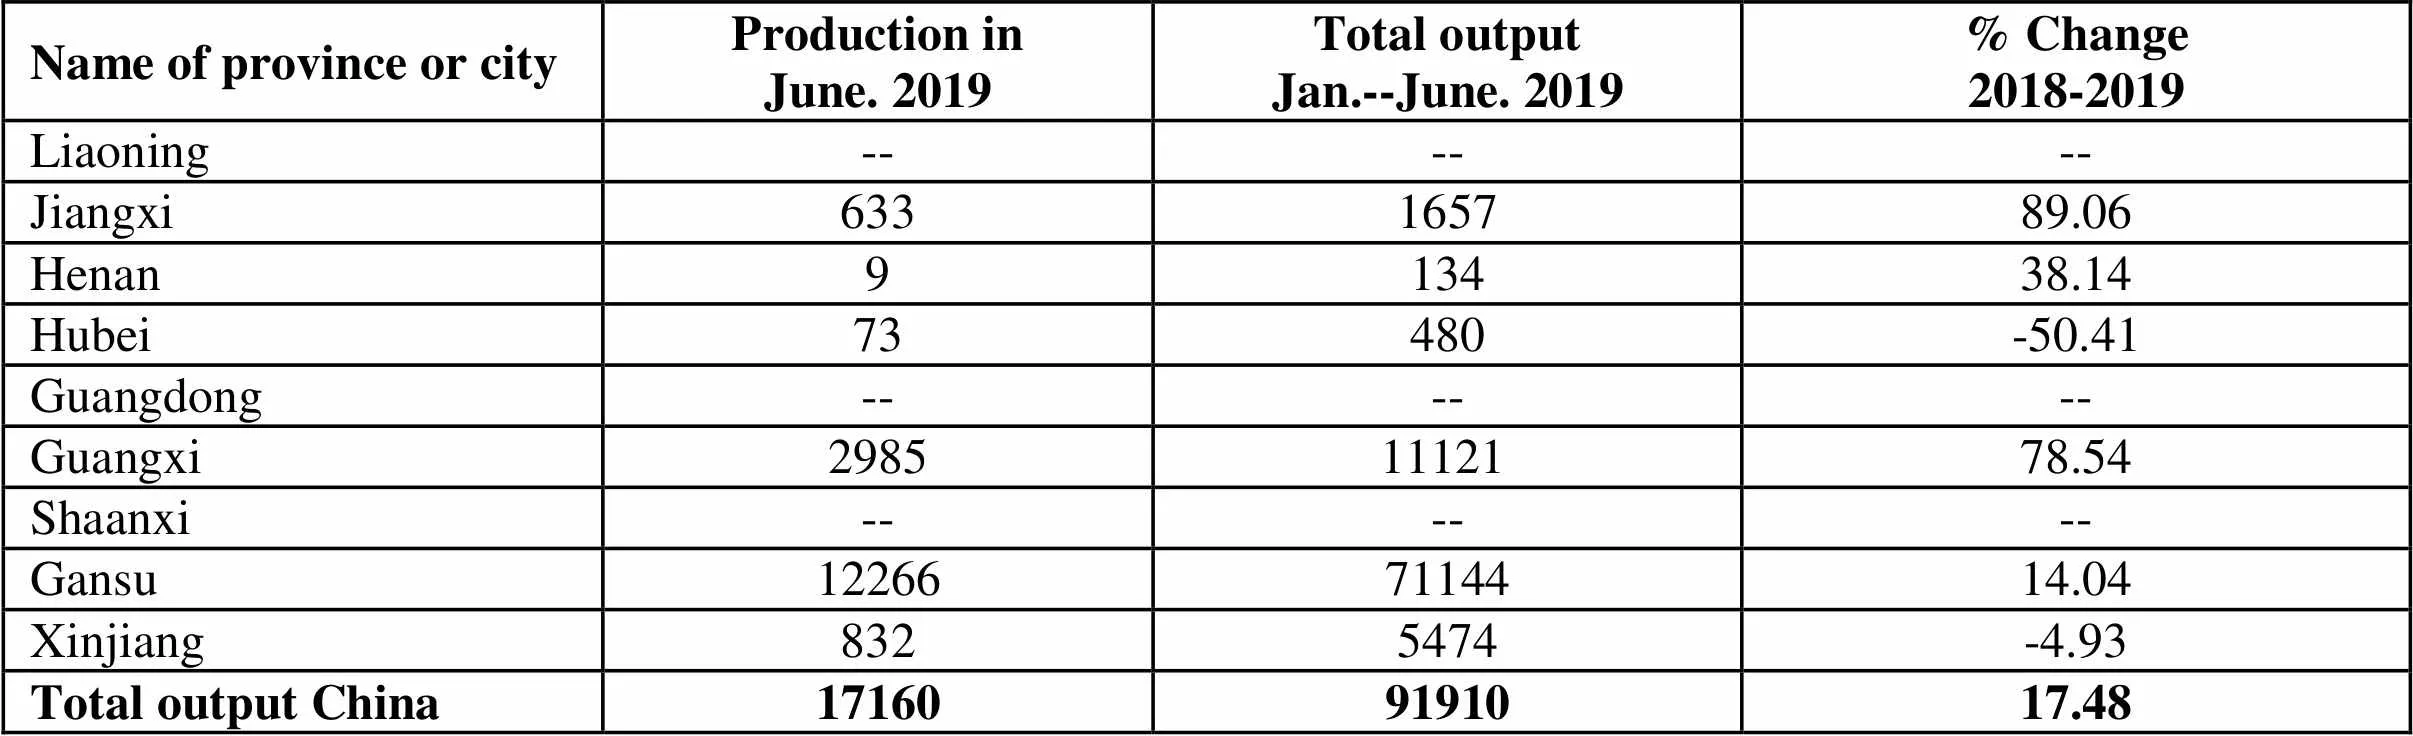
Name of province or cityProduction inJune. 2019Total outputJan.--June. 2019% Change2018-2019 Liaoning------ Jiangxi633165789.06 Henan913438.14 Hubei73480-50.41 Guangdong------ Guangxi29851112178.54 Shaanxi------ Gansu122667114414.04 Xinjiang8325474-4.93 Total output China171609191017.48
Unit: metric ton
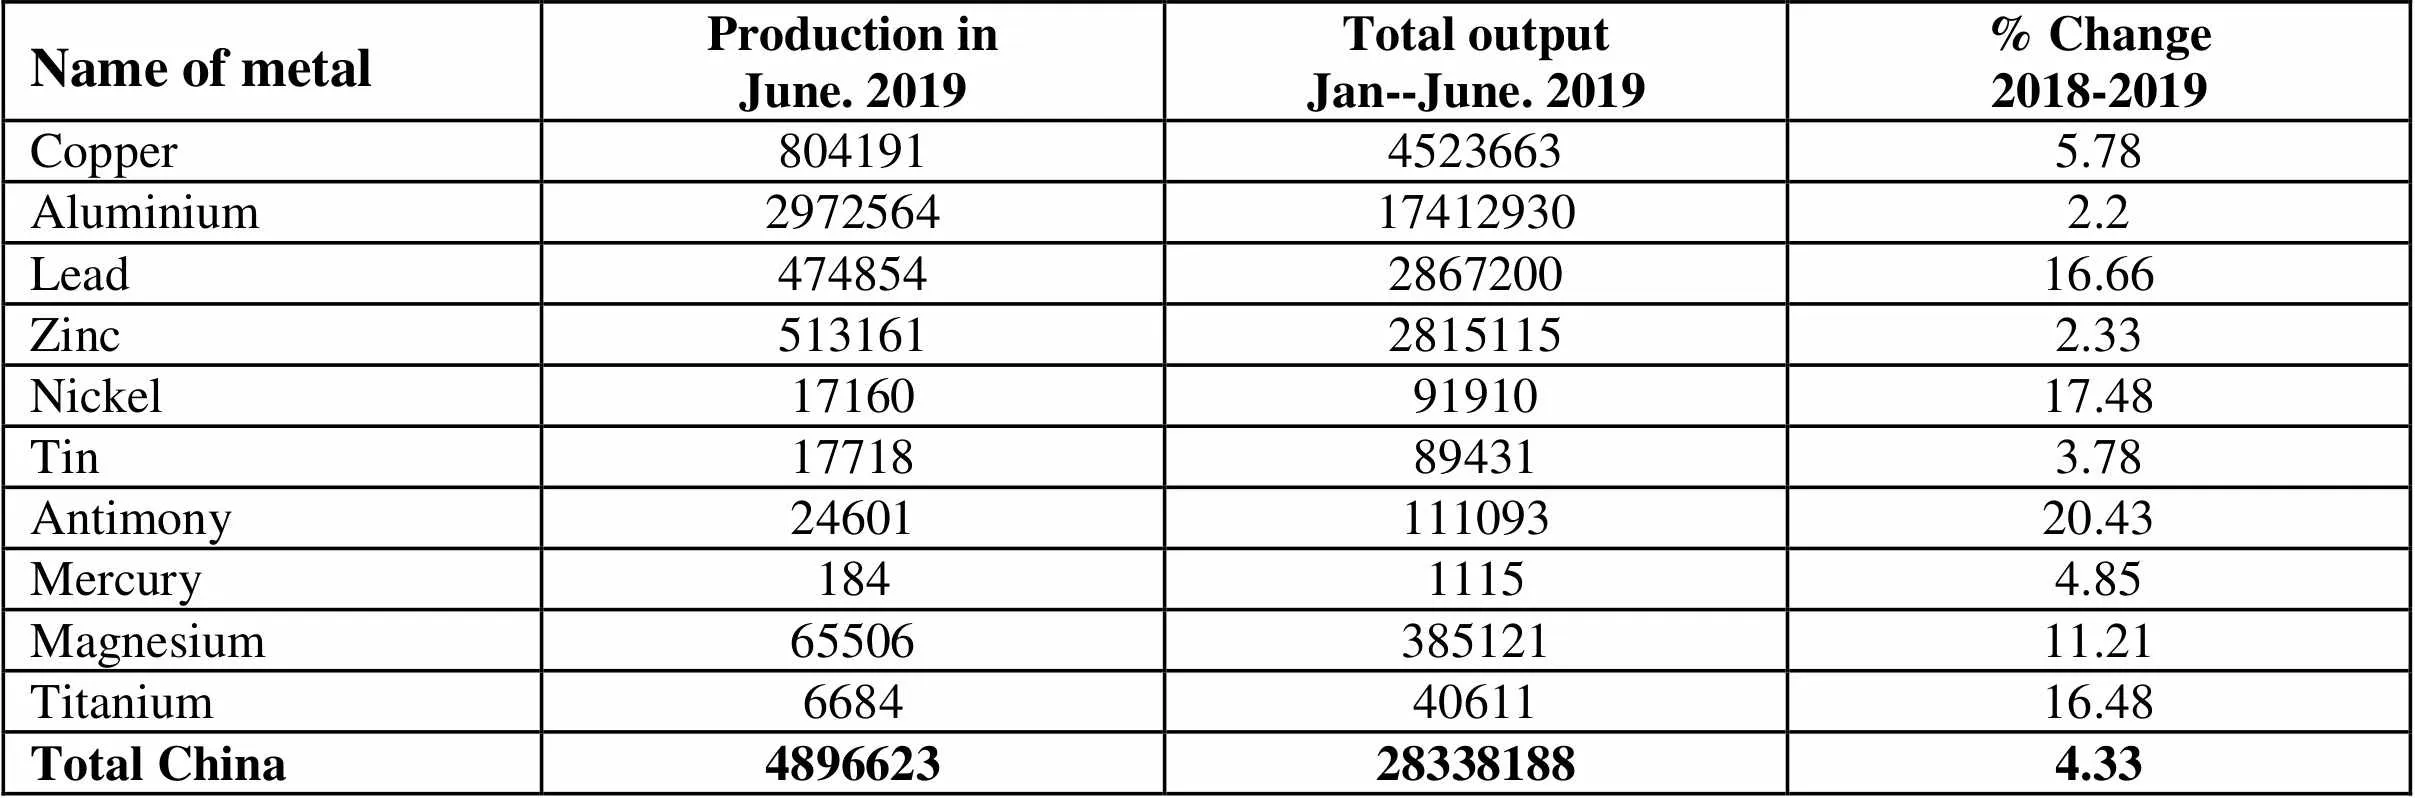
Name of metalProduction inJune. 2019Total outputJan--June. 2019% Change2018-2019 Copper80419145236635.78 Aluminium2972564174129302.2 Lead474854286720016.66 Zinc51316128151152.33 Nickel171609191017.48 Tin17718894313.78 Antimony2460111109320.43 Mercury18411154.85 Magnesium6550638512111.21 Titanium66844061116.48 Total China4896623283381884.33
Unit: metric ton
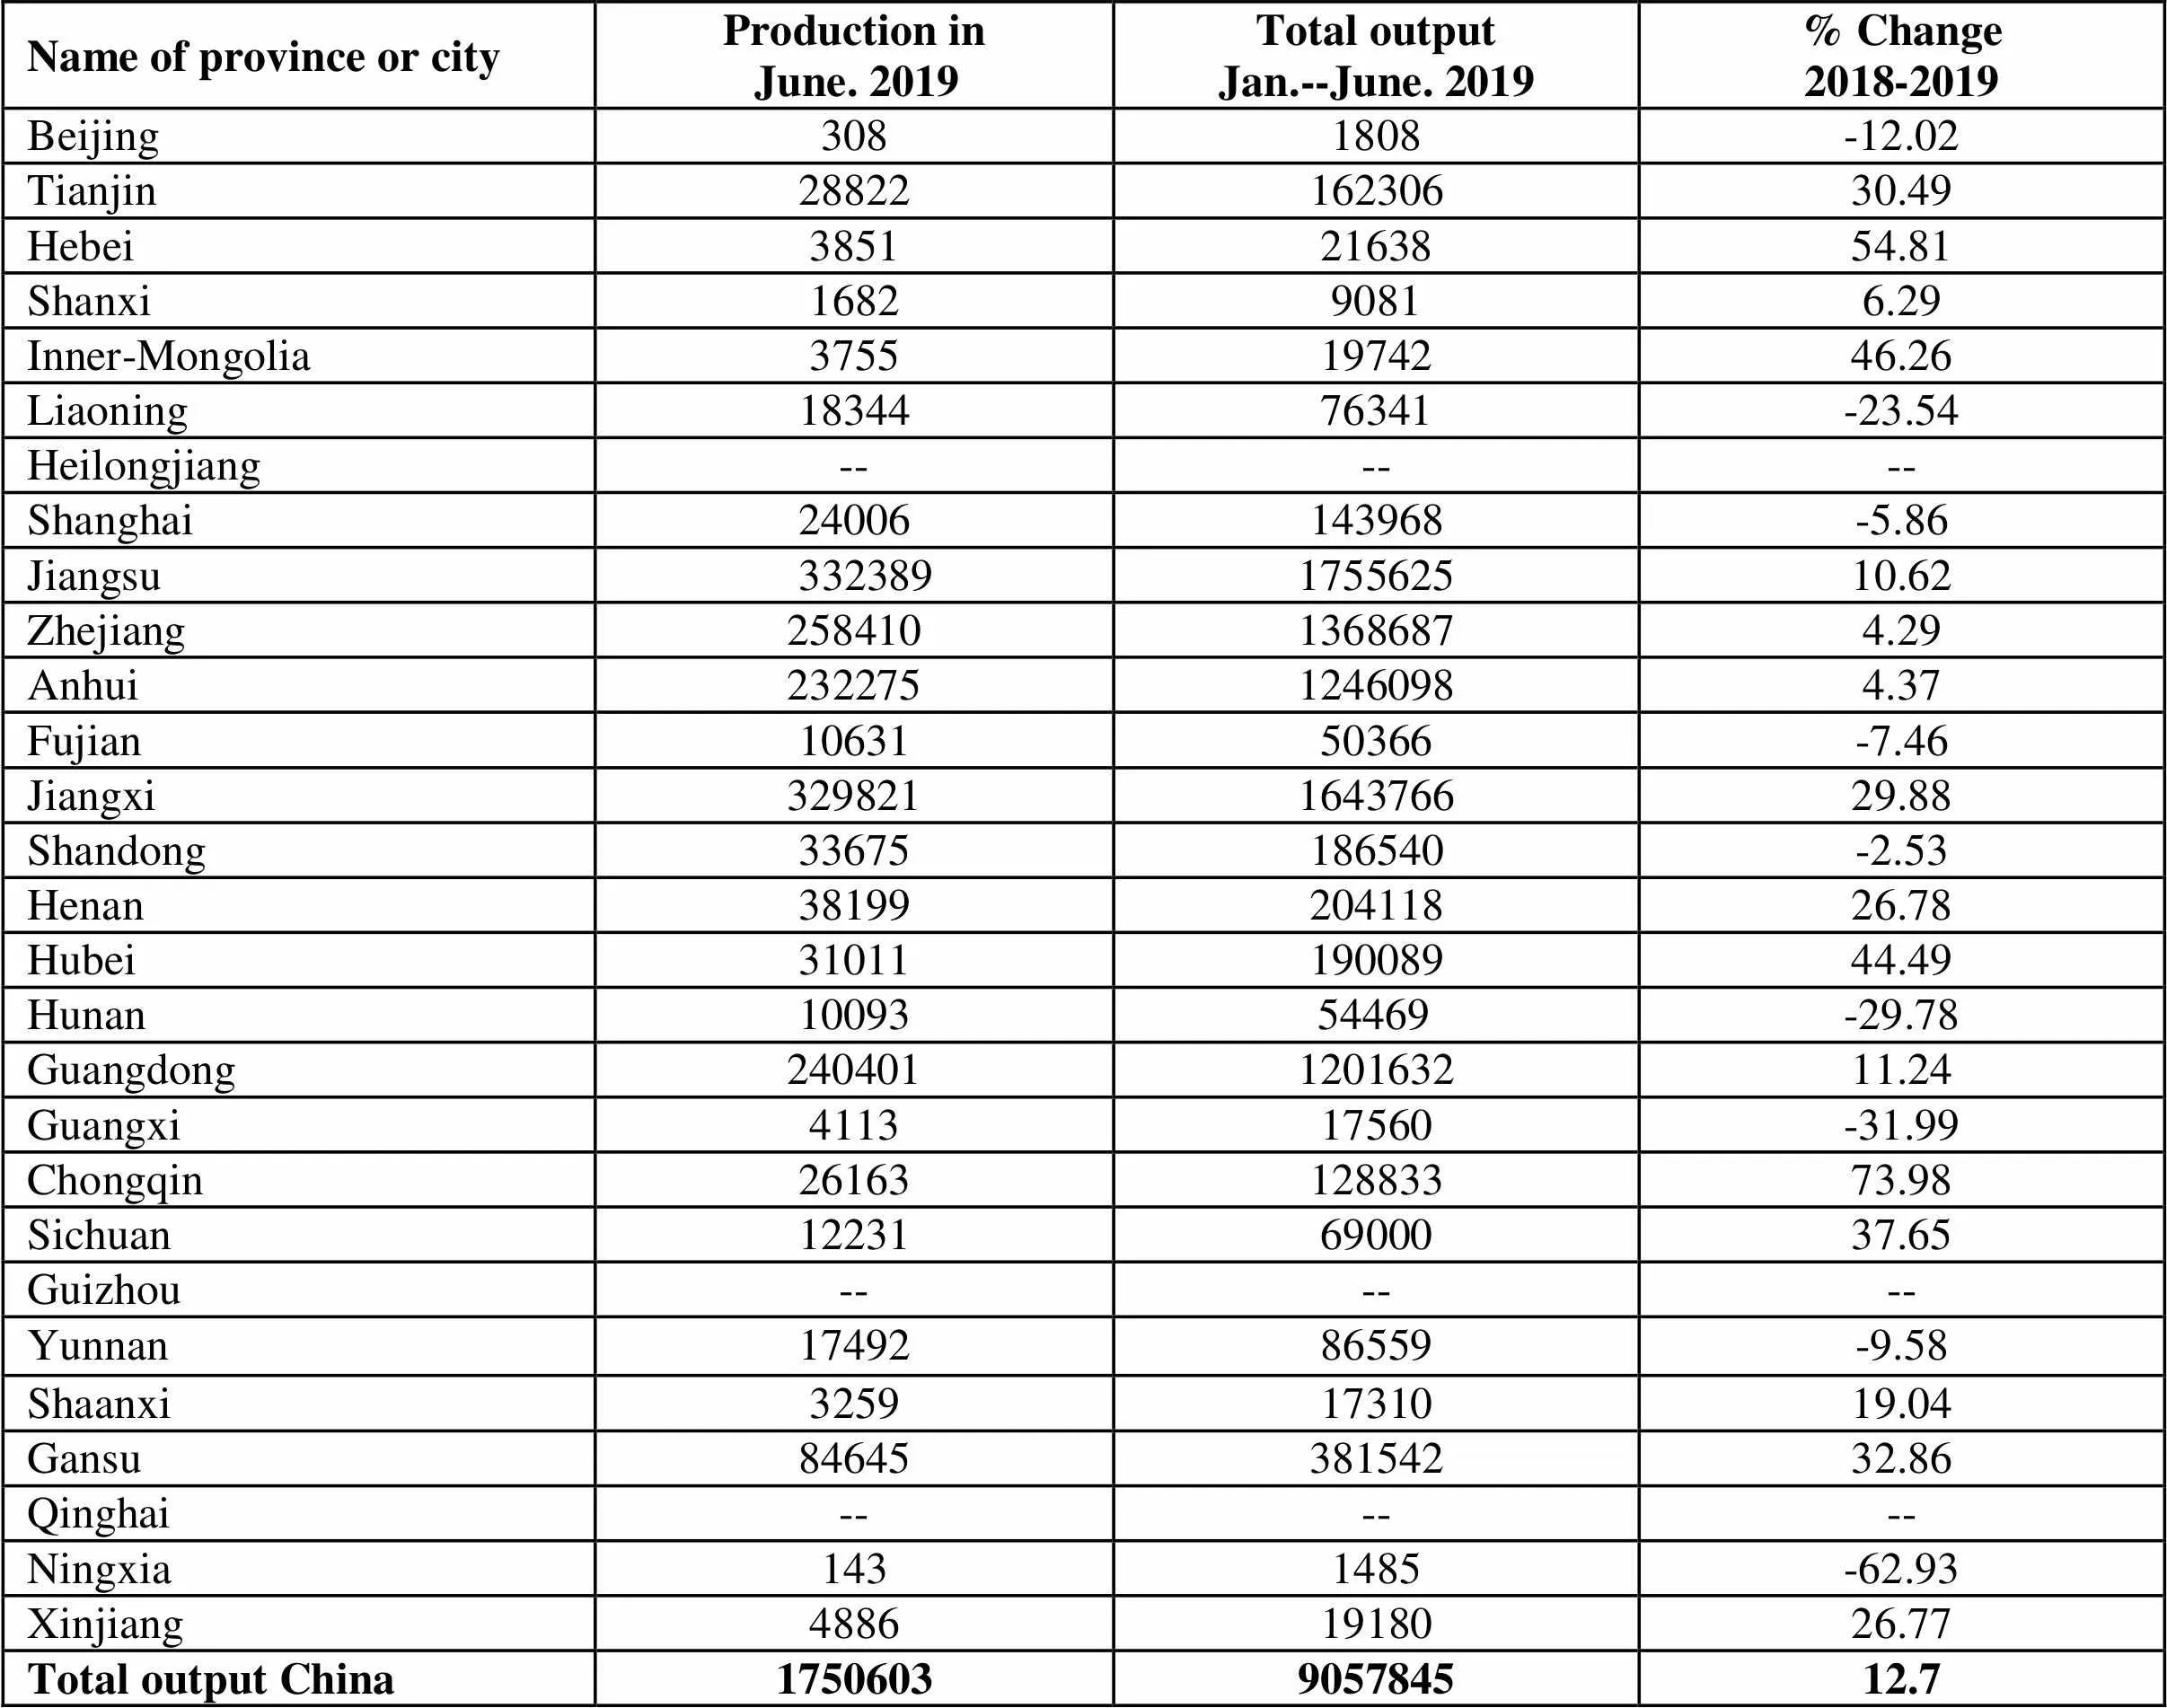
Name of province or cityProduction inJune. 2019Total outputJan.--June. 2019% Change2018-2019 Beijing3081808-12.02 Tianjin2882216230630.49 Hebei38512163854.81 Shanxi168290816.29 Inner-Mongolia37551974246.26 Liaoning1834476341-23.54 Heilongjiang------ Shanghai24006143968-5.86 Jiangsu332389175562510.62 Zhejiang25841013686874.29 Anhui23227512460984.37 Fujian1063150366-7.46 Jiangxi329821164376629.88 Shandong33675186540-2.53 Henan3819920411826.78 Hubei3101119008944.49 Hunan1009354469-29.78 Guangdong240401120163211.24 Guangxi411317560-31.99 Chongqin2616312883373.98 Sichuan122316900037.65 Guizhou------ Yunnan1749286559-9.58 Shaanxi32591731019.04 Gansu8464538154232.86 Qinghai------ Ningxia1431485-62.93 Xinjiang48861918026.77 Total output China1750603905784512.7
Unit: metric ton
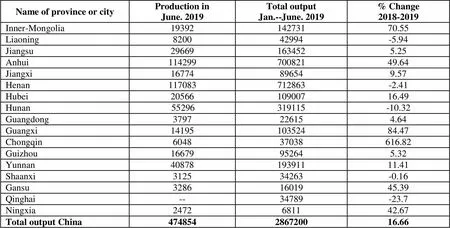
Name of province or cityProduction inJune. 2019Total outputJan.--June. 2019% Change2018-2019 Inner-Mongolia 1939214273170.55 Liaoning820042994-5.94 Jiangsu296691634525.25 Anhui11429970082149.64 Jiangxi16774896549.57 Henan117083712863-2.41 Hubei2056610900716.49 Hunan55296319115-10.32 Guangdong3797226154.64 Guangxi1419510352484.47 Chongqin604837038616.82 Guizhou16679952645.32 Yunnan4087819391111.41 Shaanxi312534263-0.16 Gansu32861601945.39 Qinghai--34789-23.7 Ningxia2472681142.67 Total output China474854286720016.66
Unit: metric ton(metal content)
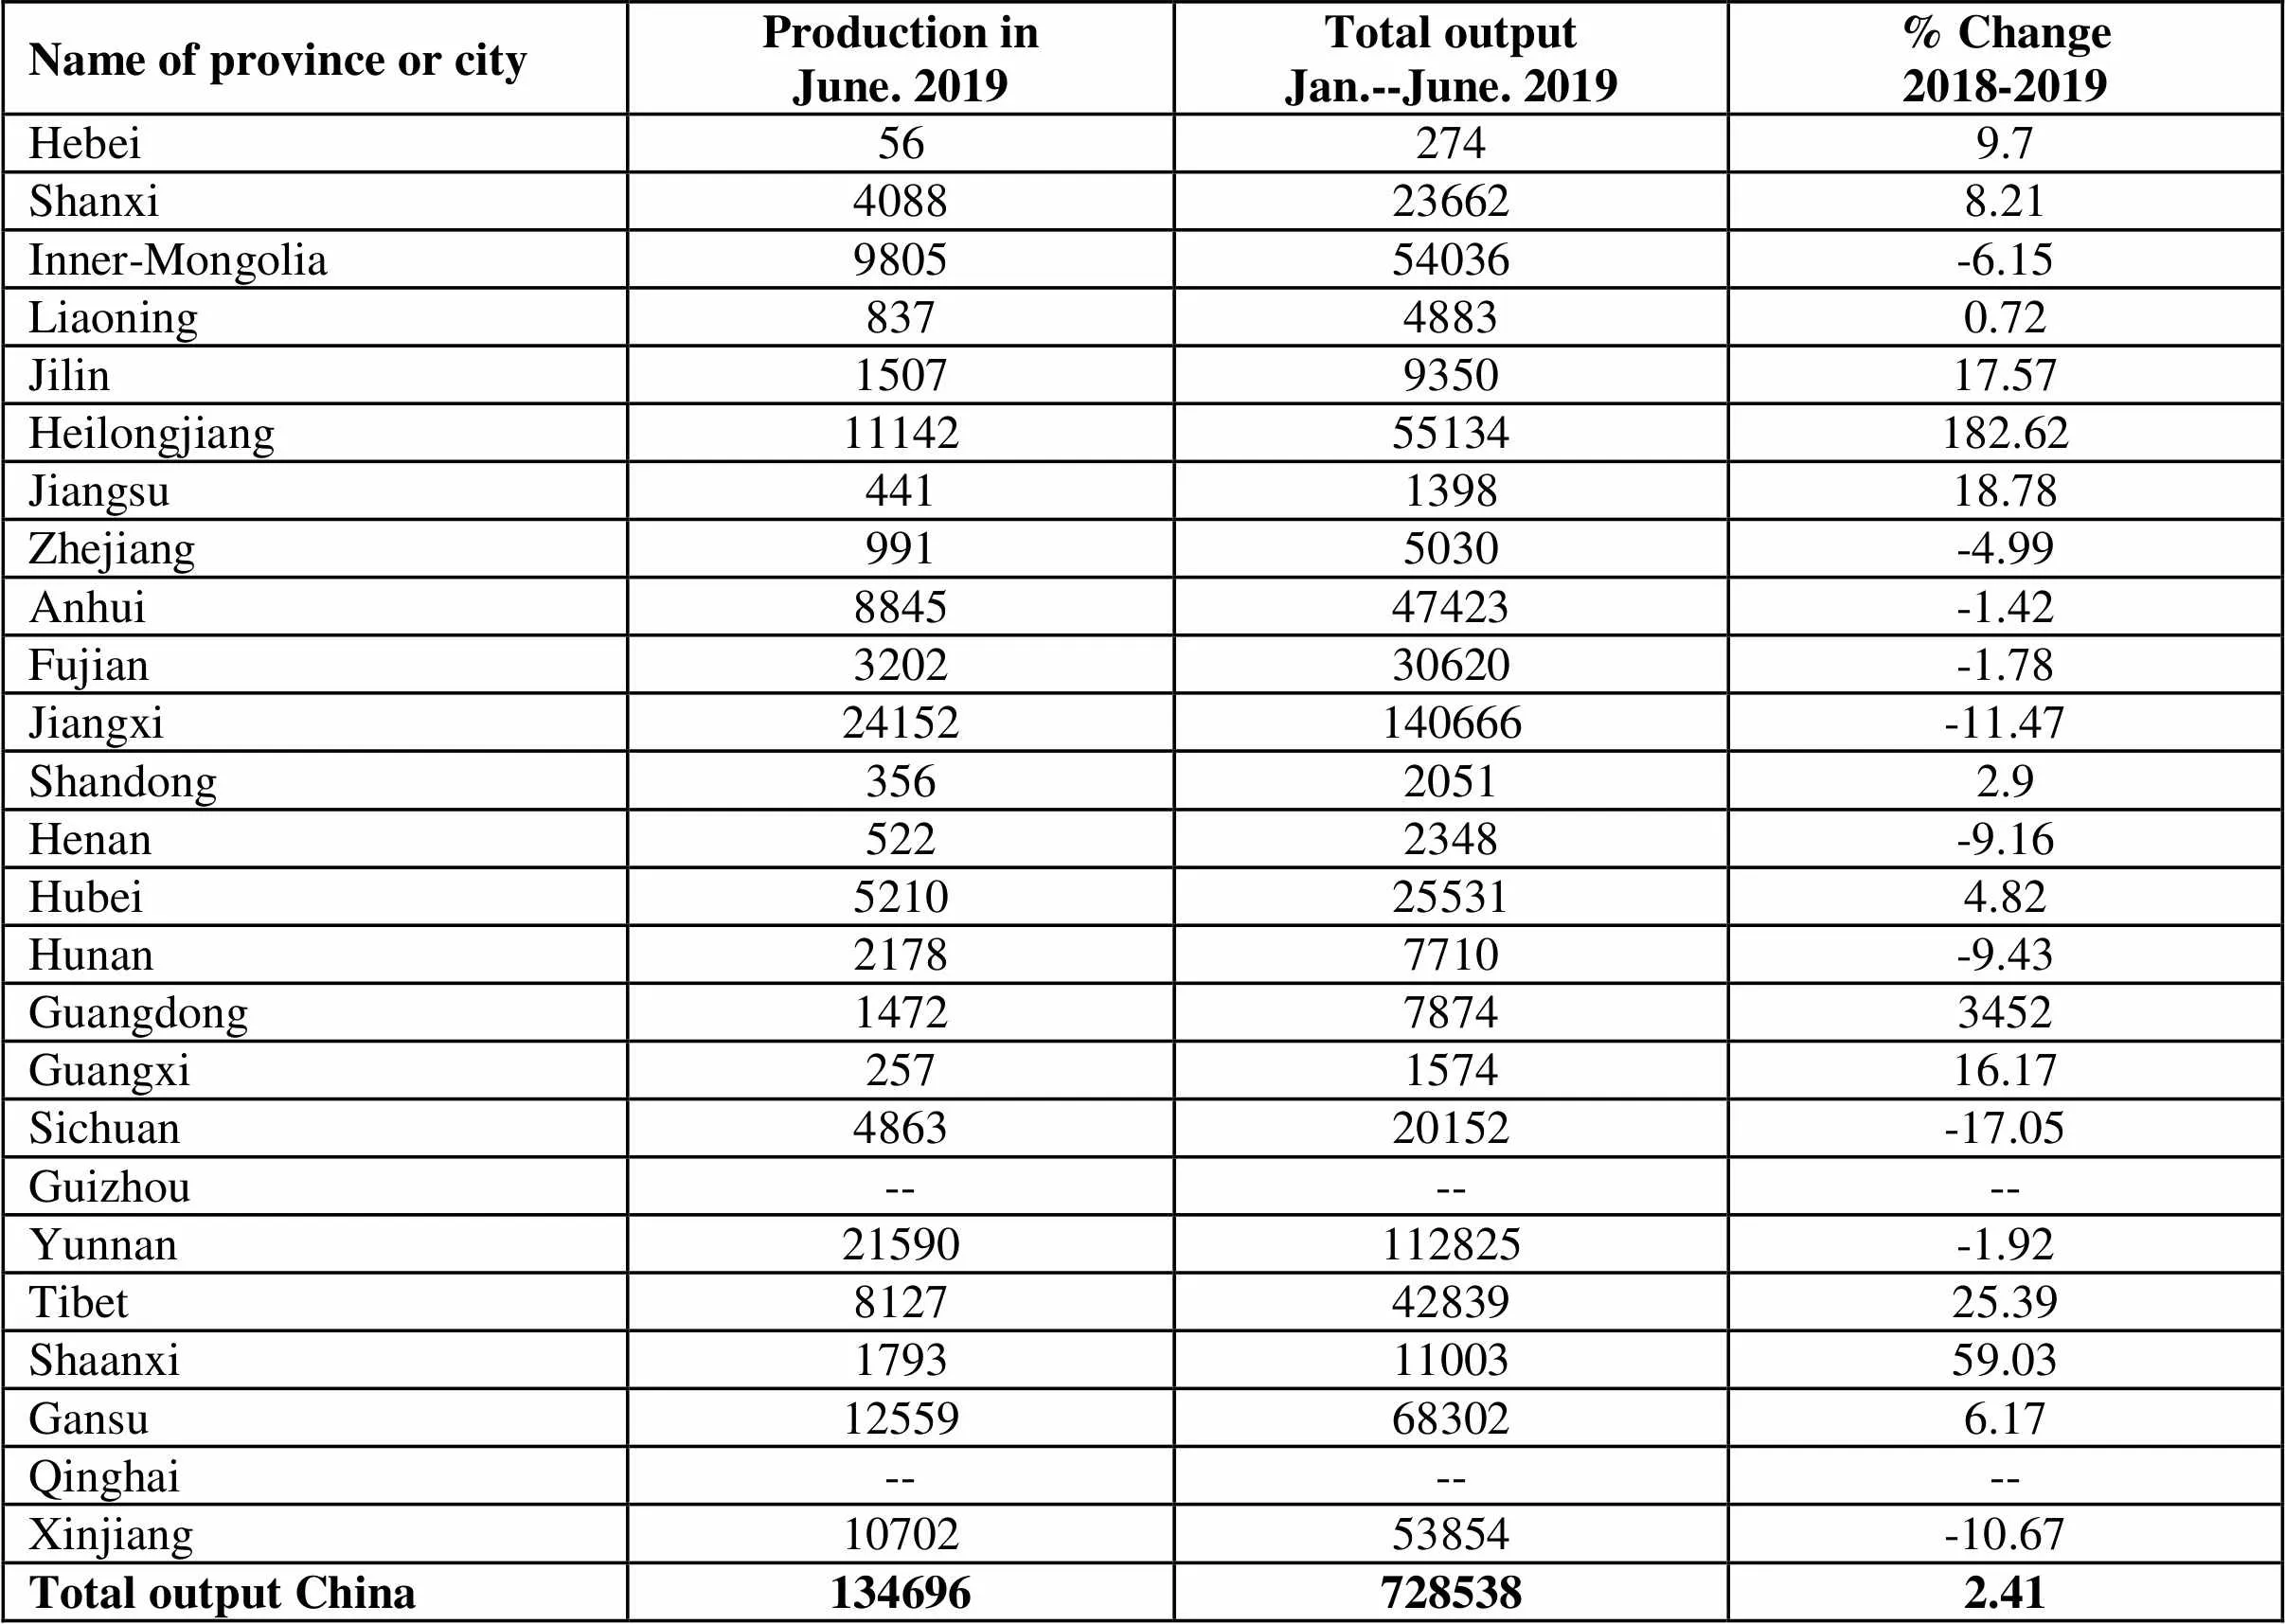
Name of province or cityProduction inJune. 2019Total outputJan.--June. 2019% Change2018-2019 Hebei562749.7 Shanxi4088236628.21 Inner-Mongolia980554036-6.15 Liaoning83748830.72 Jilin1507935017.57 Heilongjiang1114255134182.62 Jiangsu441139818.78 Zhejiang9915030-4.99 Anhui884547423-1.42 Fujian320230620-1.78 Jiangxi24152140666-11.47 Shandong35620512.9 Henan5222348-9.16 Hubei5210255314.82 Hunan21787710-9.43 Guangdong147278743452 Guangxi257157416.17 Sichuan486320152-17.05 Guizhou------ Yunnan21590112825-1.92 Tibet81274283925.39 Shaanxi17931100359.03 Gansu12559683026.17 Qinghai------ Xinjiang1070253854-10.67 Total output China1346967285382.41
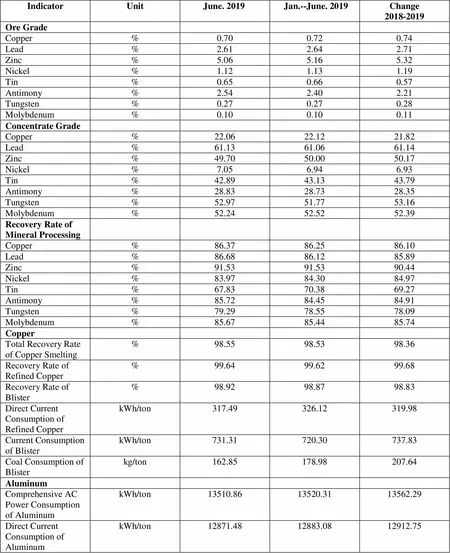
IndicatorUnitJune. 2019Jan.--June. 2019Change2018-2019 Ore Grade Copper%0.700.720.74 Lead%2.612.642.71 Zinc%5.065.165.32 Nickel%1.121.131.19 Tin%0.650.660.57 Antimony%2.542.402.21 Tungsten%0.270.270.28 Molybdenum%0.100.100.11 Concentrate Grade Copper%22.0622.1221.82 Lead%61.1361.0661.14 Zinc%49.7050.0050.17 Nickel%7.056.946.93 Tin%42.8943.1343.79 Antimony%28.8328.7328.35 Tungsten%52.9751.7753.16 Molybdenum%52.2452.5252.39 Recovery Rate of Mineral Processing Copper%86.3786.2586.10 Lead%86.6886.1285.89 Zinc%91.5391.5390.44 Nickel%83.9784.3084.97 Tin%67.8370.3869.27 Antimony%85.7284.4584.91 Tungsten%79.2978.5578.09 Molybdenum%85.6785.4485.74 Copper Total Recovery Rate of Copper Smelting%98.5598.5398.36 Recovery Rate of Refined Copper%99.6499.6299.68 Recovery Rate of Blister%98.9298.8798.83 Direct Current Consumption of Refined CopperkWh/ton317.49326.12319.98 Current Consumption of BlisterkWh/ton731.31720.30737.83 Coal Consumption of Blisterkg/ton162.85178.98207.64 Aluminum Comprehensive AC Power Consumption of AluminumkWh/ton13510.8613520.3113562.29 Direct Current Consumption of AluminumkWh/ton12871.4812883.0812912.75
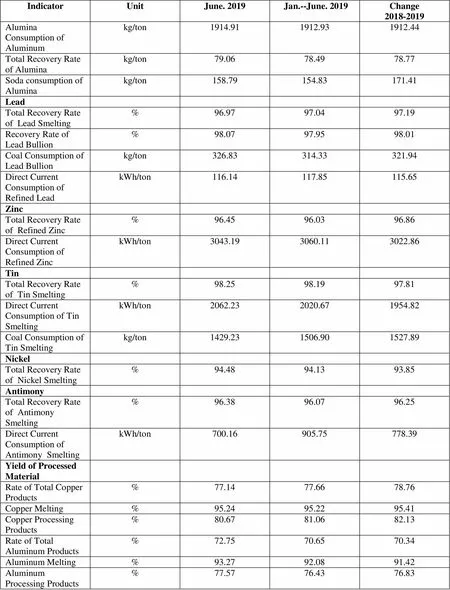
IndicatorUnitJune. 2019Jan.--June. 2019Change2018-2019 Alumina Consumption of Aluminumkg/ton1914.911912.931912.44 Total Recovery Rate of Aluminakg/ton79.0678.4978.77 Soda consumption of Aluminakg/ton158.79154.83171.41 Lead Total Recovery Rate of Lead Smelting%96.9797.0497.19 Recovery Rate of Lead Bullion%98.0797.9598.01 Coal Consumption of Lead Bullionkg/ton326.83314.33321.94 Direct Current Consumption of Refined LeadkWh/ton116.14117.85115.65 Zinc Total Recovery Rate of Refined Zinc%96.4596.0396.86 Direct Current Consumption of Refined ZinckWh/ton3043.193060.113022.86 Tin Total Recovery Rate of Tin Smelting%98.2598.1997.81 Direct Current Consumption of Tin SmeltingkWh/ton2062.232020.671954.82 Coal Consumption of Tin Smeltingkg/ton1429.231506.901527.89 Nickel Total Recovery Rate of Nickel Smelting%94.4894.1393.85 Antimony Total Recovery Rate of Antimony Smelting%96.3896.0796.25 Direct Current Consumption of Antimony SmeltingkWh/ton700.16905.75778.39 Yield of Processed Material Rate of Total Copper Products%77.1477.6678.76 Copper Melting %95.2495.2295.41 Copper Processing Products%80.6781.0682.13 Rate of Total Aluminum Products%72.7570.6570.34 Aluminum Melting%93.2792.0891.42 Aluminum Processing Products%77.5776.4376.83
Unit: metric ton
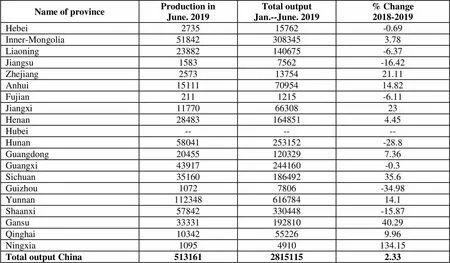
Name of provinceProduction inJune. 2019Total output Jan.--June. 2019% Change2018-2019 Hebei273515762-0.69 Inner-Mongolia518423083453.78 Liaoning23882140675-6.37 Jiangsu15837562-16.42 Zhejiang25731375421.11 Anhui151117095414.82 Fujian2111215-6.11 Jiangxi117706630823 Henan284831648514.45 Hubei------ Hunan58041253152-28.8 Guangdong204551203297.36 Guangxi43917244160-0.3 Sichuan3516018649235.6 Guizhou10727806-34.98 Yunnan11234861678414.1 Shaanxi57842330448-15.87 Gansu3333119281040.29 Qinghai10342552269.96 Ningxia10954910134.15 Total output China51316128151152.33
 China Nonferrous Metals Monthly2019年8期
- China Nonferrous Metals Monthly的其它文章
- TianQi Lithium Released Its Semi-annual Performance Report In 2019
- The Largest Solid Spodumene Mine in Asia Put Into Production, With An Estimated Production Of About 30,000-ton Spodumene Concentrate This Year
- Three Ministries And Commissions Survey Rare Earths And Other Strategic Mineral Resources In Several Regions In China
- An Enterprise In Qinghai Become The Largest Producer And Supplier Of Lithium Battery Copper Foil Worldwide
- Xiamen Tungsten’s Half-year Net Profit Reduces By Nearly 80% And Rare Earth Profit Increases By 240.54%
- Analysis Of Development Status And Path Of Alumina Industry In Shanxi Province (Part II)