Methylation Status of the Follistatin Gene at Different Development Stages of Japanese Flounder(Paralichthys olivaceus)
HUANG Yajuan, HU Nan, SI Yufeng, LI Siping, WU Shuxian, ZHANG Meizhao,WEN Haishen, LI Jifang, LI Yun, and HE Feng
The Key Laboratory of Mariculture of Ministry of Education, Fishery College, Ocean University of China,Qingdao 266003, China
(Received October 23, 2017; revised December 8, 2017; accepted May 8, 2018)
? Ocean University of China, Science Press and Springer-Verlag GmbH Germany 2018
Abstract Follistatin (Fst) is a hyperplasia factor that plays a crucial role in muscle development. DNA methylation, a significant process, regulates gene expression. The aim of our study is to examine the DNA methylation and expression patterns of Fst gene at five different development stages of Japanese flounder (stage A, 7 dph; stage B, 90 dph; stage C, about 180 dph; stage D, about 24 months; stage E, about 36 months). The muscle tissue of Japanese flounder was obtained at different development stages in this experiment. DNA methylation levels in the promoter and exon 2 of Fst were determined by bisulfite sequencing, and the relative expression of the Fst gene at the five stages was measured by quantitative PCR. The results showed that the lowest methylation level was at stage A and the highest methylation level was at stage B. Moreover, the highest expression level of the Fst gene was observed at stage A. The mRNA abundance was negatively correlated with DNA methylation level. Three CpG islands in the promoter region and three CpG islands in exon 2 of Fst were found in the binding sequence of the putative transcription factor. These results offered a theoretical basis for the mechanism of Fst gene regulation to muscle development at different development stages.
Key words Japanese flounder; Follistatin; DNA methylation; gene expression; muscle growth
1 Introduction
The muscle tissues of fish are composed of skeletal,cardiac and smooth muscles. Skeletal muscle, which accounts for about 40% of this tissue, constitutes the main part of the trunk (Cheng et al., 2010). Skeletal muscle in fishes results from many muscle precursors through specification, proliferation, differentiation, fuse, hypertrophy among others (Johansen and Overturf, 2005;Olson, 1992; Weatherley et al., 1988). Development of vertebrate skeletal muscle is known to be molecularly controlled, and the Fst gene can regulate muscle growth at the molecular level.
Fst is structurally related to transforming growth factor-β (TGF-β) which presents completely different biological activities from the former (Ueno et al., 1987). Fst,firstly found in the follicular fluid of cattle and pigs during purification of ovarian inhibin and activin, was initially thought to be restricted to a period around the reproductive cycle in higher vertebrates; it has since then been shown to be an essential regulator for muscle de velopment in all periods of post-natal life and plays a very important role during embryological development(Chang et al., 2017; Patel, 1998; Phillips and de Kretser,1998; Robertson et al., 1987). A previous study showed that overexpression of transgenic Fst1 can promote zebrafish muscle growth by enhancing myofiber hyperplasia (Li et al., 2011). Lee and McPherron (2001) reported that Fst overexpression induces an obvious increase in the muscle mass of mice. Moreover, Fst can induce muscle fiber hypertrophy by activating muscle satellite cells and stimulating protein synthesis (Gilson et al., 2009; Lee,2007; Suryawan et al., 2006).
Epigenetics involves the courses that cause changes in genetic activity or associated proteins without altering the DNA sequence (Bird, 1998; Egger et al., 2004). DNA methylation, an important epigenetic process, is the firstdiscovered epigenetic modification, which controls genetic information and modulates gene expression (Ding et al., 2012; Hollidayand Pugh, 2009; Riggs, 1975). Gene expression is affected by the presence of regulatory sequences, configuration of chromatin, and DNA methylation levels (Str?mqvist et al., 2010). DNA methylation reprogramming of the Foxl2, cyp19a1a, and cyp17-II genes was observed during the ovarian development of Japanese flounder in recent research (Ding et al., 2012; Si et al., 2016). The majority of the CpG islands in gene regions located in the promoter, exon 2, and the first intron, thus indicating the significance of these CpG islands in gene regulation (Reamon-Buettner and Borlak, 2007;Tang and Ho, 2007). Many previous studies have concentrated on the gene silencing impacts of methylation of CpG islands and even decentralized sites in the promoter and exon 1 regions (Antequera and Bird, 1999; Si et al.,2016; Huang et al., 2018). However, at present, no information about the methylation level of the promoter and exon 2 of the Fst gene or the relationship between Fst gene expression and the DNA methylation level of the Fst gene promoter and exon 2 during postembryonic different development stages of Japanese flounder has been obtained. The DNA methylation pattern of CpG sites within the promoter and exon 2 is supposed to play vital roles in adjusting gene expression at different stages of postembryonic muscle development.
Japanese flounder is an important mariculture species in Asia because of its high market value and fast growth rate. However, limited research on the genes involved in its skeletal muscle growth is available. While Liu (2006)has studied the expression of Fst in Japanese flounder embryos and its function in muscle development, little research on the expression of Fst gene and the methylation level of the Fst gene and their association during postembryonic muscle development has been done. To understand skeletal muscle growth and the function of factors regulating skeletal muscle growth in Japanese flounder, we researched Fst gene expression in this species via epigenetics. In this experiment, samples of five different muscle development stages were collected, and Fst gene expression in muscle was measured by quantitative real-time PCR. Finally, the methylation map of CpG sites was determined by bisulfate sequencing.
2 Materials and Methods
2.1 Experimental Fish and Data Collection
Healthy Japanese flounder were collected from Donggang District Institute of Marine Treasures in Rizhao,Shandong Province, and brought to Ocean University of China, where they were temporary reared in a 500 L bucket in seawater. About 1000 individuals (about 30 each unit) of larvae weighing about 0.0001 g (stage A, 7 dph), 40 juveniles weighing 2.0 g (stage B, about 90 dph),40 juveniles individuals weighing 6.5 g (stage C, about 180 dph), and two batches of 80 adult individuals weighing about 650 g (stage D, about 24 months) and 1150 g(stage E, about 36 months) were collected. In our experiment and data analysis, samples were collected from 3-5 fishes each stage. All of the fish were euthanized using tricaine methanesulfonate (MS-222), and blood was obtained from the caudal vein using a heparinized 1mL syringe. As fish of stages A and B were very small, blood was not collected from these samples. Body weight,height, length, and total length were measured at each growth stage. Tissue samples were also collected, immediately frozen in liquid nitrogen (In stage A, we cut off redundant tissue and only retain muscle tissue under the microscope), and then stored at -80℃ for genomic DNA and total RNA isolation.
2.2 RNA Isolation and Reverse-Transcription PCR
Total RNA was isolated using TRIzol Reagent (Invitrogen, Carlsbad, CA, USA) following the manufacturer’s protocol. The concentration of extracted total RNA was measured by a Biodropsis BD-1000 nucleic acid analyzer(OSTC, China), and 1% agarose gel was used to check RNA integrity. Reverse transcription was carried out through a two-step method with the Prime Script? RT Reagent Kit (TaKaRa, Dalian, China). The synthesized cDNA was stored at -20℃ until use.
2.3 Quantitative Real-Time PCR
The relative expression abundance of Fst mRNA was determined from total RNA extracted from the muscle of Japanese flounder. Quantitative real-time PCR was performed using the SYBR Premix Ex Taq? (TliRNaseH Plus) Kit (Takara, Japan, Code No. RR420A) on an Applied Biosystems 7300 instrument (Applied Biosystems,Foster City, CA, USA) following the manufacturer’s instructions. The primers used for quantitative PCR are given in Table 1. Reactions were executed in a volume of 20 μL containing 10 μL of SYBR?Premix Ex Taq DNA polymerase (TliRNaseH Plus), 0.4 μL of the PCR forward primer, 0.4 μL of the PCR reverse primer, 2 μL of the cDNA template, and RNase-free water. The quantitative PCR conditions were as follows: denaturation at 95℃ for 30 s, 40 cycles of denaturation at 95℃ for 5 s, annealing at Tm for 30 s, and extension at 72℃ for 30 s. 18S ribosomal RNA, as the reference gene, was amplified under the same conditions. Each sample was run in triplicate,and relative gene expression was calculated using the 2-ΔΔCtmethod (Livak and Schmittgen, 2001). A probability level of P < 0.05 was considered statistically significant.

Table 1 Nucleotide sequences of primers used for real-time PCR
2.4 Genomic DNA Isolation
Genomic DNA was extracted from muscle samples at different development stages using the Marine Animal DNA Kit (TransGen, Beijing, China) following the manu-facturer’s instructions. The concentration and purity of DNA were measured by a Biodropsis BD-1000 nucleic acid analyzer (OSTC, China), and its integrity was evaluated by agarose gel electrophoresis. The genomic DNA was stored at -20℃ until use.
2.5 Analysis of Genetic Structure and Amino Acid Sequence of Follistatin
The transcription factor was predicted using Jaspar software (http://jaspar.genereg.net/), and the conserved gene sequence of Fst was identified from other species,including Sparus aurata (GenBank Accession No. AY544 167.1), Larimichthy scrocea (GenBank Accession No. NM_001303338.1), Oreochromis mossambicus (GenBank Accession no. DQ343148.1), Oreochromis aureus (GenBank Accession No. GU246721.1), Solea senegalensis (Gen-Bank Accession No. EU934045.1), Micropterus salmoides (GenBank Accession No. EF128004.1), and Takifugu rubripes (GenBank Accession No. DQ288127.1) by multiple sequence alignment. The transcription factor binding sites of the Fst coding region were analyzed according to Liu (2006).
2.6 DNA Bisulfite Modification and Analysis
At each development stage, 3-5 fishes were used for bisulfite modification. DNA samples (200 ng) were sodium bisulfite-modified using the Methylamp? DNA Modification Kit (QIAGEN) according to the manufacturer’s instructions. The promoter and exon 2 of Fst (Gen-Bank Accession No. NW_017859673.1) were identified using the online design software MethPrimer (http://www.urogene.org/methprimer/). Primers were designed according to known sequences by Oligo 6.0 (Table 2). The PCR products were cloned into a pEASY-T1 vector (TransGen,Beijing, China); in a typical experiment, 10 clones for each fish were sequenced to determine methylation levels.To evaluate the efficiency of bisulfite modification, we calculated the percentage of the number of converted cytosines relative to the total number of cytosines (excluding cytosines of CpG dinucleotides) using the following formula:


Table 2 Primers used for bisulfate PCR (BS-PCR)
2.7 Statistical Analysis
Data are expressed as means ± standard error. All qRTPCR expression data were log-transformed to ensure normality. Data were analyzed by one-way ANOVA followed by Duncan’s multiple range tests to determine significant differences between samples using SPSS 19.0.Correlations between gene expression and methylation extent were initially examined by Spearman tests using SPSS19.0 (SPSS Co. Ltd., Chicago, IL, USA). Statistical significance was determined at P < 0.05.
3 Results
3.1 Expression of Fst in Muscle Tissue
Quantitative real-time PCR was used to detect the level of expression of Fst in muscle tissue at five different development stages. The expression levels of Fst in muscle in the different development stages are shown in Fig.1.Fst was highly expressed at stage A and then decreased with advancing development stage. Indeed, the highest expression quantity was found at stage A and the lowest expression quantity was observed at stage E.
3.2 Structure Analysis of Fst Gene
The CpG-rich region in the Fst promoter (GenBank
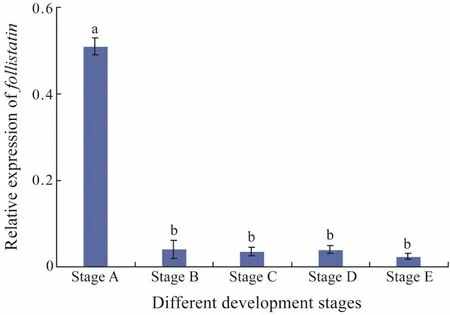
Fig.1 mRNA expression of Fst in the muscle of five different development stages of Japanese flounder. Each histogram represents the mean of three determinations.Values are expressed as mean ± standard error of mean.Different letters indicate significant difference (P < 0.05,one-way ANOVA, followed by Duncan’s test).
Accession No. NW_017859673.1) was predicted to be 234 bp in length, including 8 CpG sites (Fig.2A). This study found that the CpG sites in positions -441 bp and-369 bp of the Fst promoter located in a putative sequence for Myog and Myod1 transcription factors. Fig.2B shows that exon 2 of the Fst coding region includes 8 CpG sites, 3 of which located at the predicted binding sites for transcription factors such as Myog, Myod1, SP1, and USF1.
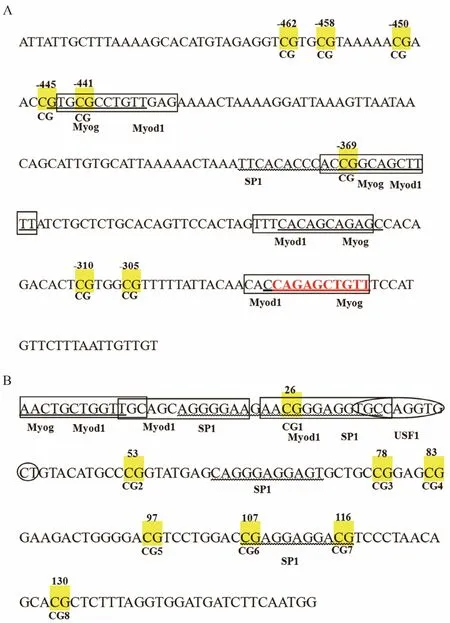
Fig.2 (A) Gene structure analysis of Fst. The yellow boxes indicate CpG dinucleotide sites on the promoter of the Fst gene. The binding sequences of Myog, Myod1, and SP1 are marked by an underscore, black boxes, and wavy lines, respectively. Numbers with a minus sign indicate CpG positions with respect to the transcription starting site. (B) CpG sites inexon 2 of the Fst gene are marked with yellow boxes. The underscore, black boxes, wavy lines, and oval indicate the binding sequences of Myog, Myod1, SP1, and USF1, respectively.
3.3 Relationship Between the DNA Methylation Level of the Promoter and Exon 2 of Fst and Fst Expression Level at Different Development Stages
To detect the methylation level of the Fst gene in P.olivaceus, we chose the promoter and exon 2 of this gene.The muscle tissue of Japanese flounder at different development stages was used in this experiment to extract DNA. The PCR products of bisulfite modification were evaluated by agarose gel electrophoresis, and the results revealed that all products were consistent with the anticipated objective strap size (Fig.3A). A portion of the sequencing diagram is shown in Fig.3B. Evaluation of the efficiency of bisulfite treatment showed that all C units were converted to T units in all copies of three different samples of the CpG dinucleotide sequences analyzed.This finding implies that the DNA modification procedure applied to this work was very efficient.
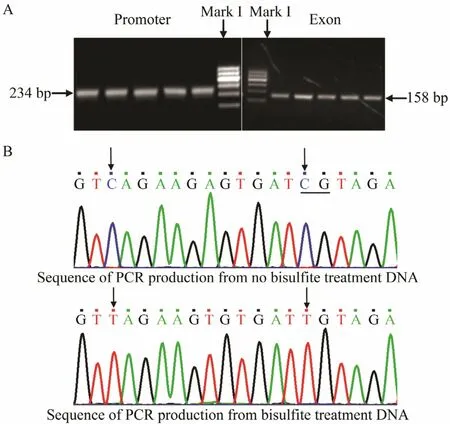
Fig.3 PCR production electrophoresis results of bisulfitetreated DNA in the (A) promoter and exon 2 and (B) the resulting DNA sequence.
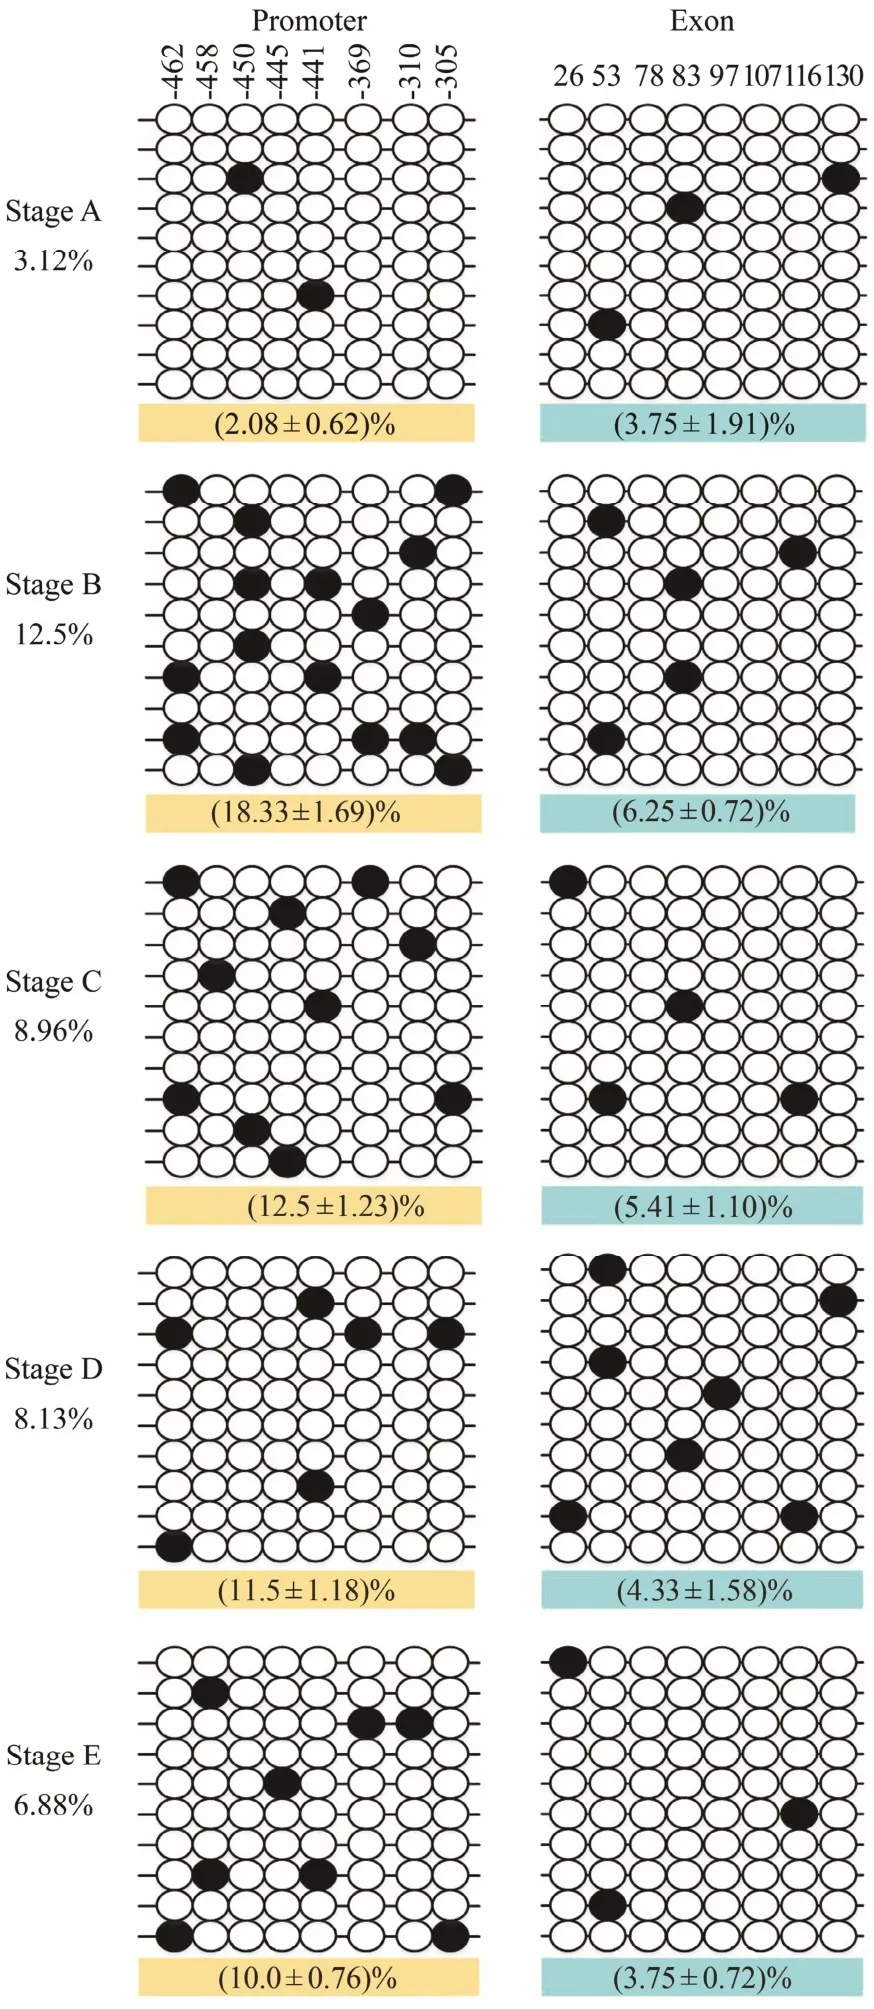
Fig.4 DNA methylation patterns of the promoter and exon 2 of Fst. An open circle represents an unmethylated CpG,and a solid circle represents a methylated CpG. Each line represents one sequenced clone. Numbers with a plus sign indicate CpG positions with respect to the transcription starting site. The first line indicates the localizations of studied CpG sites related to the sequence of MyoD. The percentage indicates the methylation level (the percentage on the left indicates the average methylation level of each stage; the percentage on the bottom indicates the average methylation level of the promoter and exon 2, respectively)calculated as the number of methylated CpG sites per total number of CpG sites in each stage. Data are reported as mean ± SEM. Average methylation was calculated for all CpG sites in each stage using 3-5 fish samples. In a typical experiment, 10 clones for each fish were used to determine DNA methylation levels.
The CpG dinucleotide methylation status in the promoter and exon 2 of Fst was detected by bisulfite conversion and subsequent DNA sequencing. The DNA methylation patterns observed are shown in Fig.4. The promoter and exon 2 of Fst showed similar methylation levels,which increased from stage A to stage Band then gradually declined from stage B to stage E. The maximal methylation level occurred in stage B, and the minimum methylation level was observed in stage A. Eight CpG sites could be found in the promoter, and the methylation levels for each CpG position in different development stages were determined. As shown in Fig.5A, DNA methylation of every CpG site in the promoter approximately increased from stage A to stage B and then declined from stage B to stage E. In addition, the CpG sites at -445 bp, -441 bp, and -369 bp located in the binding sequence of TFs. The change trends of eight CpG sites in exon 2 are shown in Fig.5B. DNA methylation levels at each CpG position first increased and then decreased,with a peak appearing at stage B. However, no significant difference in methylation level between the different development stages could be observed. The methylation level of each CpG site in the promoter is shown in Fig.6A;here, the methylation level of the CpG site at -441 bp was significantly higher than that of other CpG sites. Again,methylation levels between each CpG site in exon 2 demonstrated no significant difference.
As shown in Fig.7, the methylation level of each CpG site in exon 2 is relatively lower in comparison with that in the promoter, but the total methylation levels of the two CpG-rich regions in the Fst gene showed nearly identical trends. These results suggested that the average methylation level in stage B is higher than that in other stages. The relationship between the DNA methylation levels of the promoter and exon 2 and Fst gene expression are also provided in Fig.6. Average Fst methylation levels showed a strongly negative correlation with gene expression in the different development stages. The methylation levels of the promoter and exon 2, which were low in stage A, increased in stage B, and then decreased from stages B to E, also contrasted their gene expression levels.
4 Discussion
Little information on the epigenetics of fish muscle growth is available. While some research on the DNA methylation levels involved in Japanese flounder reproduction (Ding et al., 2013; Si et al., 2016) is available and research on the quantitative expression of genes related to fish muscle growth and molecular genetics (Antequera and Bird, 1999; Asaduzzaman et al., 2013; Dadasaheb et al., 2016; Johansen and Overturf, 2005; Patel, 1998;Salem et al., 2005; Tan et al., 2002) is extensive, very few studies on epigenetics in relation to Japanese flounder muscle growth has been performed. DNA methylation has been widely researched because its heritable epigenetic modifications and involvement in most cellular processes(Huang et al., 2014). DNA methylation exerts great effects on the regulation of gene expression and is critical for repressing gene expression during development (Cedar and Bergman, 2009). Japanese flounder is an important economic fish, as its skeletal muscle accounts for the main part of the trunk. Skeletal muscle growth is regulated by many genes, including the Fst gene, which can promote muscle growth by enhancing myofiber hyperplasia (Li et al., 2011).
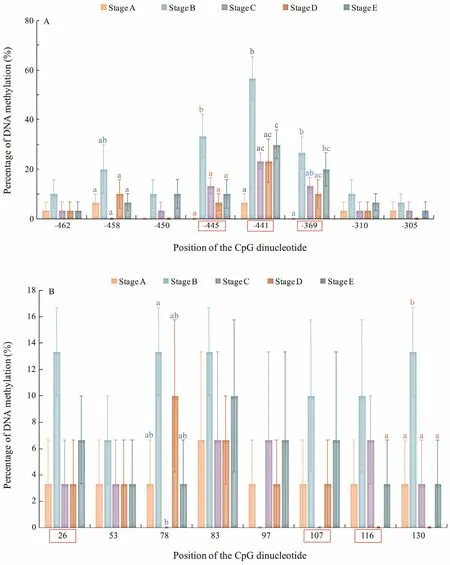
Fig.5 DNA methylation levels of the (A) promoter and (B) exon 2 of the Fst gene at different development stages. CGs in the red orthogon are located in the binding sequences of the TFs.

Fig.6 DNA methylation level trends of each CG in the (A) promoter and (B) exon 2 of the Fst gene. Each histogram represents the mean methylation level of 15 determinations (all stages, three samples per stage). Values are expressed as mean ± standard error of mean. Different letters indicate significant difference (P < 0.05, one-way ANOVA, followed by Duncan’s test).
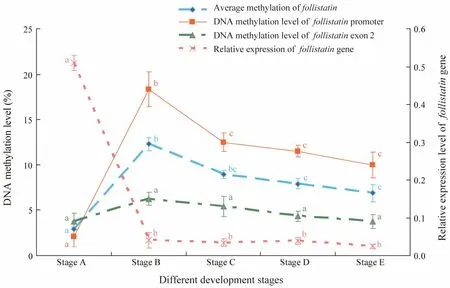
Fig.7 Correlation between the gene expression and CpG methylation level of the Fst gene at different development stages.Values represent mean ± standard error of mean. Different letters indicate significant difference (P < 0.05, one-way ANOVA, followed by Duncan’s test).
Numerous studies have shown that miRNAs play a vital role in regulating gene expression during Japanese flounder metamorphosis (Fu et al., 2013; Power et al.,2008). A considerable amount of work has also been done on mRNA expression during the different phases of metamorphosis of this species (Bao et al., 2005; Chen et al., 2010; Fu et al., 2011; Yu et al., 2016; Zhang et al.,2014). However, research on the variation of DNA methylation and gene expression and their correlation before and after Japanese flounder metamorphosis is limited. In this research, we analyzed the DNA methylation status of the Fst gene in five different development stages, from myogenesis to muscle maturation, to determine whether epigenetic modification of the Fst gene is responsible for larval and adult skeletal muscle growth and development.We found the lowest average methylation level in stage A and the highest methylation level in stage B; thus, we propose that hyperplasia of skeletal muscles declines gradually from stage A to stage B. In other words, the muscle growth observed from stages A to B may not be a result of myofiber hyperplasia. Alternatively, a lower methylation level may exist between stages A and B, and this lower point may indicate the metamorphic climax.Metamorphosis, the process by which the symmetrical larvae becomes an asymmetric juvenile (Power et al.,2008), is an essential phase in the life of Japanese flounder. Muscle growth is an extremely important and complex biological process in the metamorphic development of flounder. Metamorphosis in flatfish is accompanied by changes in the isoform expression of several muscle genes (Power et al., 2008). Our results reveal that the greatest changes in Fst gene expression and methylation occur during metamorphosis. We thus infer that the Fst gene plays a critical role in the early stages of muscle development. Japanese flounder requires building up of skeletal muscle in preparation for metamorphosis before the metamorphic climax.
In this study, we examined relative Fst expression in five different development stages of Japanese flounder,and the results obtained differed from the findings in previous research. Liu (2006) reported that Fst gene expression is not found in mature muscle tissue. Nonetheless, in our study, significantly higher mRNA expression levels were observed in stage A in comparison with that in other stages, and the Fst gene was expressed in mature muscle tissue but only at very low levels. Evidence has shown that Fst can antagonize the function of the myostatin gene(Amthor et al., 2004; Louise et al., 2009; Regina, 2014),the most powerful inhibitor of muscle growth. Given the metamorphic climax exhibited between stages A and B,we suppose that higher levels of Fst expression may occur at this climax, after which it declines. The Fst gene may accelerate the muscle hyperplasia and inhibit the effect of the myostatin gene. From stages B to E, the relative expression of Fst gene was generally low. This phenomenon may be explained in two ways: 1) hypertrophy may be the main factor affecting muscle growth after metamorphosis and 2) the Fst gene may exert only slight effects on muscle growth in later development stages.Many other genes may regulate muscle growth in these stages (Akolkar et al., 2016; Carani et al., 2013; Nakatani et al., 2007; Regina, 2014).
DNA methylation was negatively correlated with gene expression level. DNA methylation is generally known to play a crucial role in regulating gene expression, and proper DNA methylation is imperative to the function of genes (Jones and Takai, 2001; Zhu et al., 2015). However,factors that affect gene expression are not only limited to DNA methylation. Recent evidence has shown that the factors influencing gene expression include environmental factors and modification of histones and transcription factors (Down et al., 2009; Jaenisch and Bird, 2003;Morgan et al., 2005). Interestingly, -445 bp, -441 bp, and-369 bp were located at the Myog and Myod1 transcription factor binding sequence in the promoter, and the methylation level of -441 bp was significantly higher than that in other CpG sites. Myog and Myod1 are members of the bHLH factor family, which has been observed in many animals, such as mammals, birds, sea urchins,nematodes, frogs, and even insects (Olson, 1990; Olson and Klein, 1994; Sassoon, 1993; Turner, 2009; Weintraub et al., 1989). Myog, along with Myod, acton some genes expressed late in myogenic differentiation (Cao et al.,2006). The -441 bp CpG site may play an important role in regulating transcription. The 26 bp, 107 bp, and 116 bp sites in exon 2 were located in the SP1 transcription factor binding sequence. Necela et al. (2008) found that knock-down of SP1 expression relieves repression of Fst levels. Taken together, the results imply that DNA methylation, together with other factors, may regulate gene expression and suggest that DNA methylation acts synergistically with other factors in regulating gene expression.Further research on genome methylation may be undertaken to determine whether Fst, as well as other genes,regulates muscle growth before or after metamorphosis.We further conjecture that a higher methylation point may exist between stage A and stage B due to the development of the metamorphic climax between these stages. High DNA methylation levels noticeably tended to suppress transcription, and more data are required to reveal the exact influence of this tendency. The metamorphosis phase requires more research to determine which factors affect gene expression and promote muscle growth.
5 Conclusion
The DNA methylation level and expression patterns of the Fst gene were examined at five different development stages of Japanese flounder. Fst gene expression declined form stage A to stage B and remained low at later stages.In fact, the expression of this gene appeared to have little effect on muscle growth at later stages. The methylation level analysis of Fst showed that six CpG sites in the Fst promoter and exon 2 located at the SP1, Myog, USF1,and Myod1 binding sequences, especially at the -441 bp CpG site of the promoter. This result reveals that transcription factors affect gene expression. The average methylation levels of the promoter and exon 2 in Fst were negatively correlated with gene expression at the five development stages, thus indicating that DNA methylation in the Fst promoter and exon 2 affects gene expression. Our research helped to illustrate the molecular mechanism of fish muscle growth from the epigenetic point of view at different development stages.
Acknowledgements
This research was supported by Natural Science Foundation of Shandong Province, China (No. ZR2014CM 018), the National Natural Science Foundation of China(No. 31672642) and the AoShan Talents Program Supported by Qingdao National Laboratory for Marine Science and Technology (No. 2017ASTCP-ES06). It is appreciated that the comments from editors and reviewers have greatly improved our manuscript.
 Journal of Ocean University of China2018年5期
- Journal of Ocean University of China的其它文章
- Effect of Different Dietary Protein and Lipid Levels on the Growth, Body Composition, and Intestinal Digestive Enzyme Activities of Juvenile Yellow Drum Nibea albiflora (Richardson)
- Establishing Gene Delivery Systems Based on Small-Sized Chitosan Nanoparticles
- Taxonomic Clarification of A Well-Known Pathogenic Scuticociliate, Miamiensis avidus Thompson &Moewus, 1964 (Ciliophora, Scuticociliatia)
- Structural Variation Analysis of Mutated Nannochloropsis oceanica Caused by Zeocin Through Genome Re-Sequencing
- A Comparative Study on Hydrodynamic Performance of Double Deflector Rectangular Cambered Otter Board
- Characterization of Polysaccharides Extracted from a Cultivated Brown Alga Costaria costata During the Harvest Period
