
A Comparative Study on Hydrodynamic Performance of Double Deflector Rectangular Cambered Otter Board
2018-08-28 09:07:36XUQingchangFENGChunleiHUANGLiuyiXUJiqiangWANGLeiZHANGXunLIANGZhenlinTANGYanliZHAOFenfangandWANGXinxin
XU Qingchang, FENG Chunlei, HUANG Liuyi, , XU Jiqiang, WANG Lei,ZHANG Xun, LIANG Zhenlin, , TANG Yanli, ZHAO Fenfang,and WANG Xinxin
1) College of Fisheries, Ocean University of China, Qingdao 266003, China
2) East China Sea Fisheries Research Institute, Chinese Academy of Fishery Sciences, Shanghai 200090, China
3) Marine College, Shandong University, Weihai 264209, China
(Received August 16, 2017; revised November 13, 2017; accepted June 3, 2018)
? Ocean University of China, Science Press and Springer-Verlag GmbH Germany 2018
Abstract In the present work, the hydrodynamic performance of the double deflector rectangular cambered otter board was studied using wind tunnel experiment, flume tank experiment and numerical simulation. Results showed that the otter board had a good hydrodynamic performance with the maximum lift-to-drag ratio (KMAX = 3.70). The flow separation occurred when the angle of attack (AOA) was at 45?, which revealed that the double deflector structure of the otter board can delay the flow separation. Numerical simulation results showed a good agreement with experiment ones, and could predict the critical AOA, which showed that it can be used to study the hydrodynamic performance of the otter board with the advantage of flow visualization. However, the drag coefficient in flume tank was much higher than that in wind tunnel, which resulted in a lower lift-to-drag ratio. These may be due to different fluid media between flume tank and wind tunnel, which result in the big difference of the vortexes around the otter board.Given the otter boards are operated in water, it was suggested to apply both flume tank experiment and numerical simulation to study the hydrodynamic performance of otter board.
Key words wind tunnel experiment; flume tank experiment; numerical simulation; double deflector rectangular cambered otter board; hydrodynamic performance
1 Introduction
The otter board, which is designed to maintain the horizontal opening of the trawl net, is a vital component for a trawl system (Niedzwiedz and Hopp, 1998). It requires high lift-to-drag ratio, which is directly related to the fishing efficiency of single trawling. In order to improve the hydrodynamic efficiency of the otter board,many researchers paid attentions to the physical design of the otter board in the past decades. Yamasaki et al. (2007)designed a high-lift V type otter board to improve the otter board used in a semi-pelagic trawl net in Ise-wan Bay; its lift-to-drag ratio was 1.41 times higher than that of the conventional rectangular otter board. Sala et al.(2009) designed a new otter board, the Clarck-Y door, to improve the water flow on the upper part of the otter board to avoid vortices. The flume test results showed a higher efficiency (1.33 times) than the cambered V type otter board. A fundamentally different design of otter board, namely ‘Batwing’, had been proposed by Sterling(2008, 2010). In this design, a flexible sail was utilized to operate at a low AOA, and a seabed-contact shoe aligned with tow direction. The experiment results showed a greater (3 times) efficiency than the flat rectangular otter board (Balash and Sterling, 2014). Hu et al. (2015) designed a ‘High-lift’ otter board, which used the airfoil structures to improve the lift coefficient and the lift-todrag ratio. The double defector rectangular cambered otter board used in the present work was a new design combining the advantages of the above otter boards.
The resistance of otter board accounts for up to 30% of the total-system drag according to Sterling (2000). Therefore, research on the hydrodynamic performance of otter boards has a great significance for energy saving. Kawakami et al. (1953) constructed theoretical equations of otter board and verified them by model tests. Matuda et al.(1990) measured the maximum lift coefficient (1.27) and lift-to-drag ratio (4.03) of vertical V-type otter board by conducting flume tank experiment. Shen et al. (2015)studied the hydrodynamic performance of a hyper-lift otter board by flume experiment. Zhang et al. (2004)studied the relationship between cambered ratio and hydrodynamic characteristics of the cambered V type otter board through wind tunnel experiments. Wang et al.(2016) studied the effect of vane length on hydrodynamic performance of single slotted cambered otter board by wind tunnel experiment. Takahashi et al. (2015) studied the hydrodynamic performance of a biplane-type otter board using computational fluid dynamics (CFD). CFD analysis was in agreement with the results of flume tank experiment. Xu et al. (2016, 2017a, b) optimized the rectangular and V type otter board using numerical simulation, and obtained the optimal parameters of the otter board.
Generally, theoretical analysis, flume tank tests, wind tunnel experiment, and numerical simulation were the main methods of studying the hydrodynamic performance of otter board. The present work studied the hydrodynamic performances of a double defector rectangular cambered otter board using flume tank experiment, wind tunnel experiment and numerical simulation, and analyzed the suitable methods for studying otter boards by comparing the results of three methods.
2 Materials and Methods
2.1 Model Otter Board
The double defector rectangular cambered otter board was made of steel and worked at a speed of 3 -4 kn. Its main dimensions were given as: the wing span l = 2.2 m,the chord c = 2.2 m, the plane area S = 4.84 m2and the aspect ratio AR = 1.
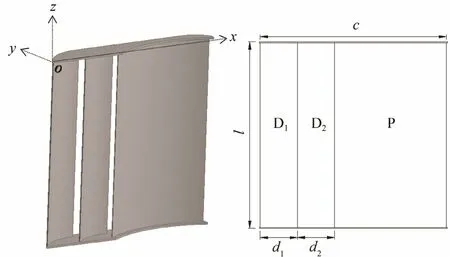
Fig.1 The structure of the model otter board (the coordinate frame on it was used to calculate the center-of-pressure).
Fig.1 shows the sketch of the model otter board. D1and D2are the defectors, P is the main panel, d1and d2are the horizontal intervals between defectors and the main panel.The model otter board was designed based on the similarity criterion of Froude’s law. The relationships between the plane area of otter board and the flow velocities are given in the following equations:
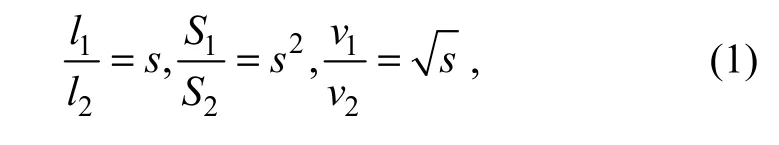
where the subscript ‘1’ represents the prototype while the subscript ‘2’ designates the model, v is the velocity, s is the scale ratio and s = 4.4 in the present work. The main parameters of the model otter board are shown in Table 1.
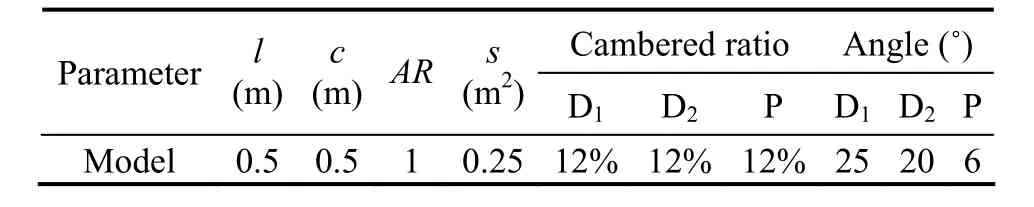
Table 1 Parameters of the model otter board
2.2 Wind Tunnel Experiment
Wind tunnel experiments were conducted in a wind tunnel of Aeronautics and Astronautics at Nanjing University (testing section: length 6.0 m, width 2.5 m and depth 3.0 m). The stable wind velocity of the tunnel ranged from 5 to 90 m s-1. The tunnel was equipped with a six-component force sensor (range: 0-60 kg; accuracy:0.1%). During the experiments, the wind velocity was set to be 28 m s-1(Re= 0.93×10⁶), and the AOA varied between 0? and 70? at a increment of 5?. The velocity was designed based on the self-modeling region of Reynolds number (i.e., Re= 104-107, Xia et al., 2014), in which the hydrodynamic coefficients are independent of Reynolds number and show almost constant values.
2.3 Flume Tank Experiment
Flume tank experiments were conducted in the flume tank at the Ocean University of China (testing section:length 4.0 m, width 1.2 m and depth 1.0 m). The stable water velocity ranged from 0.1 to 0.8 m s-1. The flume tank was equipped with Vectrino+current meters (range:0-2 m s-1; accuracy: ± 0.5%) and six-component force sensor (range: 0-50 kg; accuracy: 0.3%). The water velocity was set to be 0.2-0.6 m s-1(at an increment of 0.05 m s-1), i.e., Re= 0.11-0.34×10⁶, during the experiments and the AOA was in the range of 0?-70? (at an increment of 5?). The experiment data were measured by data acquisition instrument (Beijing Wavespectrum Science and Technology Co., Ltd.) at a sampling frequency of 100 Hz within a measuring time of 90 s. During data processing of experiments results, the model otter board was in the self-modeling region of Reynolds number when Re>0.17×10⁶(i.e., v > 0.3 m s-1), hence, the values of lift/drag coefficients for flume tank experiments were the average values in the self-modeling region.
2.4 Numerical Simulations
The numerical CFD code ANSYS 15.0 was adopted for numerical simulation. In the calculations, the finite-volume method was used to solve the Reynolds-averaged Navier-Stokes equations. The k-ε EARSM turbulence model (Wallin and Johansson, 2002) was adapted to the simulation and scalable wall treatment was employed for the wall function.
Wind tunnel and flume tank were simulated respectively, and the simulation conditions were completely consistent with the experiment conditions. The testing section was taken as the calculation domain, i.e., 6.0 m ×2.5 m × 3.0 m for wind tunnel simulation and 4.0 m × 1.2 m× 1.0 m for flume tank simulation. Table 2 shows the parameter settings of the numerical simulation. During the calculations, the grids were generated to unstructured meshes, while the meshes around the otter board were refined locally. For the wind tunnel simulation, the number of grid elements totaled approximately 2.44 × 10⁶with the node elements totaling 4.42 × 10⁵, the y+around the otter board was in the range of 11.06-89.01 and the turbulence intensity was 2.30%. For the flume tank simulation, the grids were 2.14×10⁶with the nodes of 3.62×10⁵,
y+
=11.06-67.95 and the turbulence intensity was 3.00%-3.44%.
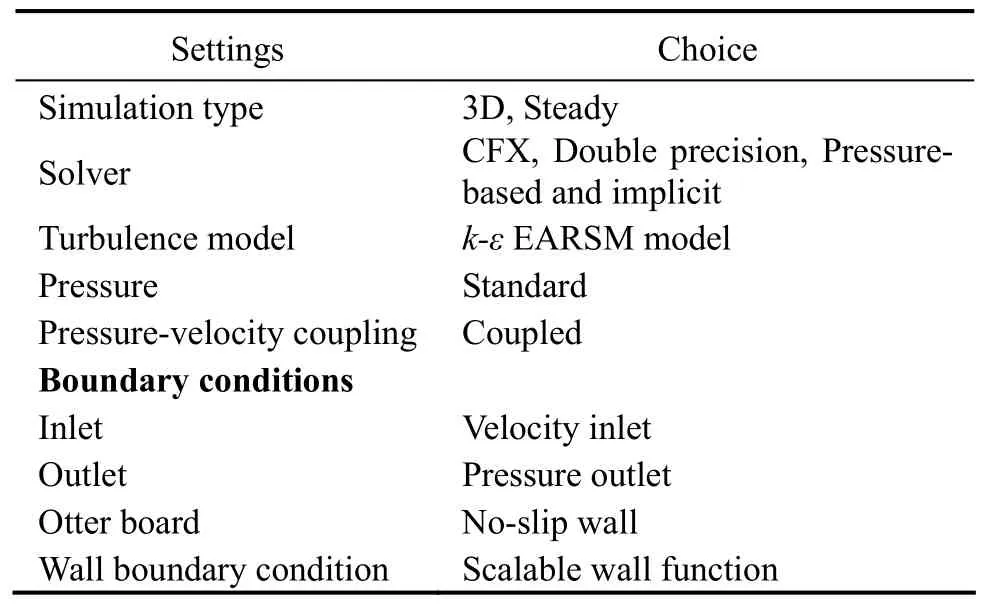
Table 2 Parameter settings of the numerical simulation
2.5 Data-Processing
The lift/drag coefficients (CLand CDrespectively) and the moment coefficients Cmx, Cmzcan be calculated according to the measured value of lift force FL, drag force FD, moments Mxand Mzas follows:
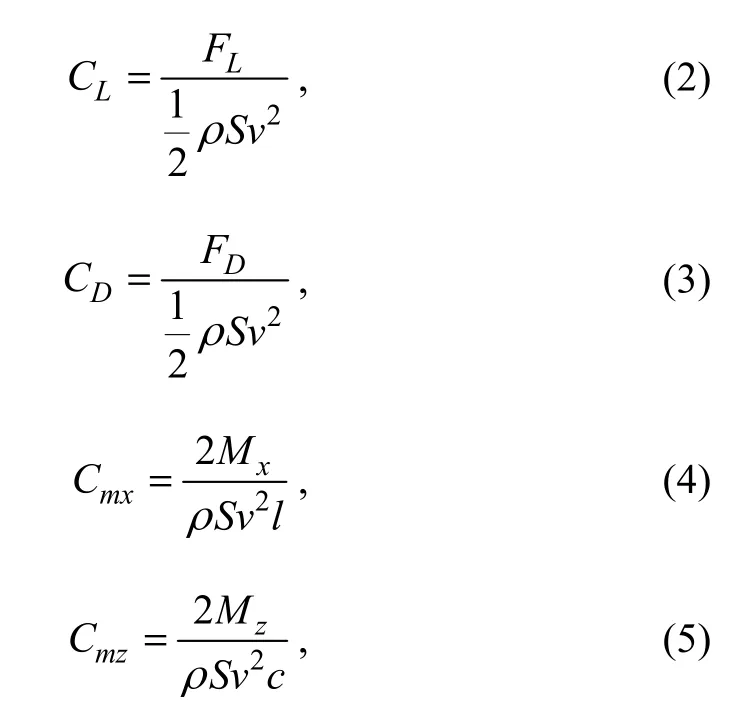
where, FLand FDare the measured lift and drag forces respectively, ρ is the fluid density, S is the plane area of the otter board, v is the actual velocity of incoming flow, l is the span and c is the chord, Mxand Mzare moments around the top (x-axis in Fig.1) and the leading edge(z-axis in Fig.1) of the otter board respectively.
The center-of-pressure coefficients are described by the following equations:
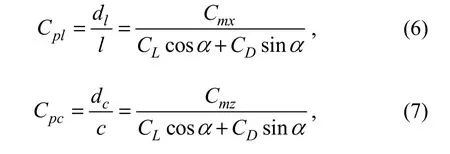
where, Cpland Cpcare the center-of-pressure coefficients in the span and chord directions, respectively, which are expressed as the relative positions of the hydrodynamic forces acting on the otter board in the directions of span and chord; dland dcare the distances from the top and leading edge to the center-of-pressure; α is the AOA and K is the lift-to-drag ratio.
3 Results
3.1 Lift Coefficient of the Otter Board
Fig.2 shows the lift coefficient (CL) of the otter board in relation to AOA. The lift coefficient increased and then decreased with an increasing AOA. Simulation results had the same changing tendency as experiment results,but the values were a little higher. The measured maximum lift coefficient CL-MAXfrom the flume tank experiment was 2.079 with the critical AOA of 45?-50?, and the values were 2.173 from the flume tank simulation (the simulated error was 4.52%) with the above mentioned critical AOA. While for the wind tunnel, the values were CL-MAX=1.812 with critical AOA of 45?-55? in experiment results and CL-MAX= 1.831 (the simulated error was 1.05%)with critical AOA of 45?-55? in simulation results. In addition, the maximum values in flume tank experiment were higher (about 1.15 times) than those in wind tunnel experiment. The lift coefficient had a negative value at 0 degree AOA in wind tunnel experiment while it did not appear at 0 degree AOA in the flume tank experiment.
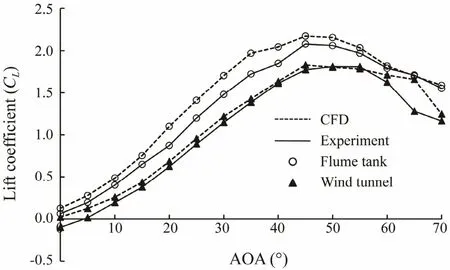
Fig.2 Lift coefficient of the otter board in relation to the angle of attack.
3.2 Drag Coefficient of the Otter Board
The drag coefficients (CD) against AOA are shown in Fig.3. Simulation results were in agreement with those of both the flume tank and wind tunnel experiment, and the drag coefficient increased with an increasing AOA. However, when the AOA was over 30?, the drag coefficient in flume tank experiment continued to increase rapidly with an increasing AOA, while it increased slowly in wind tunnel experiment. Hence, the drag coefficients in flume tank experiments were much higher than that in wind tunnel experiments when the otter board was attacked at
large angles (i.e., AOA=50?-70?). The measured drag coefficient was in the range of 0.111-2.656 for flume tank experiment, and was 0.077-2.461 for flume tank simulation, while the values were 0.137-1.343 for wind tunnel experiment and 0.077-1.396 for wind tunnel simulation.
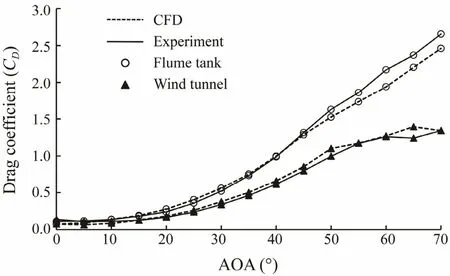
Fig.3 Drag coefficient of the otter board in relation to the angle of attack.
3.3 Lift-to-Drag Ratio of the Otter Board
Fig.4 shows the lift-to-drag ratio (K) of the otter board in relation to AOA. It showed the same changing tendency between experiment results and simulation results,i.e., the lift-to-drag ratio increased and then decreased with the increasing AOA. When AOA was less than 20?,the K in flume tank experiment (simulation) was larger than that in wind tunnel experiment (simulation). On the contrary, when the AOA exceeded 20?, the K was lower in flume tank compared with that in wind tunnel. The measured maximum lift-to-drag ratio in flume tank experiment was KMAX=3.640 with the AOA of 20?, and the values were KMAX=3.975 (the simulated error was 9.20%) with the same AOA in flume tank simulation. While for the wind tunnel, the values were KMAX=3.753 with the AOA of 20? in experiment results and KMAX=3.769 (the simulated error was 0.43%) with the same AOA in simulation.
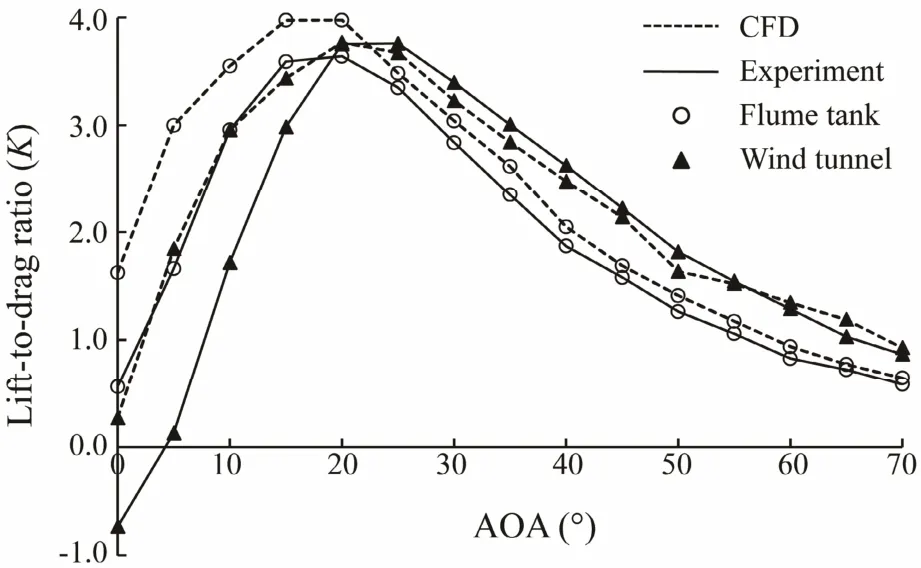
Fig.4 Lift-to-drag ratio of the otter board in relation to the angle of attack.
3.4 Center-of-Pressure Coefficients of the Otter Board
The center-of-pressure coefficients (Cpland Cpc) related to AOA is shown in Fig.5. As only the moment of Mzwas measured, we just obtained the curves of center-of-pres-
sure in the chord direction (Cpc) for experiment data. It showed that the center-of-pressure coefficients decreased with the increasing AOA (20?-60?) and then increased(60?-70?). Flume tank experiment (simulation) showed that the center-of pressure point moved to the leading edge with the AOA and then moved to trailing edge with an increasing AOA. The measured Cpcwas in the range of 0.448-0.566 in flume tank experiment, and Cpcwas 0.464-0.541, Cplwas 0.495-0.500 in flume tank simulation. While for the wind tunnel, the Cpcwas 0.456-0.731 in experiment results and Cpcws 0.436-0.707, Cplwas 0.447-0.774 in simulation results; the center-of pressure point moved to the upward and leading edge with the increasing AOA and then moved reversely.
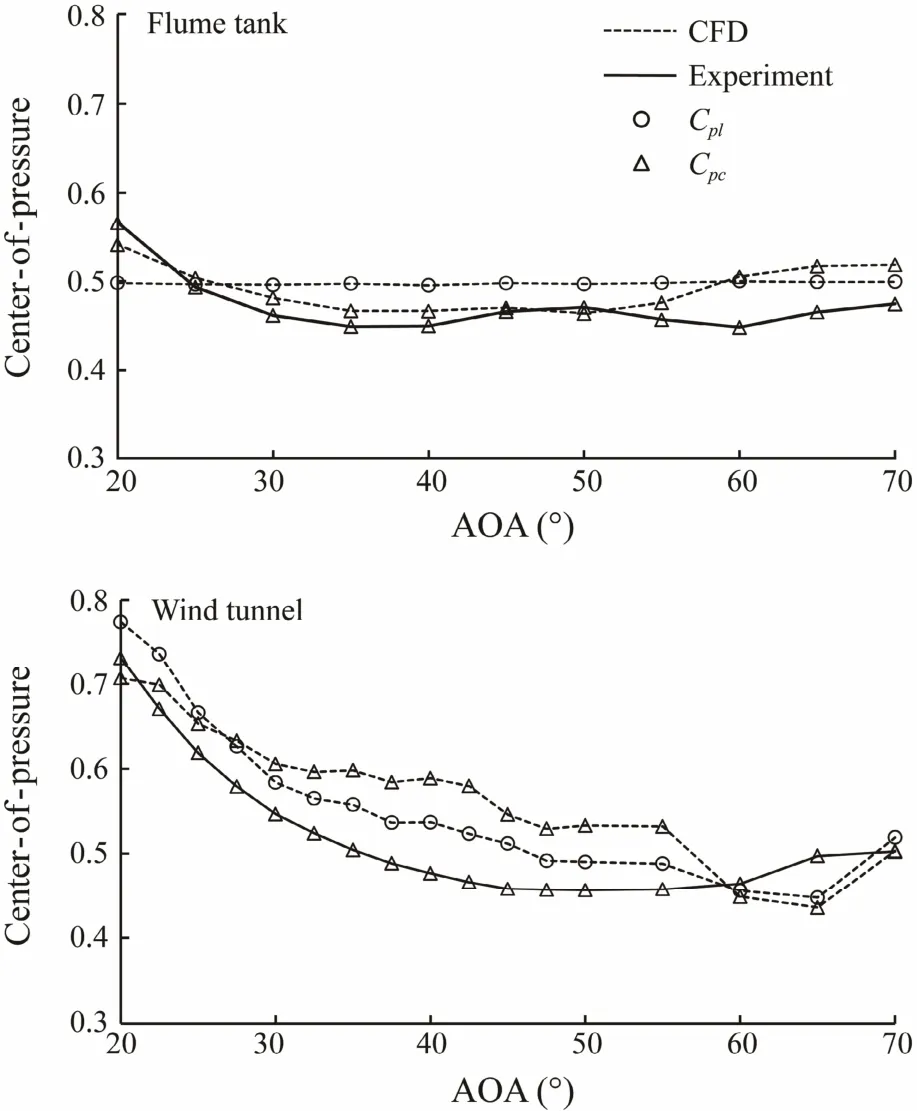
Fig.5 The center-of-pressure coefficients (Cpl and Cpc) in relation to the angle of attack (top, the flume tank; bottom,the wind tunnel).
3.5 Flow Distribution Around the Otter Board
According to the above results, simulation results showed a good agreement with the experiment results; the flow distribution around the otter board was analyzed based on the simulation results. The flow streamlines from a horizontal plane cutting through the center section of the otter board are shown in Fig.6. The vorticity diagram is illustrated in Fig.7.
The streamlines in the center section of the otter board(Fig.6) were similar between flume tank simulation and wind tunnel simulation. It showed no separation at AOA of 35? and the flow was smooth. At AOA of 45?, a separation was confirmed on the leading edge of the otter board and eddies were observed on the lee side of the otter board. As the AOA increased, more eddies developed and began to shed, and streamline on both sides of the otter board became more concentrated.
The vorticity diagrams (Fig.7) showed big differences between flume tank simulation and wind tunnel simulation, i.e., the vorticity around the otter board of the wind tunnel simulation was much higher than that of flume tank simulation. Flume tank simulation results showed that the region of wing-tip vortex increased at AOA of 35?-45?. The vortex cores moved inward at AOA of 45?-55? and began to interact with each other at AOA of 65?. Whereas wind tunnel simulation just obtained wingtip vortex at AOA of 35?, the vortex cores moved inward and began to combined at AOA of 45?, and the vortex cores almost combined into a larger vortex at AOA of 65?.
4 Discussion
Comparing with conventional rectangular otter board(CL-MAX=1.07, KMAX=1.50) (Xu et al., 2016), V type otter board (CL-MAX=1.08, KMAX=1.86) (Li et al., 2013) and vertical V type cambered otter board (CL-MAX=1.40, KMAX=2.917) (Wang et al., 2004), the double defector rectangular cambered otter board has a better hydrodynamic performance (CL-MAX=2.079, KMAX=3.640). The streamline around the otter board (Fig.6) showed that stall appeared at AOA of 45?, which was higher than that of both biplane-type otter board (Takahashi et al., 2015) and hyper-lift otter board (Shen et al., 2015). It revealed that the structure of this otter board can delay the flow separation appearing. As a result, the critical AOA of this otter board was large. When the AOA was lower than critical AOA,the lift coefficient increased with an increase in the AOA until stall appeared. Therefore the maximum lift coefficient of the double defector rectangular cambered otter board was much larger than that of conventional otter boards. As the parameters of the otter board (AR, camber ratio, etc.) were designed based on experience, therefore,it needs to be optimized to improve the hydrodynamic performance of the otter board in the further study.
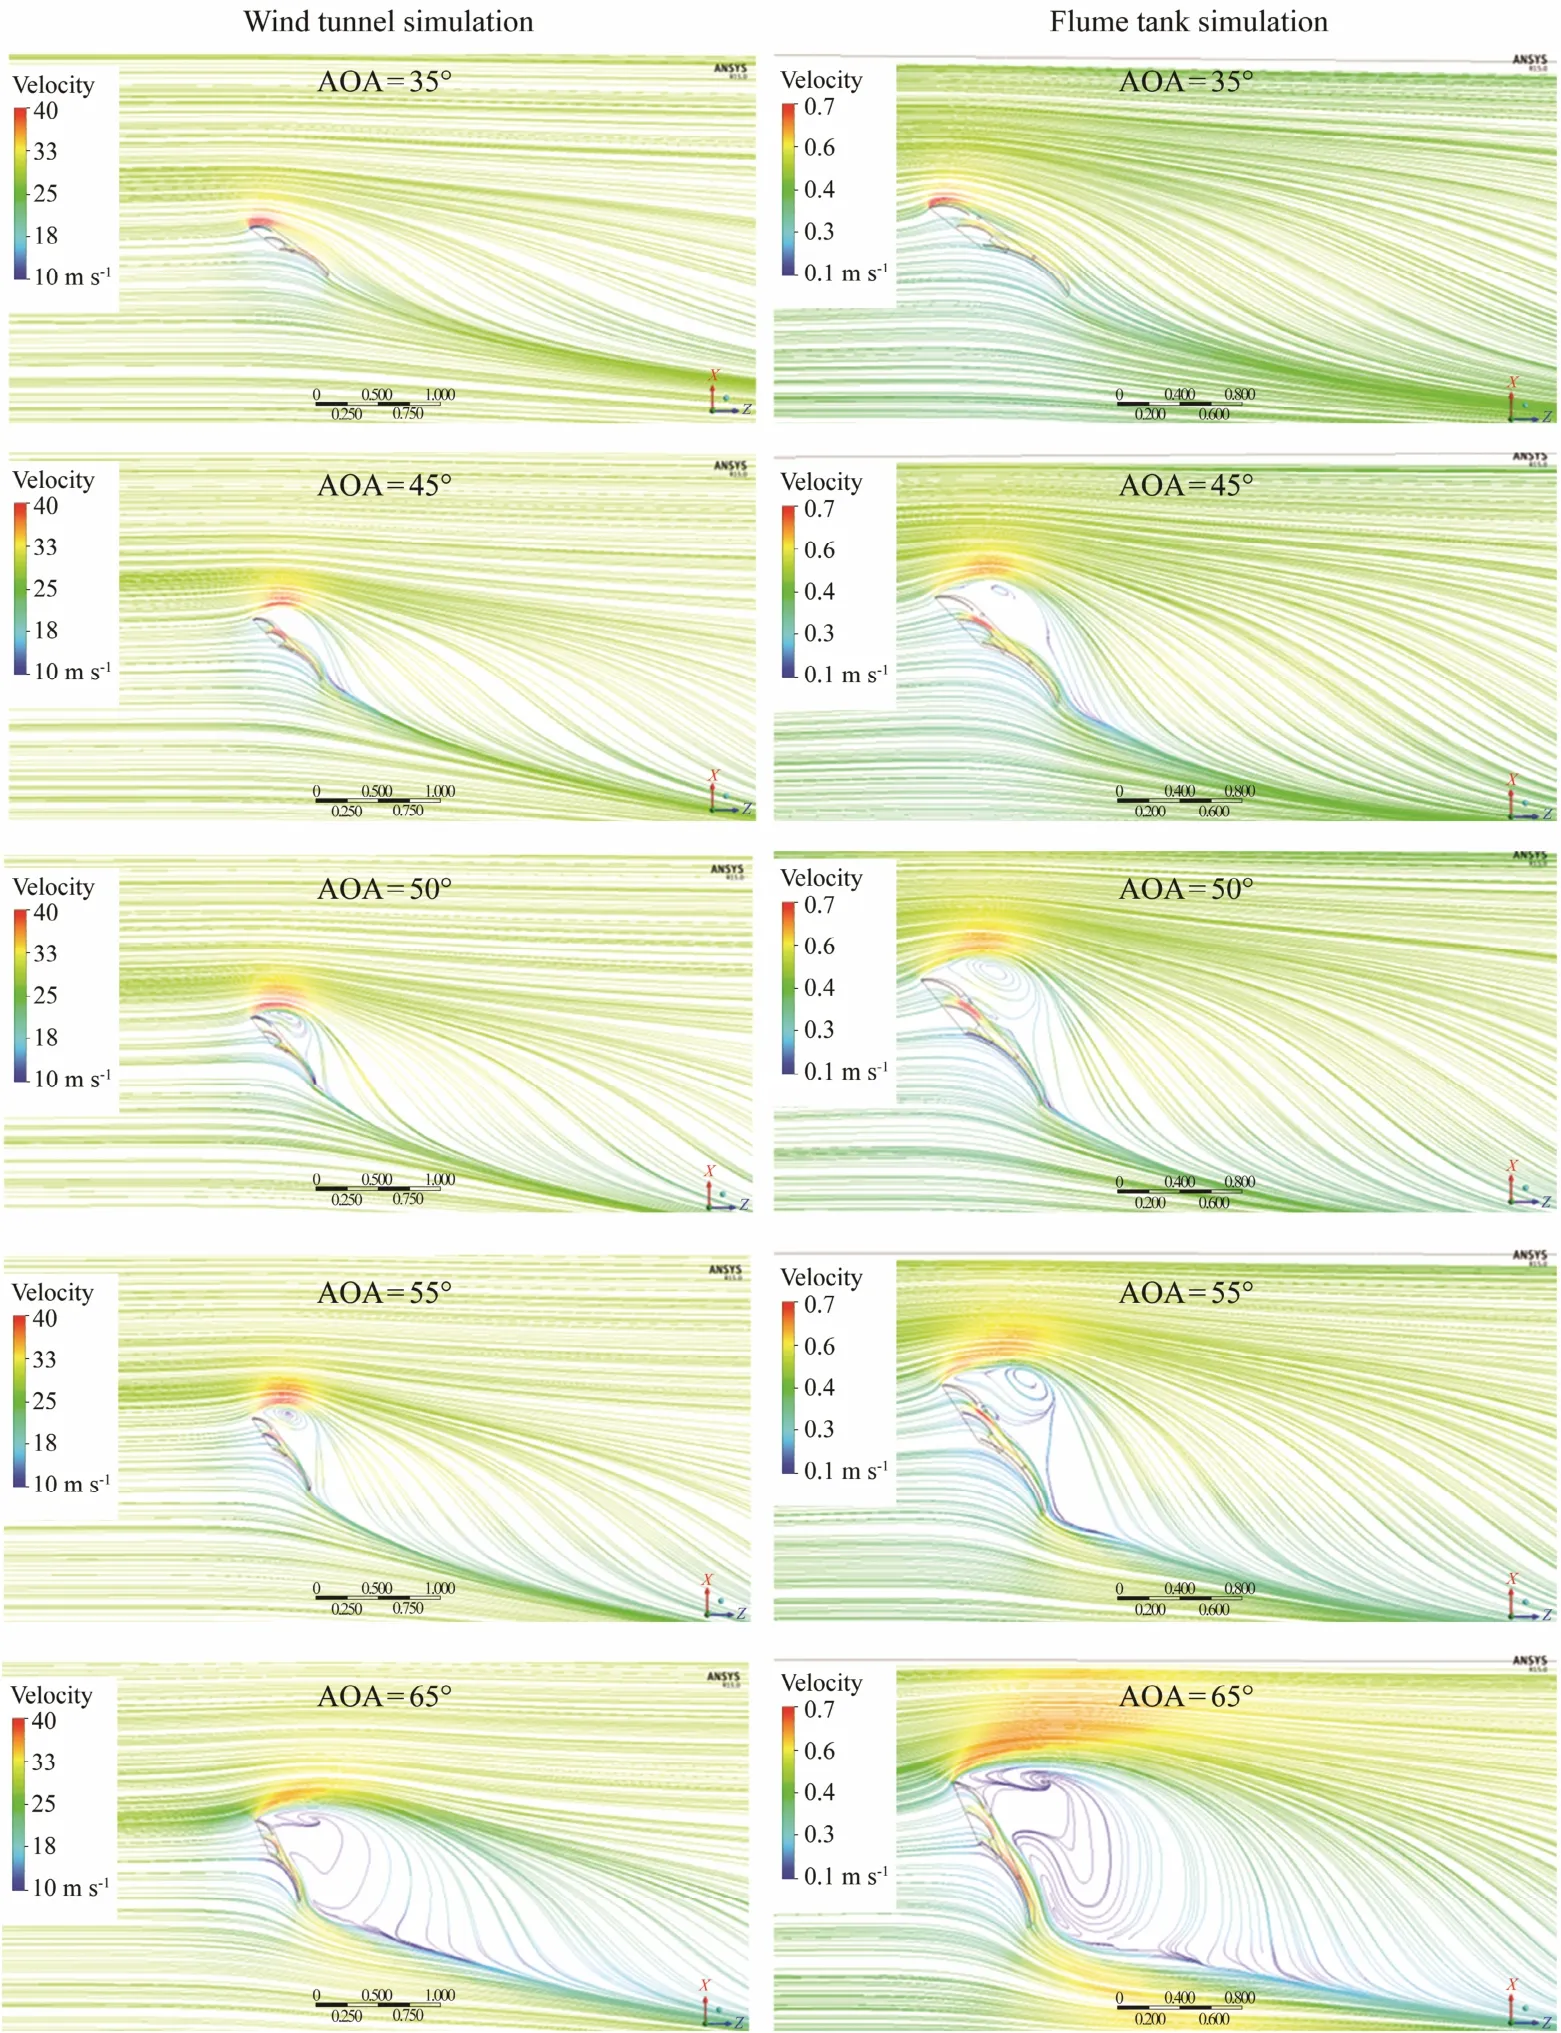
Fig.6 Streamlines from a horizontal plane cutting through the center section of the otter board.
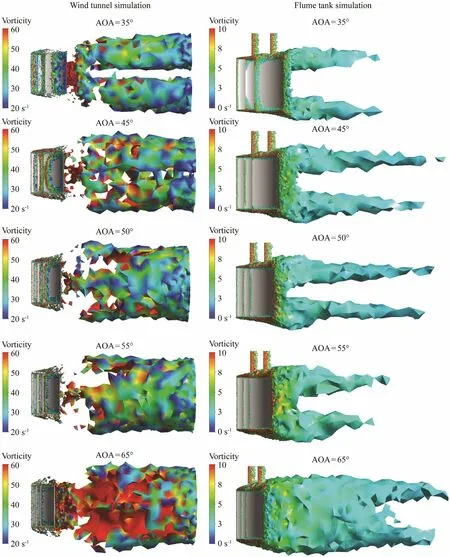
Fig.7 The vorticity diagrams of the otter board.
Flume tank/wind tunnel simulation results agreed well with that of its corresponding experiment, which illustrated that the numerical model can be used to study the hydrodynamic performance of the otter board. However,the results had a big difference between flume tank and wind tunnel experiments. In other words, the drag coefficients in flume experiments were much higher than that in wind tunnel experiments; as a result, the lift-to-drag ratio of flume tank experiment was lower than that of wind tunnel experiment. The measured maximum drag coefficient was 2.656 in flume tank experiment while it was 1.343 in wind tunnel experiment. This phenomenon was also appeared in the flume tank experiment (Li et al.,2013) and wind tunnel experiment (Feng et al., 2001) of a V type otter board. Through the contrast analysis of the results of numerical simulation, the vorticity diagram(Fig.7) in the wind tunnel simulation showed that the wing-tip vortex (Park et al., 1993) began to combine at 45? AOA, during which the dissipation of energy was generated (Yang et al., 2015). As a consequence, the vortex strength as well as the lift-induced drag (Oertel, 2010)was decreased. Therefore, the total drag of the otter board was also decreased. As shown in Fig.3, the drag coefficient in wind tunnel experiment increased slowly when AOA exceeded 45 degree because of the combining wingtip vortex. While for flume tank experiment, the phenomenon of combining vortex did not appear, the vortex strength and lift-induced drag did not decrease. As a result, the drag coefficient remained the same increasing trend as shown in Fig.3, which resulted in the great difference in drag coefficient between flume tank experiment and wind tunnel experiment at a large AOA.
As described above, we believed that it is the fluid medium that leads to the difference in drag coefficient between flume tank experiment and wind tunnel experiment,and the physical differences (particularly the density and viscosity) between water and air can cause great influence on the experiment results. To maintain the reasonable Reynolds numbers, the wind tunnel experiments have to be carried out at a high speed, however, the otter boards were operated at a low towing speed during fishing operation, and this may also make a difference to the experiment results. As the otter boards are operated in water,we should ensure the same fluid medium as the actual situation when researching its hydrodynamic performance.Hence, it is suggested that the flume tank experiment and numerical simulation should be applied to study the hydrodynamic performance of the otter board.
Acknowledgements
The present work was supported by the National Key Technology R&D Program (No. 2013BAD13B03), the Key R&D Project from Science and Technology Department of Zhejiang Province (Nos. 2018C02026, 2018C 02040), the National Natural Science Foundation of China(No. 31072246) and the Fundamental Research Funds for the Central Universities (No. 201564020).
 Journal of Ocean University of China2018年5期
- Journal of Ocean University of China的其它文章
- Effect of Different Dietary Protein and Lipid Levels on the Growth, Body Composition, and Intestinal Digestive Enzyme Activities of Juvenile Yellow Drum Nibea albiflora (Richardson)
- Establishing Gene Delivery Systems Based on Small-Sized Chitosan Nanoparticles
- Methylation Status of the Follistatin Gene at Different Development Stages of Japanese Flounder(Paralichthys olivaceus)
- Taxonomic Clarification of A Well-Known Pathogenic Scuticociliate, Miamiensis avidus Thompson &Moewus, 1964 (Ciliophora, Scuticociliatia)
- Structural Variation Analysis of Mutated Nannochloropsis oceanica Caused by Zeocin Through Genome Re-Sequencing
- Characterization of Polysaccharides Extracted from a Cultivated Brown Alga Costaria costata During the Harvest Period