Enrichment and immobilization of macromolecular analytes on a porous membrane utilizing permeation drag
Pedram Madadkar,Rahul Sadavarte,Raja Ghosh
Department of Chemical Engineering,McMaster University,1280 Main Street West,Hamilton,Ontario,Canada L8S 4L7
1.Introduction
Attachment of biological macromolecules on diverse surfaces has direct implications on development of detection and analytical methods with application in bio-sensors and medical diagnosis[1,2].Location-specific immobilization of analytes by chemical bond formation[3,4],or physical methods such as adsorption[5,6],is typically carried out as the first step in many analytical techniques such as immunoassays[7,8],surface plasmon resonance analysis[9],and Raman spectroscopy[10].Once the molecules are immobilized at their desired locations,they are probed and analyzed using appropriate detection methods.
Permeation drag refers to the drag force exerted on solute molecules and particles towards the surface of a membrane by bulk medium during membrane filtration processes such as ultra filtration and micro filtration[11–14].Our proposition is that such permeation drag induced accumulation of macromolecules near the membrane surface of retaining ultra filtration membranes could be utilized as an alternative physical approach for immobilizing macromolecular analytes.While various other techniques have been carried out to immobilize bio-macromolecules onto membranes[15,16],we demonstrate the feasibility of macromolecule immobilization by permeation drag.Ultra filtration experiments were carried out using fluorescein isothiocyanate(FITC)labeled macromolecules.Location-specific immobilization was demonstrated by direct visual observation and fluorescent imaging.Film theory was used to explicate the permeation drag induced enrichment based on which the accumulation of retained macromolecules takes place within a stagnant film adjacent to the membrane surface.More or less corresponding to the hydrodynamic boundary layer,this is widely referred to as concentration polarization layer in membrane filtration processes.A large number of macromolecules are accumulated in a narrow region with two levels of concentration asymmetry∶The concentration of the solutes is significantly higher in the polarized layer compared to the bulk solution;also,within the layer,the macromolecule concentration increases in an exponential manner from the bulk concentration(Cb)to the concentration at the membrane surface(Cw)[17].If macromolecules are totally retained by a membrane,the two concentration terms are linked by the equation shown below∶

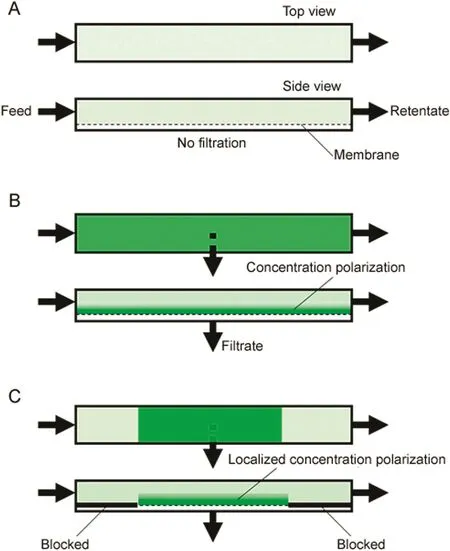
Fig.1.Simpli fied top-and side-view representation of localized permeation drag induced immobilization taking place within a membrane module(A∶no filtration;B∶enrichment on entire membrane;C∶localized enrichment).
In this equation,Q represents the flow rate through the membrane having the area of A,δrepresents the thickness of the concentration polarization layer,and D is the diffusivity of the solute.As a result,when Q>0,Cwwill be greater than Cb,and in a typical ultra filtration experiment,Cwcould be larger by more than two orders of magnitude[13,18].Clearly,concentration polarization caused by permeation drag could be utilized for quite significant enrichment of macromolecules on the surface of a membrane.Such enrichment would also be dynamic in nature,i.e.the accumulated layer of macromolecules would largely disappear if the filtration process is stopped.Eq.(1)suggests that the extent of such enrichment could be manipulated by adjusting the values of Q,δ,and D.While Q could be controlled by adjusting the transmembrane pressure,the value of δdepends on the flow behaviour adjacent to the membrane and D depends on the size of the macromolecule.
Fig.1 shows a dilute solution of an FITC-labeled macromolecule flowing through a channel having an ultra filtration membrane on one side.In the absence of permeation drag,i.e.when filtration rate is zero,concentration polarization does not occur(Fig.1A).If filtrate was drawn through the membrane either using positive pressure or suction,the enriched layer of macromolecules adjacent to the membrane would be evident from the enhanced fluorescence intensity(Fig.1B).Further,if a part of the membrane was blocked,concentration polarization would occur in a localized manner only in the non-blocked part(Fig.1C).The enhanced fluorescence due to enrichment of macromolecules would now be easier to observe due to the contrast between regions with and without polarization.Based on Eq.(1),it may be predicted that higher enrichment would occur at higher filtration rates,and larger macromolecules and macromolecular complexes(which have lower diffusivity)would be easier to enrich.Accordingly,specific regions of rectangular flat sheet ultra filtration membranes were blocked by applying polyurethane glue.Fluorescent patterns and features were generated on these membranes by localized concentration polarization of FITC-labeled dextran.The effect of filtration rate and molecular weight of macromolecules on intensity of fluorescence was examined.
The interactions between antigens and corresponding antibody molecules lead to the formation of macromolecular complexes called immunocomplexes,the ability to recognize which is widely exploited to carry outimmunoassays [19,20].Such immunocomplexes would be fairly easy to enrich as they are larger in size.The working principle of the localized concentration polarization based immunocomplex detection method is outlined in Fig.2,which shows the polarization of a fluorescence-labeled antigen(Fig.2A),the polarization of a mixture of the antigen and non-specific antibody(Fig.2B),and the polarization of the immunocomplex(Fig.2C).As indicated in the figure,the highest intensity could be expected in(Fig.2C).The difference in intensity could therefore be utilized for immunocomplex detection.Proofof-concept of such immunocomplex detection was obtained by using FITC-labeled bovine serum albumin(FITC-BSA)as model antigen and rabbit anti-BSA as corresponding antibody.The Effect of filtration rate,antigen concentration and antibody concentration on intensity was examined.
2.Experimental
2.1.Materials
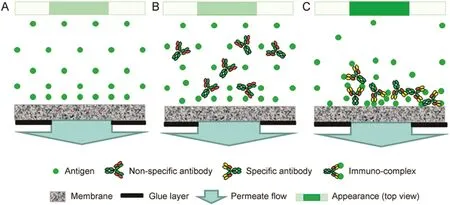
Fig.2.Schematic diagram for immunocomplex detection by localized permeation drag induced immobilization explaining the basis for difference in fluorescent intensity(A∶antigen only;B∶antigen with non-specific antibody;C∶antigen with specific antibody).
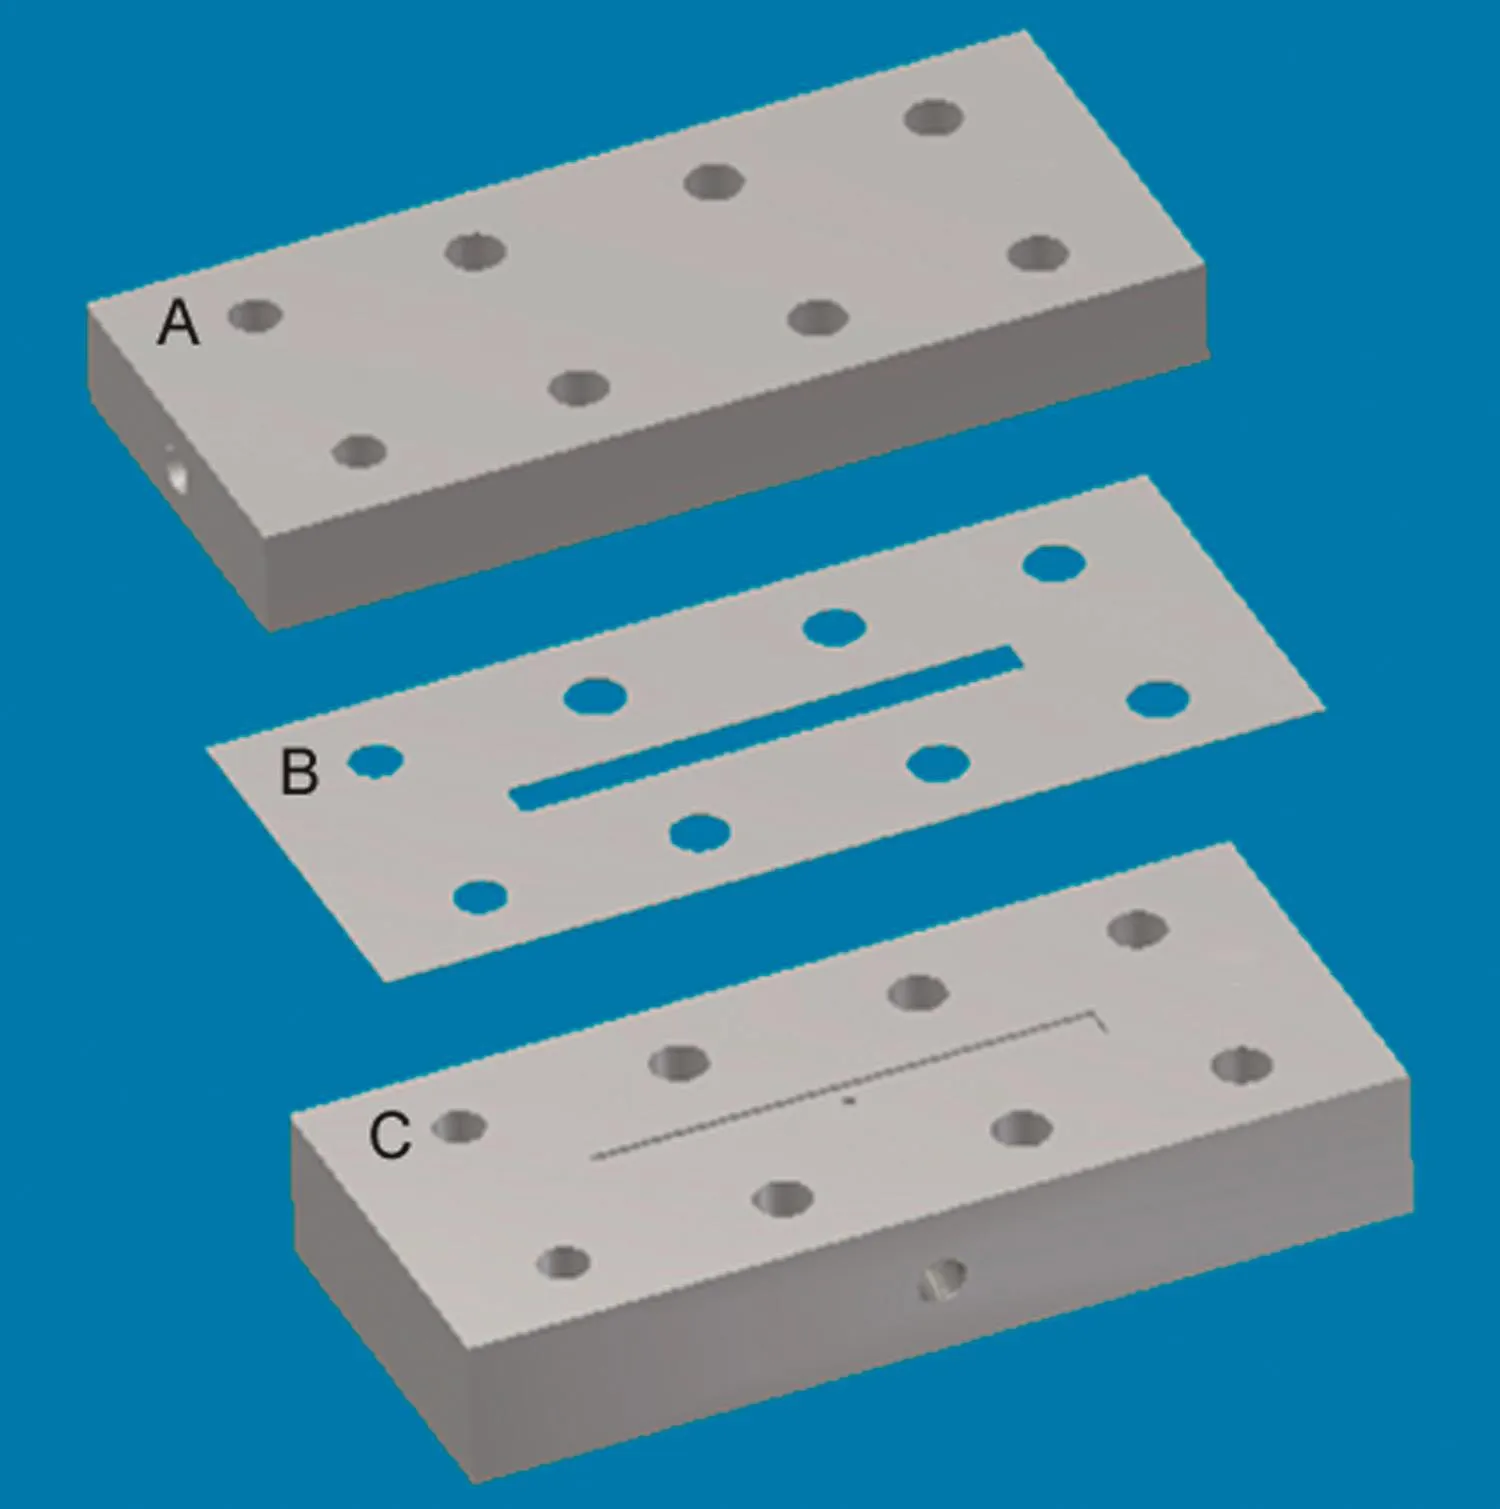
Fig.3.Membrane module used for carrying out localized permeation drag induced immobilization experiments(A∶top plate;B∶spacer;C∶bottom plate).
FITC-dextran of different molecular weights(40 kDa,FD40S;70kDa,FD70S;500kDa,46947;and 2000 kDa,FD2000S),FITCBSA(A9771),anti-BSA(B1520),and whole antiserum polyclonal antibody raised in rabbit were purchased from Sigma-Aldrich Canada Ltd,Oakville,ON,Canada.Normal rabbit serum(PLN 5001)was purchased from Invitrogen(Life Technologies Inc.),Burlington,ON,Canada.Polyethersulfone ultra filtration membranes(OMEGA 10K,10kDa MWCO;OMEGA 30 K,30 kDa MWCO)were purchased from Pall Life Sciences,Ann Arbor,MI,USA.Elmer's Ultimate Glue(polyurethaneglue)waspurchased from Elmer's Products Canada Corporation,Toronto,ON,Canada.High quality water(18.2 MΩcm)was obtained from a Barnstead DiamondTM.
NANOpure water purification unit(Dubuque,IA,USA)was used to prepare feed solutions used in the ultra filtration experiments.
2.2.Methods
Rectangular strips(74 mm×12 mm)were cut out from the ultra filtration membrane sheet.Specific regions of these were blocked by applying polyurethane glue on the filtrate side using a paint brush followed by curing at room temperature for 24h.The membrane strips were housed within a tangential flow module(Fig.3)which consisted of a membrane spacer(made from 0.2 mm thickness Teflon?sheet)placed between a Delrin?bottom plate and a transparent acrylic top plate.The rectangular slot within spacer served as the cross- flow channel(40 mm×3 mm ×0.2 mm).The bottom plate was provided with a slot corresponding to the cross- flow channel within the spacer.This slot was fitted with a wire-mesh, flush with the top surface of the bottom plate.

Fig.4.Experimental set-up used for carrying out localized permeation drag induced immobilization experiments.
The experimental set-up is shown in Fig.4.The membrane module was placed inside a cardboard box,painted black on the inside to minimize reflection of light,and having dimensions of 20 cm ×15 cm × 5cm.A Model ENF-260°C UV lamp(Spectronic Corporation,Westbury,NY,USA)was attached with its window directly above the membrane module to illuminate the membrane surface with short wavelength ultraviolet light(254 nm).A digital camera(Sony Cyber-shot,Model DSC-WX7,Japan)was fixed within a slot in the box and was used to obtain photographs and video clips of the membrane surface during the experiments.
In the FITC-dextran experiments,the feed solutions were prepared by dissolving the appropriate FITC-dextran in water.All solutions used in the immunocomplex detection experiments were prepared in phosphate buffered saline(PBS,pH 7.4).The PBS buffer contained sodium chloride,potassium chloride,disodium hydrogen phosphate,and potassium dihydrogen phosphate with the concentrations of 8.0,0.2,1.42,and 0.2 g/L,respectively.Water or buffer was pumped from a reservoir to the membrane module using an MCP model C.P.78002-00 peristaltic pump(Ismatec,Switzerland)while the filtrate was generated by suction using a HiLoad P-50 pump(GE Healthcare,Piscataway,NJ,USA).Sample loops having different volumes were used to inject the feed solutions into the membrane module.
Video clips were recorded in the MTS format and the extent of zooming was kept the same in all experiments.Snapshots were obtained from the video files using Windows Live Movie Maker and processed for fluorescent intensity analysis using Image J.The polarized membrane area within the spacer was selected and its average intensity was measured using Image J as“mean gray scale intensity”value.To avoid any experiment-to-experiment variation,the intensity was normalized by subtracting the base line intensity in each case,this being the intensity of the membrane before any fluorescent sample entered the module.
3.Results and discussion
Permeation drag induced enrichment and immobilization experiments were first carried out using an ultra filtration membrane strip (10kDa MWCO) with three parallel rectangular(3.5 mm×1 mm)non-blocked areas(shaded in light grey in Fig.5).The feed solution which consisted of 0.2 mg/mL 40 kDa FITC-dextran in water was injected into the membrane module at a flow rate of 0.3 mL/min using a 5 mL sample loop.In the absence of permeation drag,the intensity of green fluorescence on the membrane was more or less uniformly faint(Fig.5A).The filtrate pump was switched on and the combined filtration rate through the three unblocked areas was maintained at 0.15 mL/min.The enhanced green fluorescence at the three unblocked locations was clearly distinguishable from the rest of the membrane(Fig.5B).The filtration rate was increased to 0.25 mL/min and this resulted in a significant increase in the fluorescence intensity at these regions(Fig.5C).These results are consistent with Eq.(1),which predicts that more macromolecules would accumulate near the membrane surface at higher filtration rates.The filtrate pump was then switched off and in less than 30 s,the fluorescent patterns completely disappeared and the non-blocked regions were no longer distinguishable from the rest of the membrane,clearly indicating that fouling was negligible.Similar experiments were carried out at cross- flow rates of 0.4 and 0.5 mL/min(data not shown).The fluorescence obtained at 0.4 mL/min was significantly fainter than that obtained at 0.3 mL/min while at 0.5 mL/min,the enrichment could not be observed.
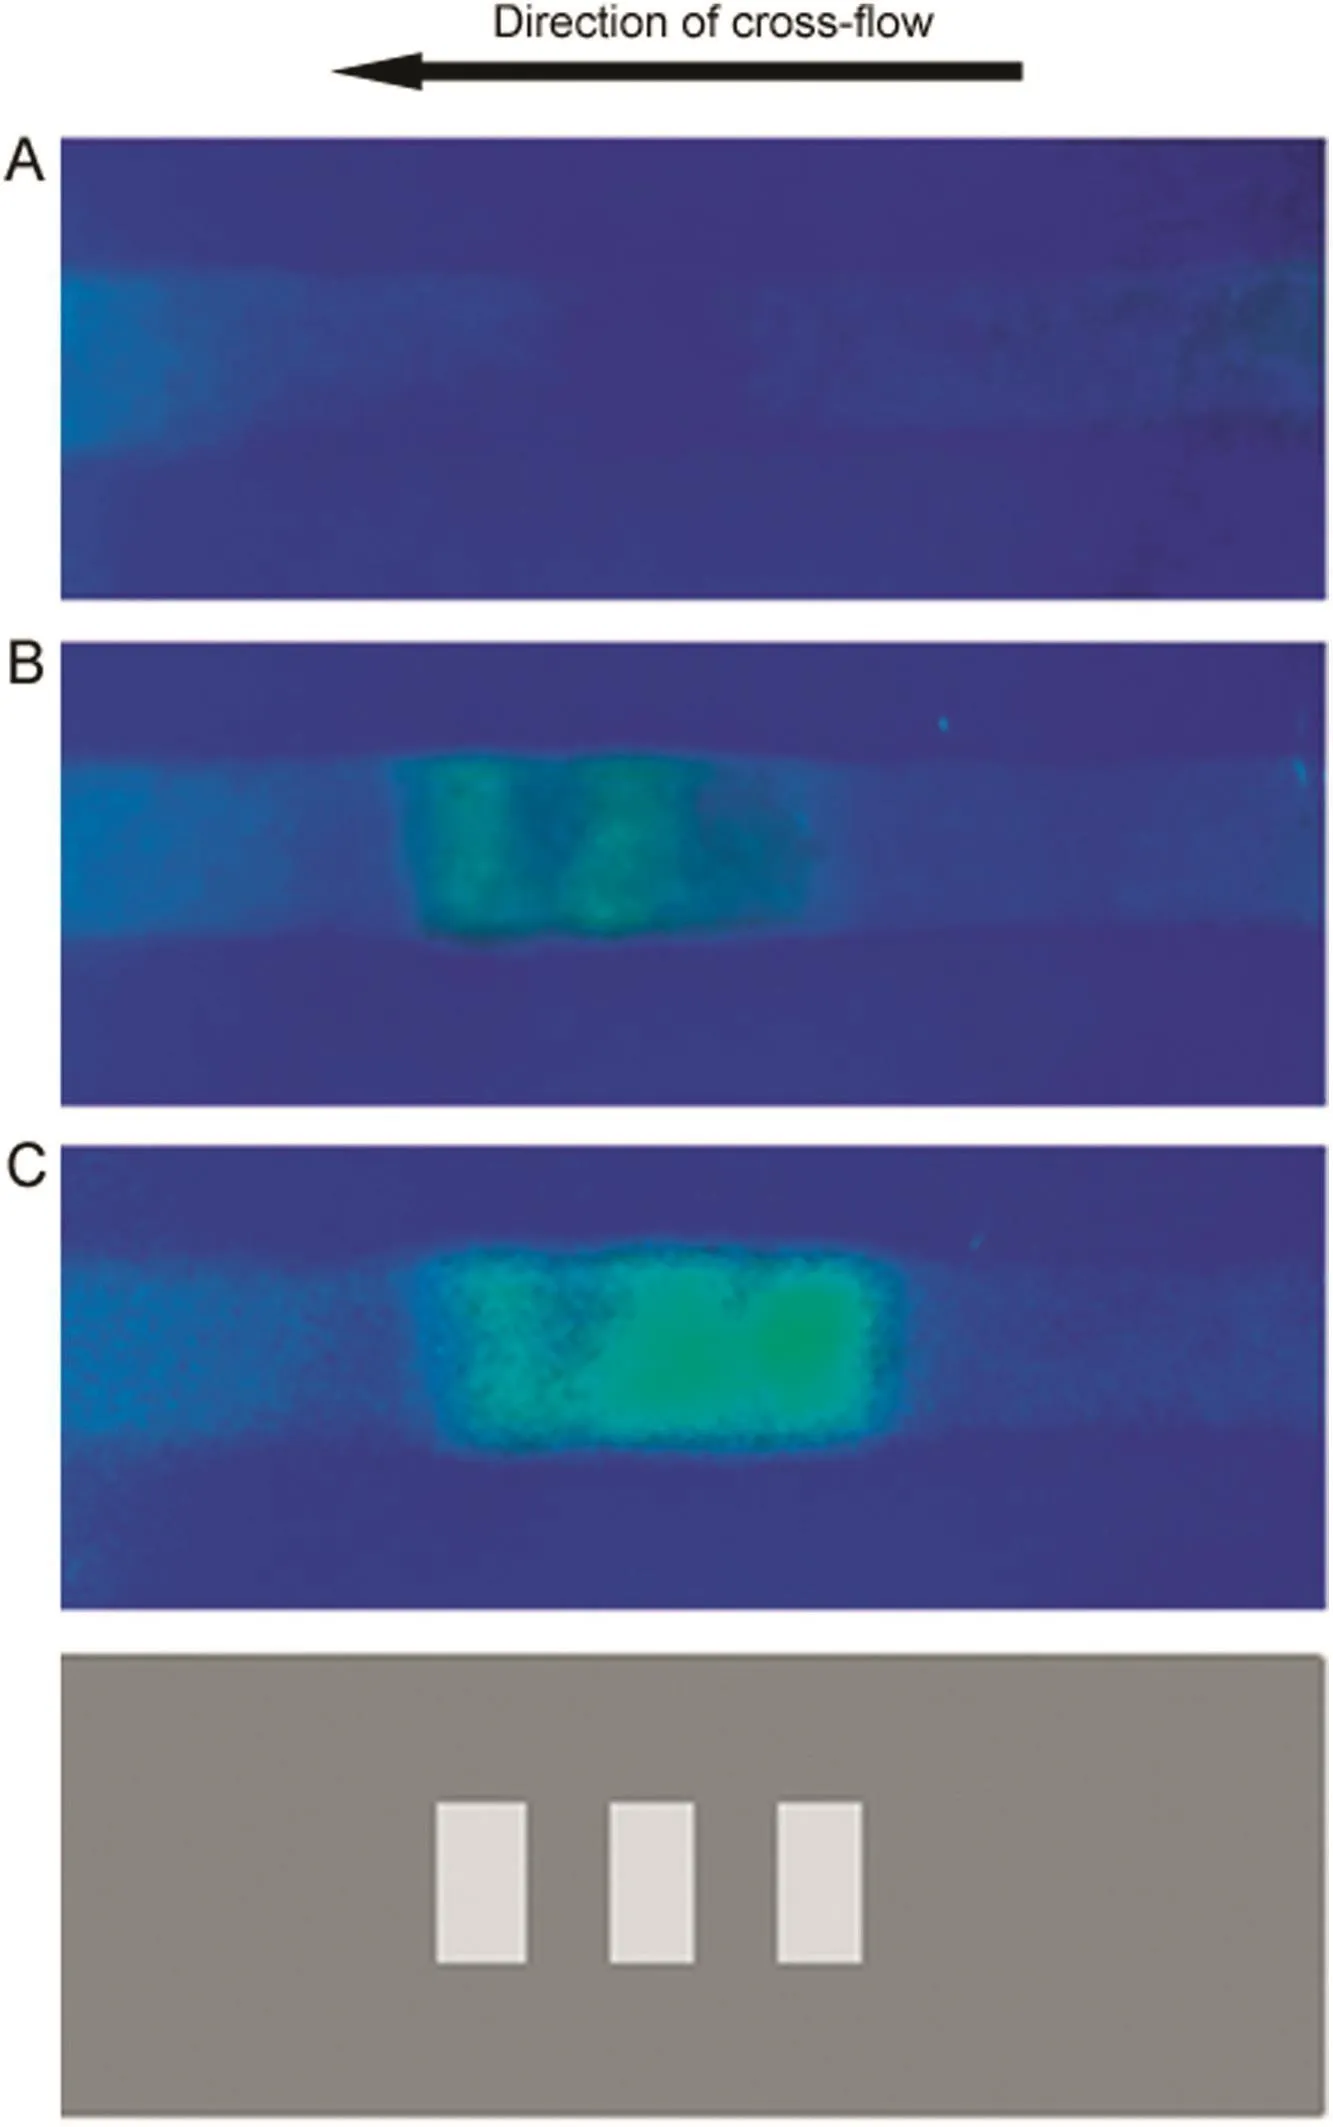
Fig.5.Localized permeation drag induced immobilization of FITC-dextran(molecular weight∶40 kDa;feed concentration∶0.2 mg/mL;cross- flow rate∶0.3 mL/min;loop size∶5 mL;A∶no filtration;B∶0.15 mL/min filtration rate;C∶0.25 mL/min filtration rate).
The kinetics of the accumulation and dissipation of fluorescentlabeled analytes was studied using an ultra filtration membrane strip similar to that used in the experiments discussed above.FITC-dextran solution(40kDa,0.2mg/mL)was injected into the membrane module at a flow rate of 0.3mL/min using a 5mL sample loop.The filtrate pump was switched on and maintained at a rate of 0.2mL/min.Fig.6 shows the images obtained at different times during the accumulation of the dextran molecules through the formation of localized concentration polarization layer(frames 1–7).After about 8s from start of filtration(frame 3),the three parallel bars corresponding to the non-blocked regions of the membrane could just about be distinguished.With time,the intensity increased until in about a minute(frame 7)and a steady state was reached.When the localized enrichment had fully developed,the filtrate pump was switched off to observe its dissipation.Frames 8–14 were obtained at different time during this phase of the experiment.The rate of dissipation of the immobilized analytes was significantly faster than its rate of accumulation.In a matter of 10s or so(frame 14),the fluorescent features almost completely disappeared,from right to left,i.e.in the direction of cross- flow.During the dissipation phase,FITC-dextran released was clearly visible in the form of a fluorescent streak close to the outlet.
Fig.7 shows the immobilization obtained with three different types of FITC-dextran(70 kDa,500 kDa and 2000 kDa).The ultrafiltration membrane used in these experiments was of 30 kDa MWCO and the non-blocked area of the membrane had a dimension of 3 mm×3 mm(shaded in light grey).
These experiments were carried out at a cross- flow rate of 0.21 mL/min and a filtration rate of 0.12 mL/min.The FITC-dextran feed solution(0.2 mg/mL)was injected into the module using a 5 mL sample loop.The lowest and highest intensities were observed with 70kDa and 2000kDa FITC-dextran,respectively.The intensity observed with the 500 kDa FITC-dextran was only slightly higher than that with 70kDa dextran.These results are consistent with Eq.(1),which predicts that permeation drag would be more effective for larger macromolecules.
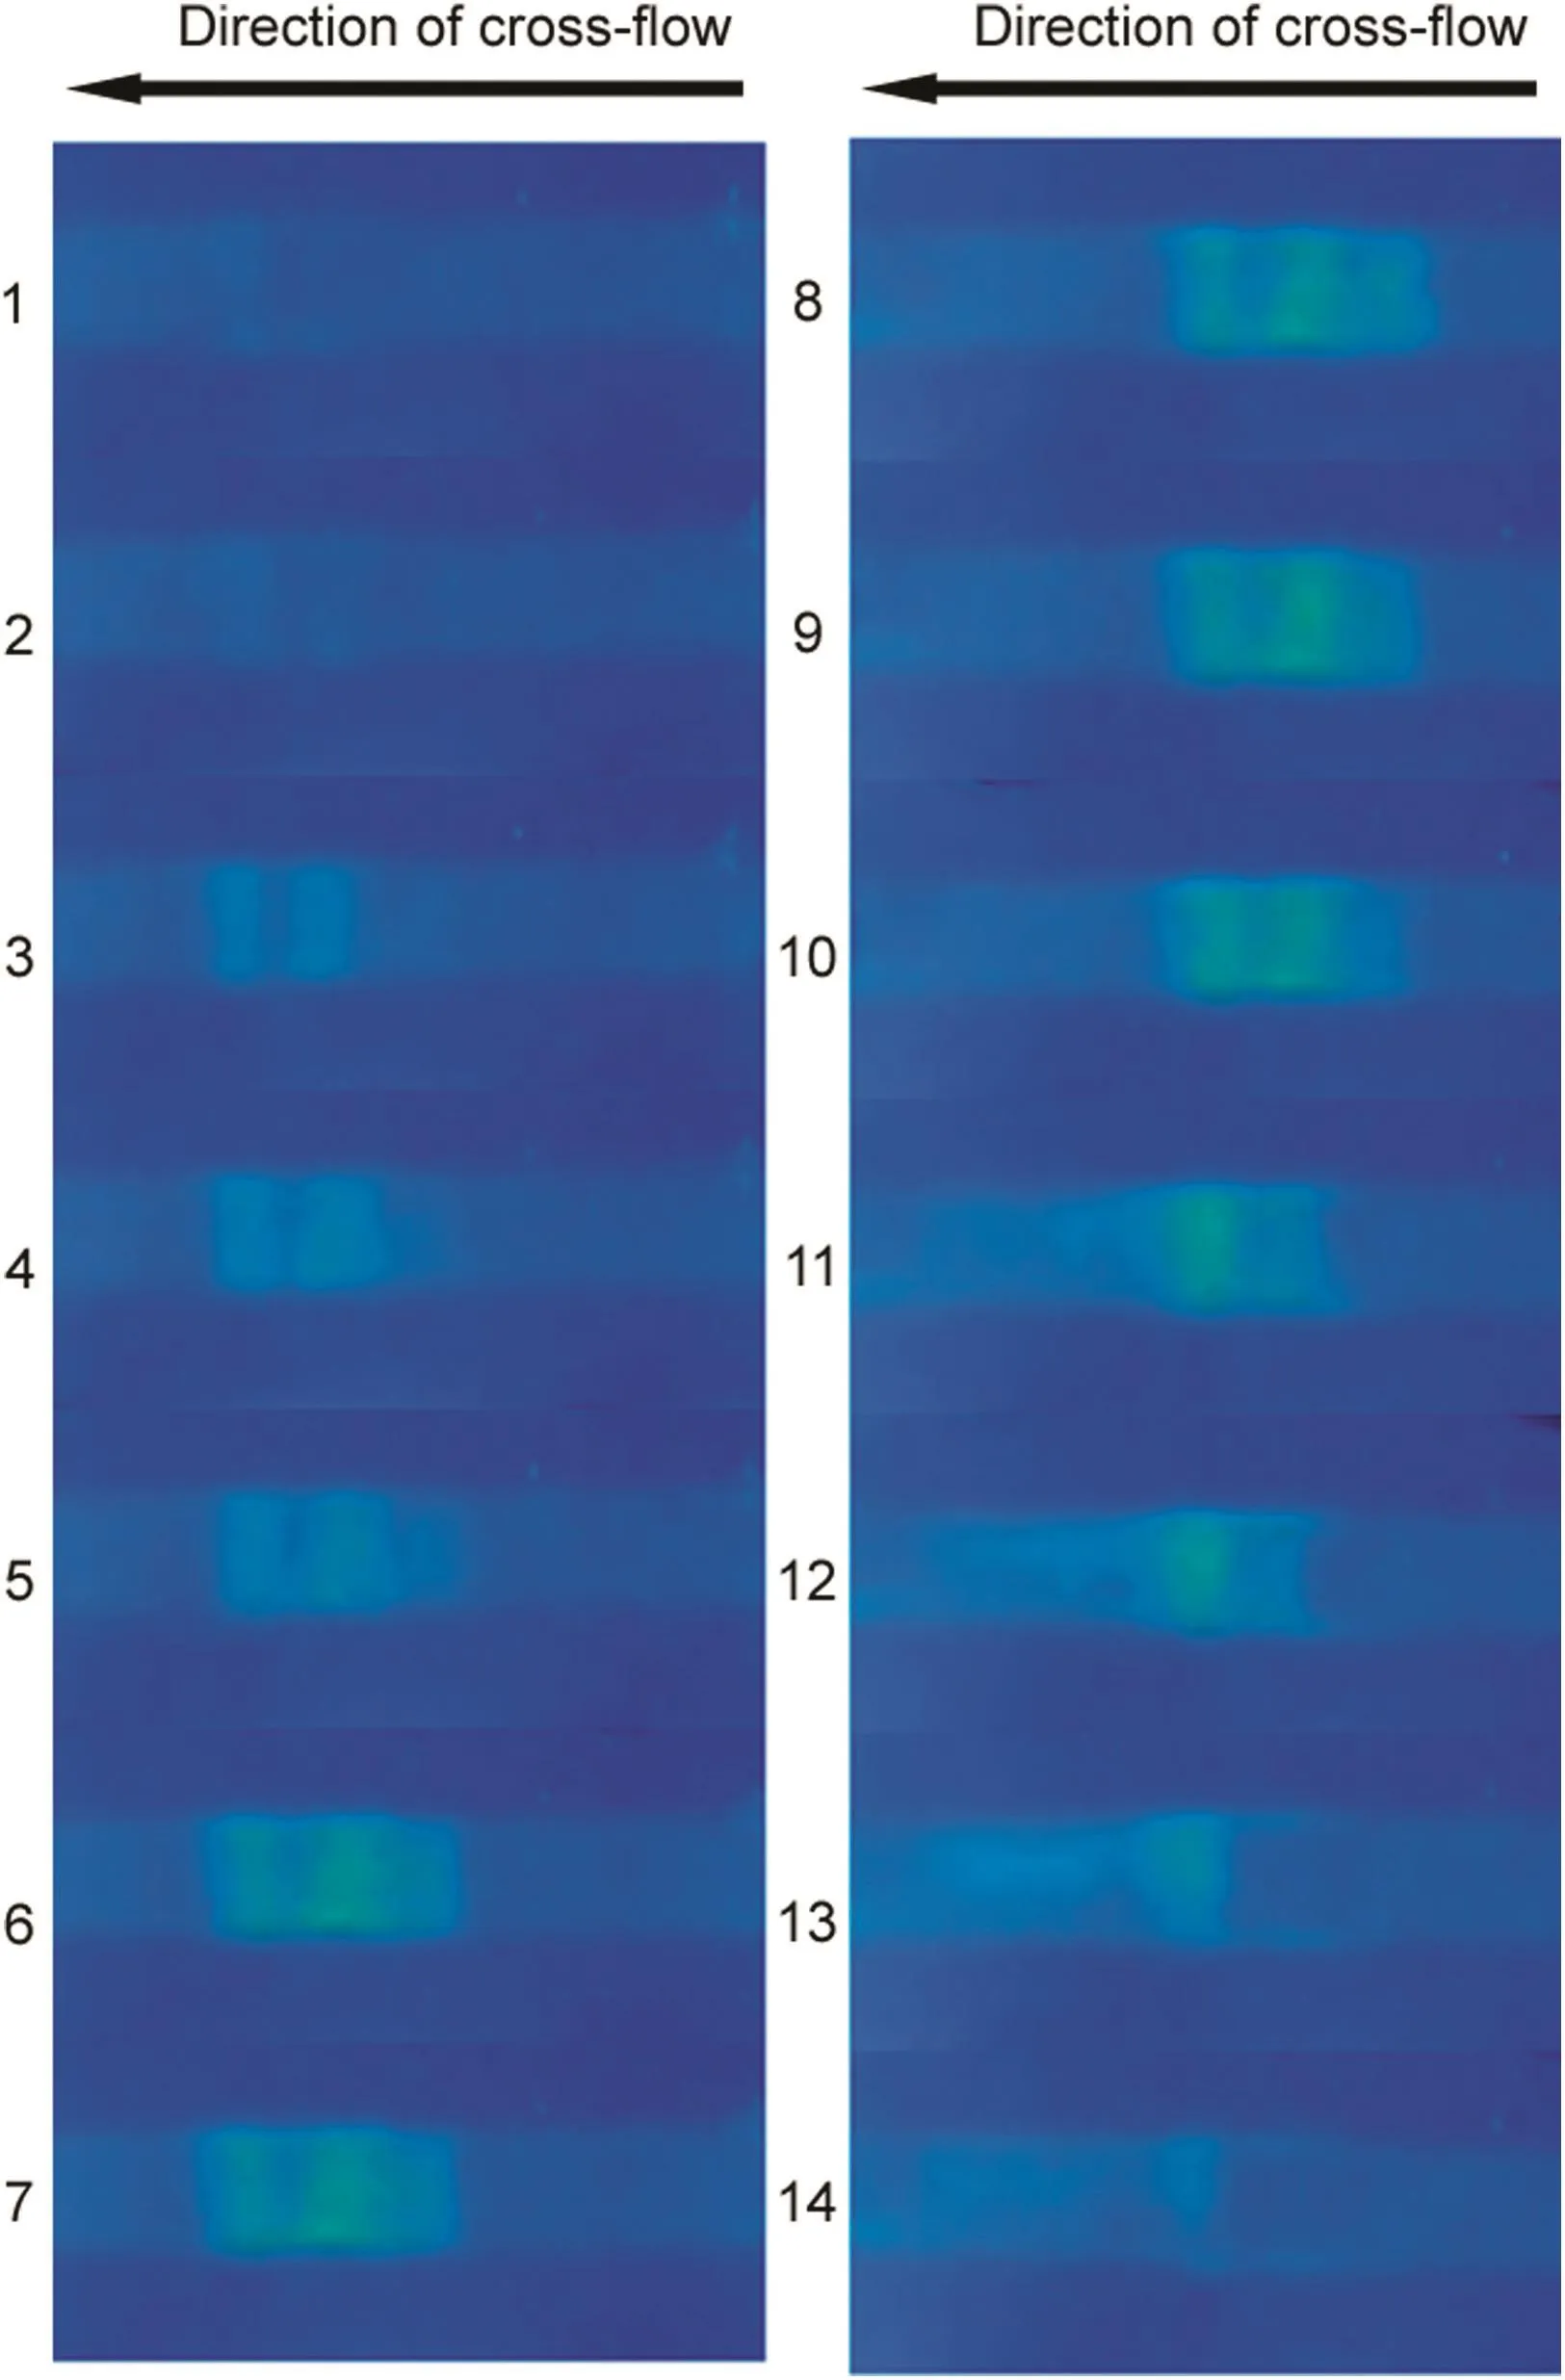
Fig.6.The kinetics of the accumulation(slides 1–7)and dissipation(slides 8–14)of FITC-dextran(molecular weight∶40 kDa;feed concentration∶0.2 mg/mL;crossflow rate∶0.3 mL/min;loop size∶5 mL; filtration rate∶0.2 mL/min).
The immunocomplex detection experiments were carried out using 30 kDa MWCO ultra filtration membranes having a nonblocked area of 40 mm×1mm(as shown in light grey shading in Fig.8).Preliminary experiments showed that an elongated nonblocked area along the length of the cross- flow channel gave better immunocomplex immobilization than the smaller nonblocked areas used in the dextran experiments.Fig.8 shows the results obtained with FITC-BSA(A),FITC-BSA–non-specific antibody mixture(B),FITC-BSA–anti-BSA mixture(C),and FITC-BSA–anti-BSA mixture with no filtration(D).These experiments were carried out at a cross- flow rate of 0.21 mL/min and a filtration rate of 0.14mL/min.Samples were incubated at 37°C for 75 min,equilibrated to room temperature,and a 100 microliter loop was used for injecting these into the membrane module.The FITC-BSA concentration used in these experiments was 0.2 mg/mL while the anti-BSA or non-specific antibody concentration was 0.5 mg/mL.
Although the intensity observed with FITC-BSA(Fig.8A)and the mixture of FITC-BSA and non-specific antibody(Fig.8B)were almost similar,a significantly higher fluorescent intensity was observed with the immunocomplex(Fig.8C).However,in the absence of filtration,virtually no coloration was observed even with the immunocomplex(Fig.8D),clearly highlighting the role of permeation drag in the technique.These results unambiguously demonstrate that the permeation drag induced immobilization could be used for immunocomplex detection.This technique could be developed further into immunoassay methods for detecting specific antigens or antibodies in samples.
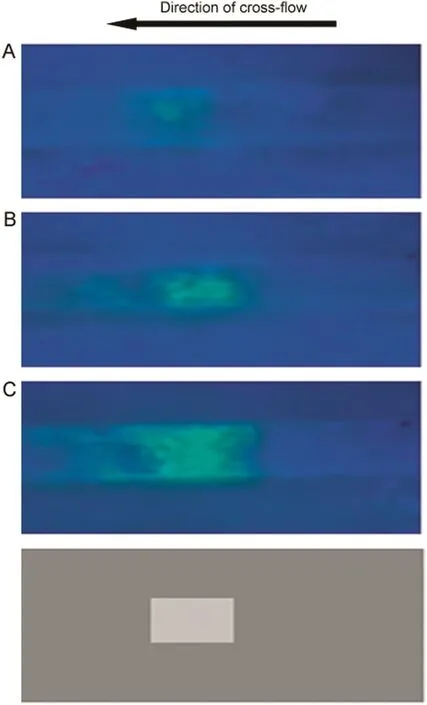
Fig.7.Effect of molecular weight on intensity of permeation drag induced immobilization(cross- flow rate∶0.21 mL/min; filtration rate∶0.12 mL/min;FITC-dextran feed concentration∶0.2 mg/mL;loop size∶5 mL;A∶70kDa;B∶500 kDa;2000 kDa).
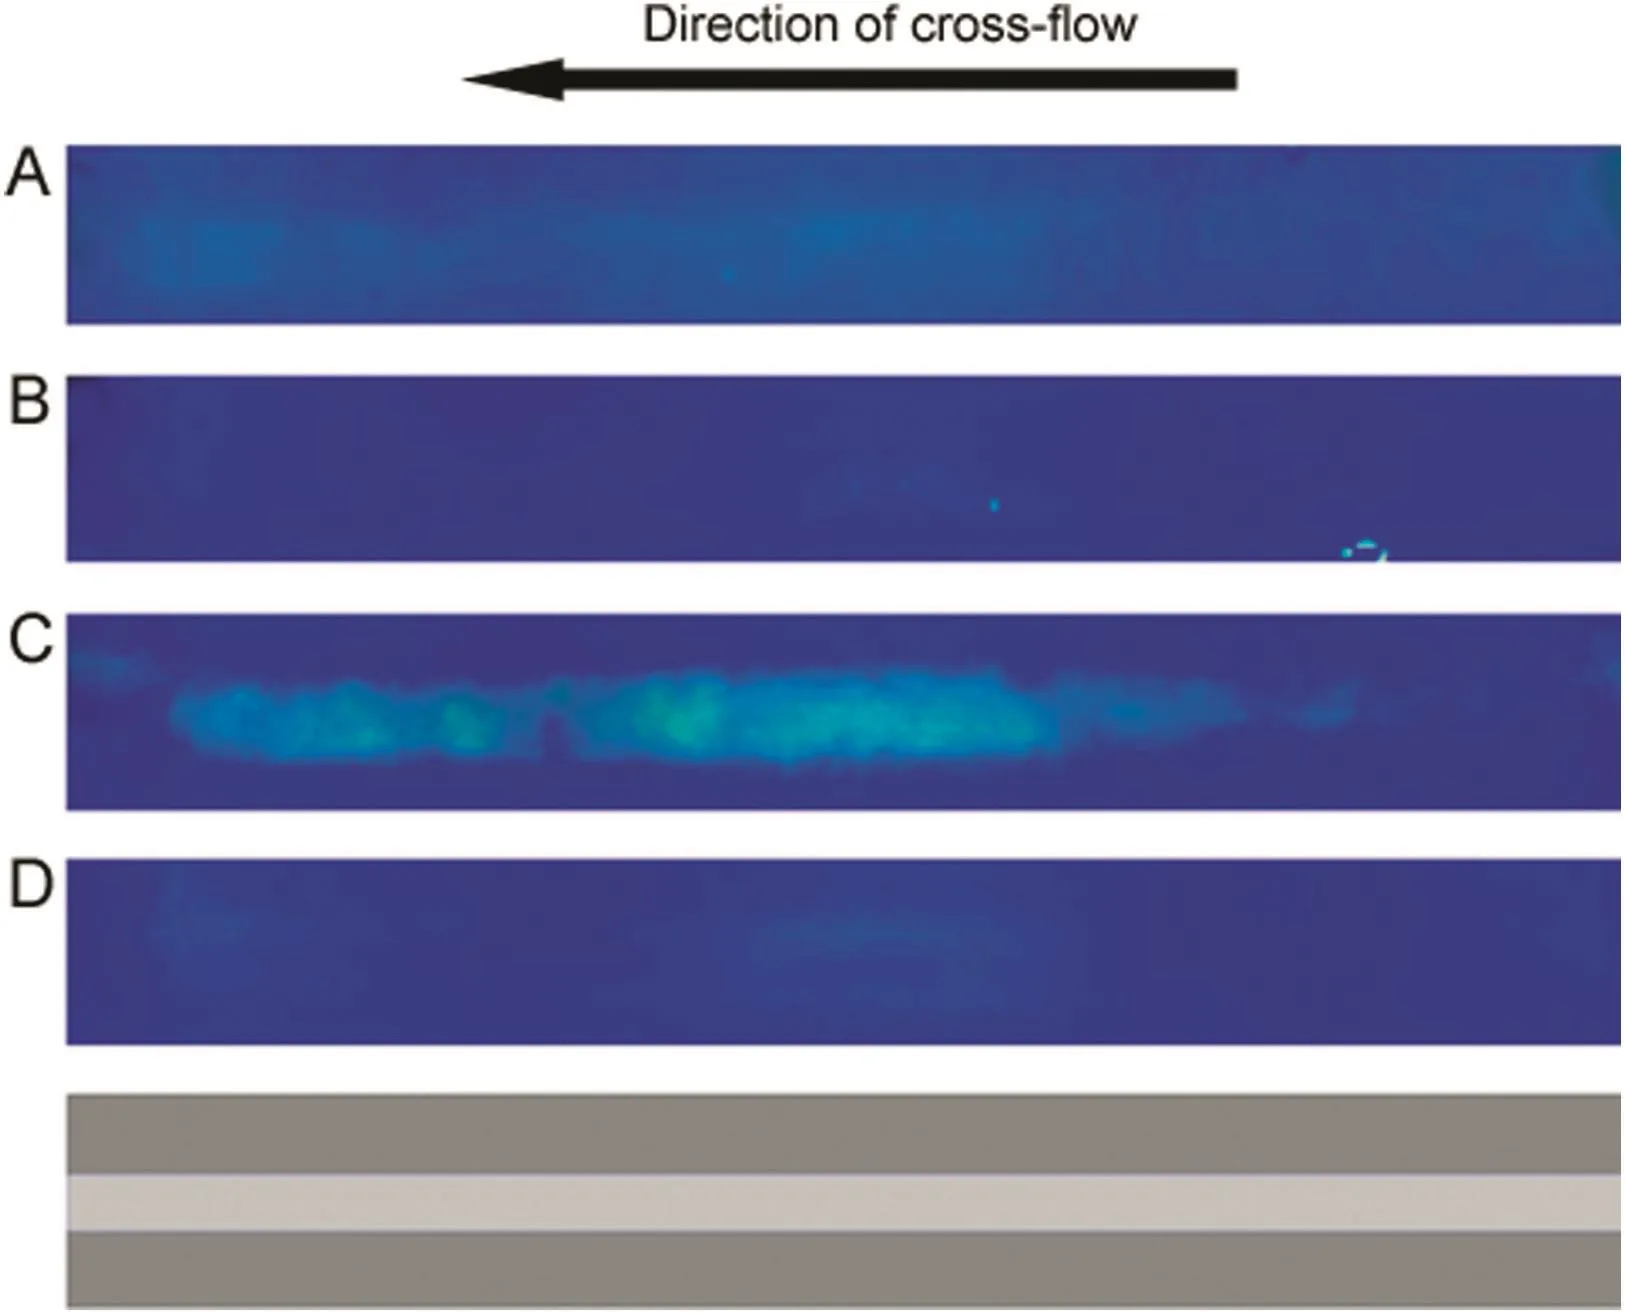
Fig.8.Fluorescence intensity due to permeation drag induced immobilization of immunocomplex(A∶FITC-BSA;B∶FITC-BSA–non-specific antibody mixture;C∶FITC-BSA–anti-BSA mixture;D∶FITC-BSA–anti-BSA mixture without filtration;cross- flow rate∶0.21 mL/min; filtration rate∶0.14 mL/min;sample loop∶100 μL;FITC-BSA concentration∶ 0.2 mg/mL; non-specific antibody concentration∶0.5 mg/mL;anti-BSA concentration∶0.5 mg/mL).
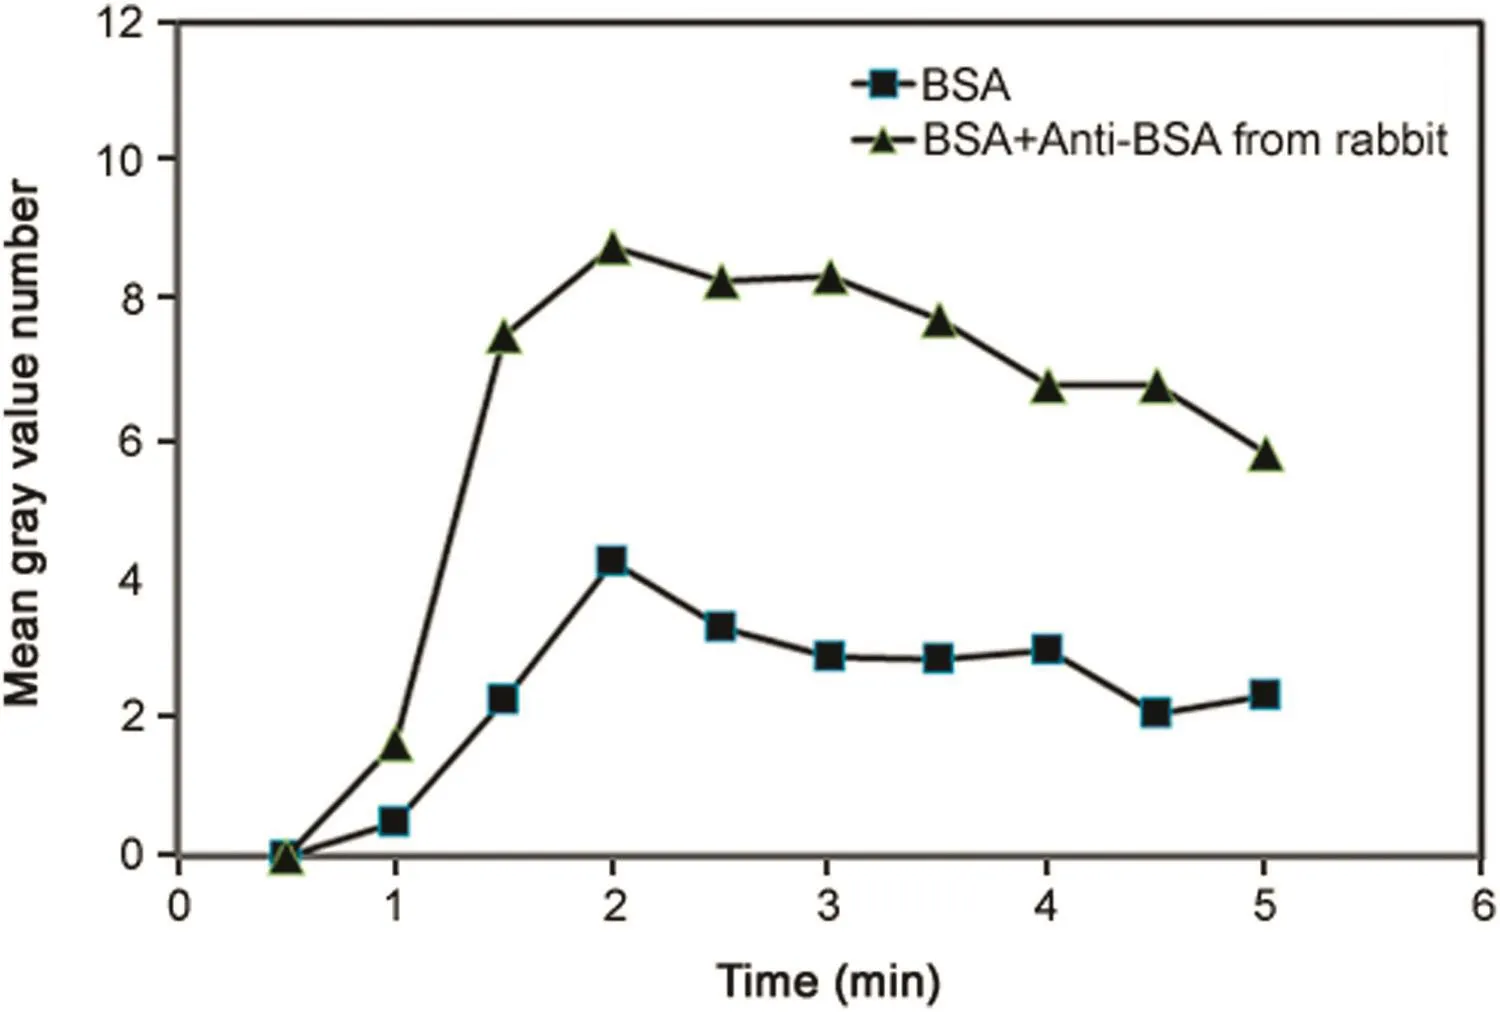
Fig.9.Fluorescence intensity as function of time observed due to permeation drag induced immobilization of immunocomplex(cross- flow rate∶0.21 mL/min; filtration rate∶0.18 mL/min;sample loop∶100 μL;FITC-BSA concentration∶0.2 mg/mL;anti-BSA concentration∶0.5 mg/mL).
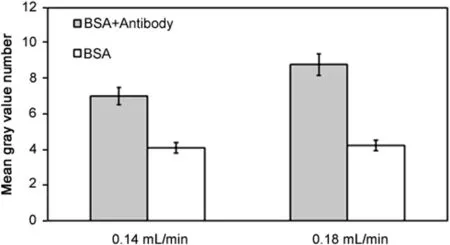
Fig.10.Effect of filtration rate on fluorescence intensity due to permeation drag induced immobilization of immunocomplex(grey∶immunocomplex experiment;white∶control experiment;cross- flow rate∶0.21 mL/min;sample loop∶100 μL;FITC-BSA concentration∶0.2 mg/mL;anti-BSA concentration∶0.5 mg/mL).
Further experiments were carried out to examine the effects of variables such as filtration rate,antibody concentration and antigen concentration on immunocomplex detection.Fig.9 shows the fluorescent signal intensity(expressed in mean grey value)as function oftimeobserved by injecting100 μLofFITC-BSA(0.2 mg/mL)alone,and FITC-BSA–antibody mixture(0.2 mg/mL and 0.5 mg/mL)respectively at a cross- flow rate of 0.21 mL/min and a filtration rate of 0.18 mL/min.The fluorescence was significantly and consistently higher with the antigen-antibody complex than with this antigen alone.These results quite clearly validate the working hypothesis of our proposed immunocomplex detection method.In each of these experiments,the maximum fluorescence was observed around 2 min,after which there was a gradual decay in the fluorescence adjacent to the membrane.The variations and the overall decay observed between 2min and 5min are regarded to the effect of the cross flow and the pump induced pulsations on the polarized layer.All subsequently reported fluorescence data from immunocomplex experiment are based on the readings obtained 2 min after injection as peak signal intensity was observed at this time in all these experiments.When the filtration pump was stopped(data not shown in the figure),the fluorescence totally disappeared,indicating that fouling was negligible.Fig.10 compares the fluorescence data obtained from experiments carried out at a cross flow rate of 0.21mL/min and two different filtration rates of 0.14 and 0.18mL/min,respectively.The amounts of FITC-BSA and FITC-BSA–antibody injected in these experiments were the same as that used in the experiment corresponding to Fig.9.The intensity was found to be significantly higher at the higher filtration rate.This is consistent with the expectations based on Eq.(1)and the experimental results obtained with FITC-dextran immobilization by permeation drag.
Fig.11 shows the results obtained from immunocomplex detection experiments carried out using different antibody concentration.The antigen,i.e.FITC-BSA concentration in these experiments,was kept fixed at 0.2 mg/mL while three different antibody concentrations(0.5,0.75 and 5.0 mg/mL)were examined.The cross flow and filtration rates used in these experiments were 0.21mL/min and 0.14 mL/min,respectively.The figure also shows representative snapshots for each experimental condition as well as control intensity data obtained using FITC-BSA alone.Intensity increased quite significantly when the antibody concentration was increased from 0.5 to 0.75mg/mL.However,the increase in intensity was relatively modest when the antibody concentration was further increased quite significantly to 5mg/mL.
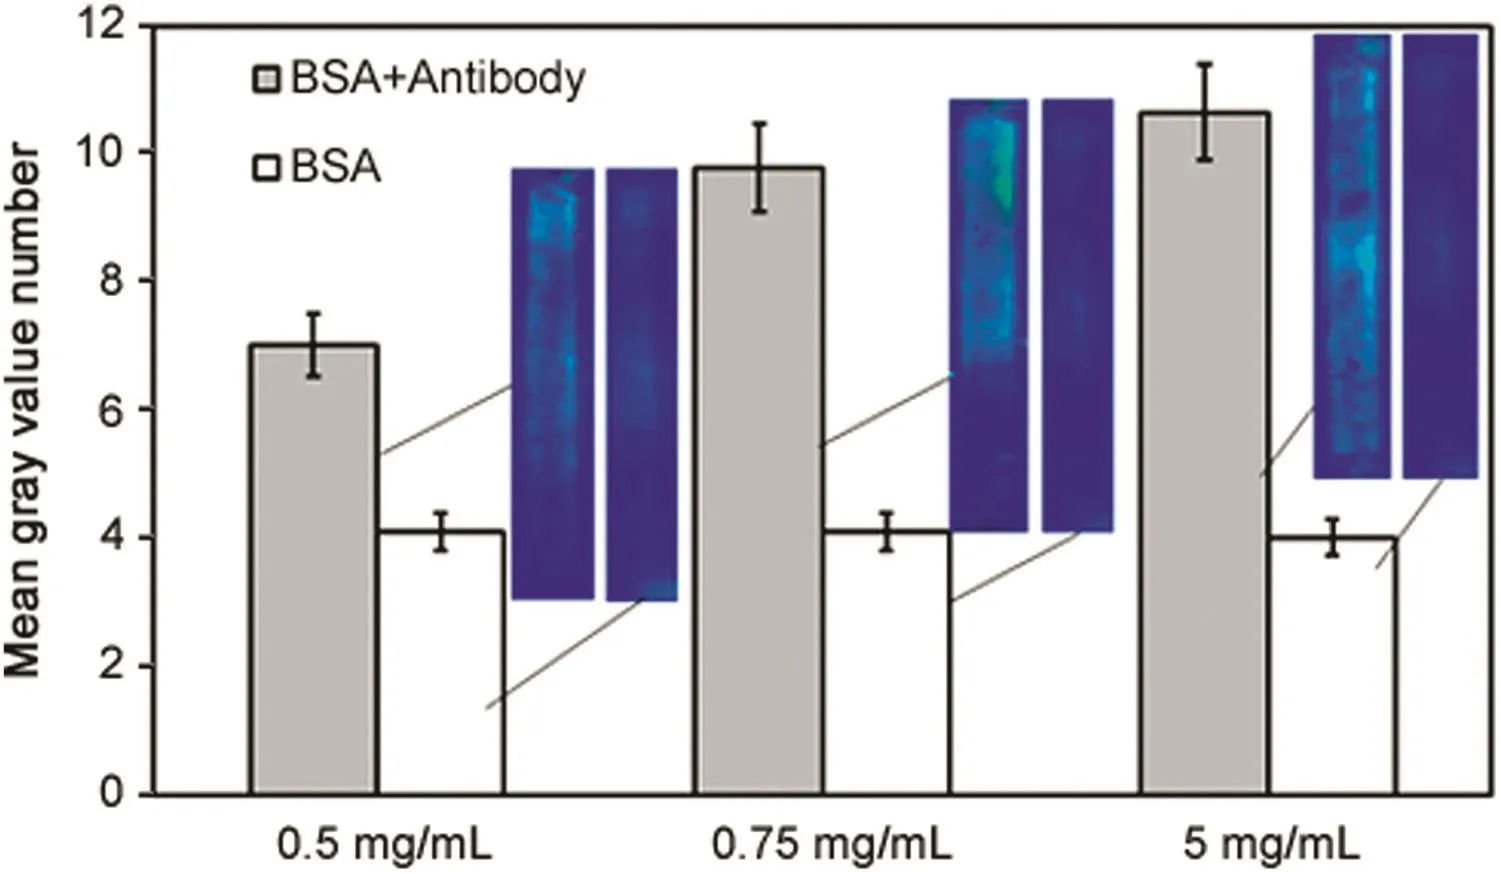
Fig.11.Effect of anti-BSA concentration on fluorescence intensity due to permeation drag induced immobilization of immunocomplex(grey∶immunocomplex experiment;white∶control experiment;cross- flow rate∶0.21 mL/min; filtration rate∶0.14 mL/min;sample loop∶100 μL;FITC-BSA concentration∶0.2 mg/mL).
While these results do suggest that this technique could be utilized for quantitative analysis of antibodies,the non-linear relationship between antibody concentration and intensity clearly indicates the complex nature of the interaction between antigens and antibodies.One IgG antibody molecule can in theory bind up to two antigen molecules.Moreover,large antigens like FITC-BSA have been shown to possess two of more antigenic determinants of the same or different types21.Therefore,different types of immunocomplexes consisting of different permutations and combinations of antigen and antibody,and indeed larger network-like structures could be produced when antigens and antibodies are mixed.Moreover,the proportion of the different types of immunocomplexes would also depend on the antigen-antibody ratio[21].
Fig.12 shows the effect of FITC-BSA concentration on the intensity obtained by immunocomplex polarization.In these experiments,the antibody concentration was kept fixed at 0.75 mg/mL while two antigen concentrations(0.2 and 0.5 mg/mL)were examined.The remaining experimental conditions were the same as that described in the previous paragraph.Increase in antigen concentration resulted in significant increase in intensity,once again pointing towards the possibility of using such techniques for quantitative measurements.
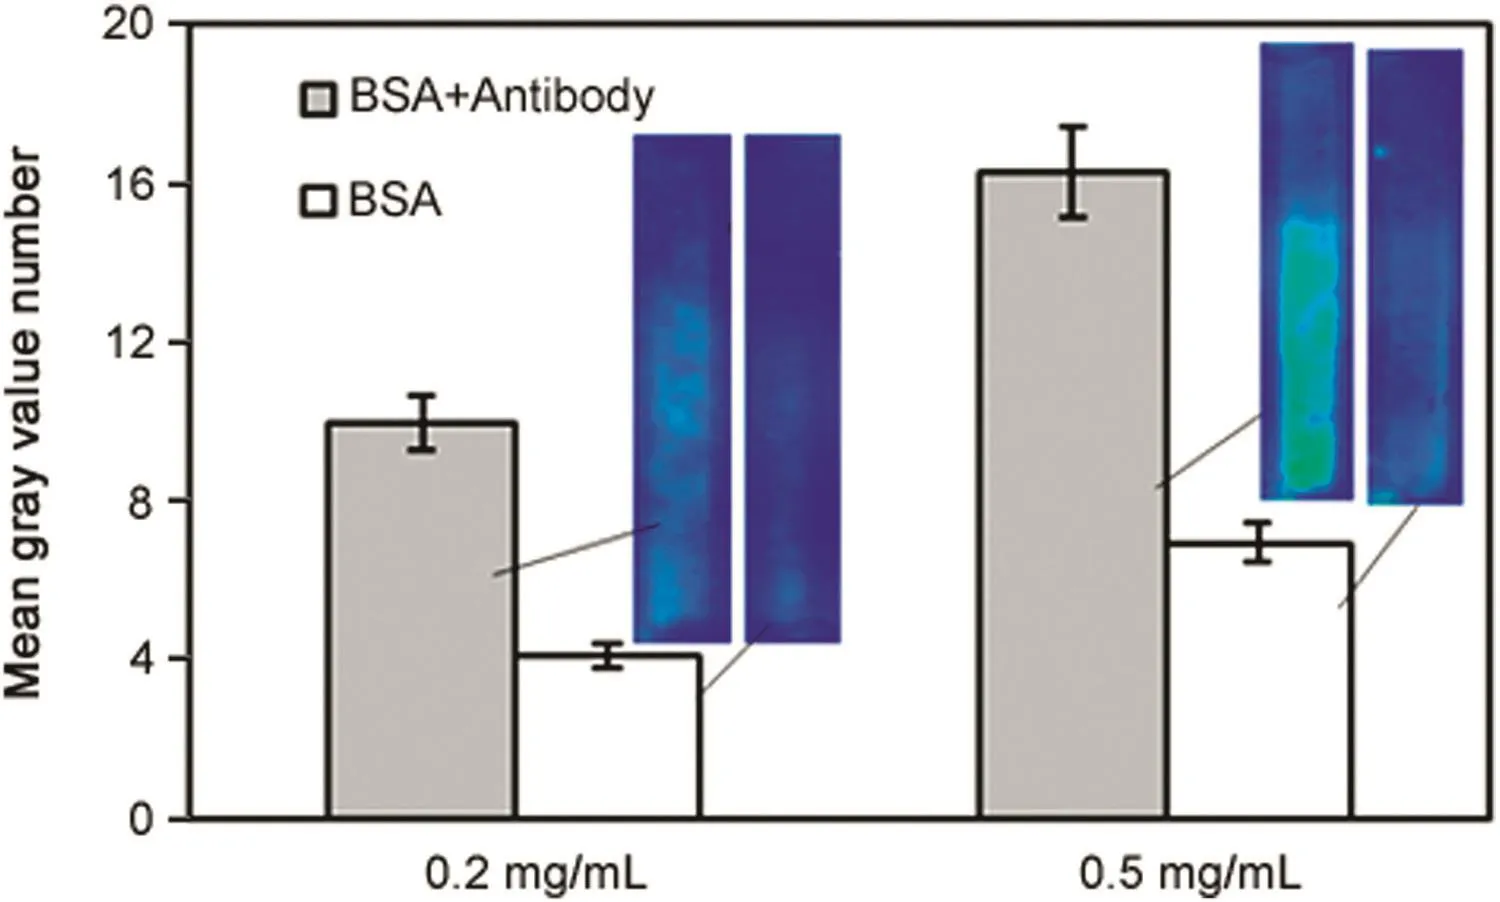
Fig.12.Effect of FITC-BSA concentration on fluorescence intensity due to permeation drag induced immobilization of immunocomplex(grey∶immunocomplex experiment;white∶control experiment;cross- flow rate∶0.21 mL/min; filtration rate∶0.14 mL/min;sample loop∶100 μL;anti-BSA concentration∶0.75 mg/mL).
The current study is primarily intended to show that dynamic and reversible,localized immobilization of large macromolecules and their complexes could be carried out adjacent to an ultrafiltration membrane by inducing permeation drag.In this study,direct visual observation along with fluorescent imaging was utilized to detect FITC-labeled species.Such localized enrichment by ultra filtration would seem to be a viable alternative to chemical and physical binding methods typically employed in analytical techniques such as immunoassays,surface plasmon resonance and Raman spectroscopy to develop different analytical methods.Unlike chemical and physical binding which require additional steps,reagents and specific solution conditions,localized concentration could be easily carried out at any solution condition.The fact that such localized permeation drag induced enrichment is reversible and can be rapidly dissipated simply by stopping filtration implies that sequential analysis of multiple samples within the same device would be possible.Very simple membrane blocking methods such as applying glue with the paint brush were employed in the current study.Using more sophisticated techniques such as lithography and microcontact printing,better defined patterns and features could be generated on the surface of a membrane,and thereby the reliability,precision and detection capabilities of the technique could be enhanced so that much lower concentrations could be tested.Furthermore,the speed and economy of the techniques could be improved by scaling it down to micro fluidic level.Arrays of macromolecule-immobilized regions with varying degrees of enrichment could therefore be created adjacent to a membrane by independently manipulating the local filtration rates.Such capability would be useful for high throughput screening of drugs and other chemical substances,and forstudying macromolecule-macromolecule interactions.As shown in Eq.(1),the diffusivity,which in turn is dependent on other properties such as hydrodynamic radius and molecular weight,would affect the extent of enrichment.Moreover,the rate of immobilization as well as the rate of dissipation would depend on these properties as well as on physicochemical parameters such as pH and salt concentration.The technique could therefore potentially be modified to study physical properties of macromolecules and fine particles.
4.Conclusions
The feasibility of carrying out dynamic enrichment of macromolecules and macromolecular complexes near the surface of a membrane was demonstrated by inducing permeation drag followed by direct visual observation and fluorescence imaging of immobilized FITC labeled macromolecules.The fluorescent intensity which is indicative of the extent of enrichment could be manipulated by changing the filtration rate.At the different test conditions examined in this study,macromolecule immobilization was found to be reversible.The rate of macromolecule accumulation when filtration was started was slower than the rate of dissipation when filtration was stopped.Larger macromolecules and macromolecularcomplexesshowed greater fluorescent intensity,indicating that they were easy to enrich.Using this principle,an immunocomplex could be detected and distinguished from its constituent antigen and antibody molecules.Such capability for immunocomplex detection could be developed further into immunoassays for detecting specific antigens and antibodies.Intensity data obtained with different antigen and antibody concentrations clearly suggest that the technique could be suitable for quantitative analysis.Simulation of the permeation drag based enrichment can be carried out using COMSOL Multiphysics for any particular system,leading to enhanced adjustment of the parameters.Overall,localized permeation drag induced immobilization could be a viable alternative to localized immobilization of macromolecules by chemical bonding or physical adsorption,typically carried out as the first step in many commonly used analytical techniques.
Conflicts of interest
The authors declare that there are no conflicts of interest.
Acknowledgments
We thank the Natural Science and Engineering Research Council(NSERC)of Canada for funding this study,Paul Gatt(Chemical Engineering Department,McMaster University)for fabricating the membrane module,and Xiaojiao Shang and Si Pan(Chemical Engineering Department,McMaster University)for helping with photography involved in this study.R.G.holds the Canada Research Chair in Bioseparations Engineering.
[1]D.Samanta,A.Sarkar,Immobilization of bio-macromolecules on self-assembled monolayers∶methods and sensor applications,Chem.Soc.Rev.40(2011)2567–2592.
[2]D.S.Wilson,S.Nock,Recent developments in protein microarray technology,Angew.Chem.Int.Ed.42(2003)494–500.
[3]D.J.O’Shannessy,M.Brigham-Burke,K.Peck,Immobilization chemistries suitable for use in the BIAcore surface plasmon resonance detector,Anal.Biochem.205(1992)132–136.
[4]R.L.Rich,D.G.Myszka,Advances in surface plasmon resonance biosensor analysis,Curr.Opin.Biotechnol.11(2000)54–61.
[5]J.Schartner,B.Mei,M.Ro,et al.,Universal method for protein immobilization on chemically functionalized germanium investigated by ATR-FTIR difference spectroscopy.,135(2013)4097-4087.
[6]C.D.K.Sloan,M.T.Marty,S.G.Sligar,et al.,Interfacing lipid bilayer nanodiscs and silicon photonic sensor arrays for multiplexed protein-lipid and proteinmembrane protein interaction screening,Anal.Chem.85(2013)2970–2976.
[7]A.H.C.Ng,U.Uddayasankar,A.R.Wheeler,Immunoassays in microfluidic systems,Anal.Bioanal.Chem.397(2010)991–1007.
[8]A.Guo,H.Gu,J.Zhou,et al.,Immunoaffinity enrichment and mass spectrometry analysis of protein methylation,Mol.Cell.Proteom.13(2014)372–387.
[9]B.M.Gray,ELISA methodology for polysaccaride antigens∶portein coupling of polysaccaries for adsorption to plastic tubes,J.Immunol.Methods 28(1979)187–192.
[10]X.Qian,A.Levenstein,J.E.Gagner,et al.,Protein immobilization in hollow nanostructures and investigation of the adsorbed protein behavior,Langmuir 30(2014)1295–1303.
[11]J.E.Flynn,Solute Polarization and Cake Formation in Membrane Ultra filtration∶Causes,Consequences and Control Techniques,Plenum Press,New York 1970∶47–97.
[12]A.A.Kozinski,E.N.Lightfoot,Protein ultra filtration∶a general example of boundary layer filtration,AIChE J.18(1972)1030–1038.
[13]A.L.Zydney,A concentration polarization model for the filtrate flux in crossflow micro filtration of particulate suspensions,Chem.Eng.Commun.47(1986)1–20.
[14]G.Z.Ramon,E.M.V.Hoek,On the enhanced drag force induced by permeation through a filtration membrane,J.Membr.Sci.392–393(2012)1–8.
[15]Q.T.Nguyen,K.Glinel,M.Pontié,et al.,Immobilization of bio-macromolecules onto membranes via an adsorbed nanolayer∶an insight into the mechanism,J.Membr.Sci.232(2004)123–132.
[16]Q.T.Nguyen,Z.Ping,T.Nguyen,et al.,Simple method for immobilization of bio-macromolecules onto membranes of different types,J.Membr.Sci.213(2003)85–95.
[17]R.van Reis,E.M.Goodrich,C.L.Yson,et al.,Constant Cwallultra filtration process control,J.Membr.Sci.130(1997)123–140.
[18]H.B.Winzeler,G.Belfortb,Enhanced performance for pressure-driven membrane processes∶the argument for fluid instabilities,J.Membr.Sci.80(1993)35–47.
[19]D.C.Culle,R.G.W.Brown,C.R.Lowe,Detection of immune-complex formation via surface plasmon resonance on gold-coated giffraction gratings,Biosensors 3(1987)211–225.
[20]J.H.Han,H.J.Kim,L.Sudheendra,et al.,Photonic crystal lab-on-a-chip for detecting staphylococcal enterotoxin B at low attomolar concentration,Anal.Chem.85(2013)3104–3109.
[21]N.H.Chiem,D.J.Harrison,Monoclonal antibody binding affinity determined by microchip based capillary elecrphoresis,Electrophoresis 19(1998)3040–3044.
 Journal of Pharmaceutical Analysis2018年3期
- Journal of Pharmaceutical Analysis的其它文章
- JPA Prize in 2016
- Sensitive and rapid determination of amantadine without derivatization in human plasma by LC–MS/MS for a bioequivalence study
- Physics,chemistry,and Hirshfeld surface analyses of gamma-irradiated thalidomide to evaluate behavior under sterilization doses
- Enhancing the dissolution of phenylbutazone using Syloid?based mesoporous silicas for oral equine applications
- Identi fication of three kinds of Plumeria flowers by DNA barcoding and HPLC specific chromatogram
- Evaluation of physicochemical properties as supporting information on quality control of raw materials and veterinary pharmaceutical formulations
