Quantifying muskmelon fruit attributes with A-TEP-based model and machine vision measurement
School of Agriculture and Biology, Shanghai Jiaotong University, Shanghai 200240, P.R.China
1. Introduction
Muskmelon (Cucumis meloL.) is a popular fruit in China.Usually, its surface attributes, such as size, color, and skin netting, can be used as indicators of fruit growth, and health(Cuberoet al.2011; Kacira and Ling 2001). Especially, fruit size is important for judging whether post-harvest fruits meet the requirements of some processing machines in the food industry (Savakar and Anami 2009). And, diameter can also be used to quantify the effects of nitrogen and water content during fruit growth (Daiet al.2011). In addition,skin color can reflect nutritional deficiencies and muskmelon maturity degree, which can be estimated using an automatic in-section system (Swainet al.2010; Hassanet al.2011;Domingoet al.2012). Recently, some studies have explored to grade fruits based on skin color using machine vision technology (Cuberoet al.2014; Gomeset al.2014; Jafariet al.2014).
As for varieties of netted muskmelon, the aesthetic appearance is particularly important due to it can increase the marketability of the fruit (Keren-Keisermanet al.2004a,b). Different varieties and different growth stages of muskmelons have different skin features, such as netting,ribbing, and sutures, and it is possible that net formation could be improved through optimal management practices and environmental conditions (Webster and Craig 1976;Combrinket al.2001; Keren-Keisermanet al.2004a).Netting is formed from the epidermal callus, and ethylene plays an important role in this process (Kazamaet al.2004; Gerchikovet al.2008). There is a close relationship between environmental conditions and netting formation,specifically nitrogen and water contents in the soil (Puthmeeet al.2013).
Temperature and radiation are two of the most important factors affecting plant growth (Heuvelink and Marcelis 1996; Helyes and Pek 2001; Lovdalet al.2010). In the greenhouse, temperature and solar radiation are not synchronous due to heating and cooling way. With growing degree days (GDD)-based models, the prediction of plant organs growth situation is not accuracy enough, because the effects of solar radiation on plant growth is not considered(Marceliset al.1998). Thus, the accumulated product of thermal effectiveness and photosynthetic active radiation(PAR) (A-TEP) was proposed and used for studying leaf area (Luoet al.2006) and N content (Luoet al.2008).Then, prediction accuracy of plant organs growth situation using A-TEP-based model is significantly higher than that of GDD-based models.
The dynamic micro-changes of plant organ surfaces(leaves, stems, fruits, etc.) can be captured by the continuous and convenient acquisition of crop growth images by machine vision technology and extract the data for quantitative description of dynamic growth process(Turner 1986; Evans 1989). It is necessary to establish a human and plant dialogue, in which plants are monitored in real time by sensors to tell us about their growth requirements, such as water and fertilizer requirements,and a control decision is implemented. Computer vision technology research focuses on developing extraction algorithms to obtain image information (Liet al.2012). Crop health can be estimated based on parameters obtained by image analysis, including surface parameters (Hemming and Rath 2001; Kacira and Ling 2001), water status (Segineret al.1992; Gonzalez-Esquivaet al.2017), and nutrient and pest identification (Pydipatiet al.2005; Fioraniet al.2012),and these information can be used to improve the scientific management of crop growth.
The focus of this study was to build a morphological model of fruit development based on fruit surface attributes(size, color and netting) by studying and quantifying the relationships between the growth rules for fruit size, color,and netting and environmental factors. These results will provide a theoretical basis for precision cultivation management based on the prediction of fruit growth and external quality.
2. Materials and methods
2.1. Experimental design
Muskmelon (Cucumis melo var.Wanglu) was used as materials in this study, which is a mid-maturity cultivar and suitable for greenhouse cultivation, with attractive netting and spherical shape.
The research was conducted in a multiplan greenhouse at Shanghai Jiaotong University, China (31°11′ N, 121°29′W), and the glasshouse heating, ventilation, internal and external shading were all automatically regulated by Priva Software (Priva Company, The Netherlands). There were five repetitive experiments from 2009 to 2011. Three of the repetitions were done from the beginning of March to early July in 2009, 2010 and 2011, respectively, while the other two were conducted from the beginning of August to mid-November in 2009 and 2010.
Experiments were done at a fix area in the greenhouse.There were 1 440 plants in each repetition by completely randomized design, 20 rows in north-south direction with spacing 130 cm each, 36 pots in a row with 20-cm apart and two plants per pot. The upper and lower diameters of the pot were 30 and 26 cm, respectively, and the height was 30 cm. Each pot contained 6 L cultivation substrate of 1:1:1 (v/v) mixture of vermiculite, perlite and peat. At two-true leaf stage, the muskmelon seedlings were vertically planted in pots with plug-seedling method. The density was 6.5 plants m–2. Plants were pruned to a single branch by removing the tip of each plant when the number of leaves grew to 24, and then flowers were hand pollinated. One fruit was kept on each plant. Irrigation was managed by an automatic drip system.
2.2. Acquisition of environmental data
Two HOBO-21 Weather Stations (Onset, Bourne, MA, USA)were placed at two different locations of the greenhouse and taken data every 5 min, including air temperature, relative humidity, inside solar radiation, PAR and CO2concentration.The averaged values were used in later analysis.
2.3. Image acquisition, processing, and data abstraction
In each repetition, 15 plants were randomly selected, and phenotype data were obtained using 15 image acquisition systems, which comprised a megapixel fixed-focus lens(focal length of 16 mm, C-Mount and Iris 1.4–16, and a horizontal viewing angle of 30.8°), an image acquisition module C6820, and a timing control module (Computer Industry, Japan) (Fig. 1). The size of image captured by the C6820 module was 1 280×960 pixels with a JPEG export format. The collected images were stored in a wireless sensor network in Zigbee Protocol (Shanghai Shun Zhou Intelligent Technology Co., Ltd., China) to enable the fruit images continuous, high-precision, and uniform.
Images acquisition of fruit, fruit pedicle, and leave were done in the greenhouse. Therefore, pre-processing was needed by MATLAB 2009b (The MathWork, Inc., Natick,MA, USA) before fruit image extraction. The pre-processing steps in fruit outline acquisition are shown in Fig. 2.
In addition, fruit morphology parameters and color were both calculated in MATLAB 2009b (MathWork) using the following procedure (Fig. 2-F and H).
The calculation of vertical and horizontal diametersFruit horizontal and vertical diameters were calculated by counting the number of white pixels at fruit center (x,y) of the fruit surface as shown in Fig. 2-F and along the horizontal and vertical axes as shown in Fig. 2-H. Then the number of pixels was converted into units mm according to the actual size of the grid.
Netting coverage rateIn this study, the netting coverage rate represented the growth pattern of skin netting. And the larger the netting coverage rate value (0–1) is, the more nettings are. The upper section of fruit was exposed to camera lens for measuring the netting coverage rate. A part of the grayscale image was intercepted, and then converted into a binary image (Fig. 3). The white region of the binary image represented the netting and was used to calculate the area of the non-white regions (An) and the intercepted area (A0). The netting coverage rate was calculated as:

2.4. Data analysis and utilization

Fig. 1 Diagram of the image acquisition system (left) and muskmelon fruit (right) in the greenhouse. 2M, 2 million; CMOS,complementary metal-oxide-semiconductor.

Fig. 2 Muskmelon image. A, original image. B, grayscale image. C, find false edge. D, remove falseedge. E, interpolate edge.F, interpolate area. G, interpolate contours in the original image. H, separate fruit from the background.
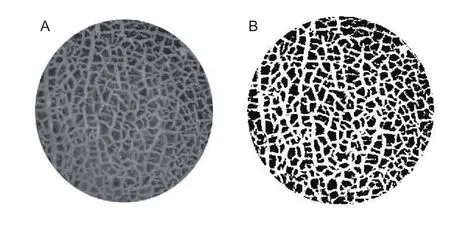
Fig. 3 The binarization of image. A, grayscale image. B,binary image.
Statistical analyses were conducted using the mean value of repeated observations in each experiment. To fully simulate and improve the robustness of the model, the averages of the data from the spring experiment were used to build the model, and the averages of the data from the autumn experiment were used to test the model performance. The basic parameters were determined using the least squares method and a trial and error method. The fit between the simulated and observed values was verified using root mean square error (RMSE). Lower RMSE values indicated greater model reliability. The RMSE was calculated with the following equation:

Where, OBSiandSIMiare the observed and simulated values, respectively, andnis the sample number.
3. Results
3.1. Calculation of A-TEP
Temperature and light are two important factors that affect the growth of muskmelon fruit. Fruit setting and growth rate are mainly determined by the relative thermal effectiveness(RTE) and PAR. To integrate the effects of both temperature and light on fruit setting, development and maturation,A-TEP was used as the model driver to predict the fruit growth. A-TEP, the product of RTE and PAR, was calculated as follows (Luoet al.2008):

Where,T(°C) is the average temperature per hour;Tb(°C) andTm(°C) are the lower and upper limit temperatures, respectively;Tob(°C) andTou(°C) are the lower and upper optimum temperatures, respectively.
Fruit developing response to temperature were different when temperature was not optimum for growth. RTE increased linearly at lower temperature, then maintained at the maximum value at optimum temperature. When the temperature reached to the maximum optimum temperature for plant growth, RTE began to decrease linearly. The change tendency of RTE could be expressed by eq. (3) too.And the minimum, optimum and maximum temperatures during fruit growth are shown in Table 1.
The response of fruit development to temperature differed when the temperature was above or below the optimum temperature. RTE increased linearly as the temperature increased until the optimum lower temperature was reached.From that point until the optimum upper temperature was reached, RTE maintained its maximum value. When the temperature was between the optimum upper temperature and the maximum temperature, RTE decreased linearly as the temperature increased (eq. (3)). The minimum, optimum and maximum temperatures during fruit growth are shown in Table 1.
PAR was calculated using the following equation as described in Goudriaan and van Laar (1994):

Where,Qis the solar radiation per hour (J m–2h–1).
The hourly production of thermal effectiveness and PAR(H-TEP) was then calculated by multiplying RTE by the total PAR in the corresponding hour:

The daily total production of thermal effectiveness(D-TEP) was calculated as:

Finally, A-TEP was calculated as follows:

Where, A-TEPi(MJ m–2) and A-TEPi+1(MJ m–2) are the accumulative thermal radiation from pollination to theiand(i+1)th d, respectively; D-TEPi+1(MJ m–2d–1) is the thermal radiation on the(i+1)th d.
3.2. Simulation of fruit vertical and horizontal diameter based on A-TEP
From the analysis of data from the spring experiment, the relationship between A-TEP and the horizontal and vertical diameters of fruit was determined using a mathematical modeling method (eqs. (8), (9), and (10), Fig. 4). ΔA-TEPj(MJ m–2) is the accumulated A-TEP after fruit setting forj-day;A-TEPj(MJ m–2) is the accumulated A-TEP from flowering to fruit growth forjd; A-TEPf(MJ m–2) is the accumulated A-TEP from flowering to fruit setting. These parameters were calculated as follows:

Table 1 The minimum, optimum, and maximum temperatures (°C) during muskmelon growth
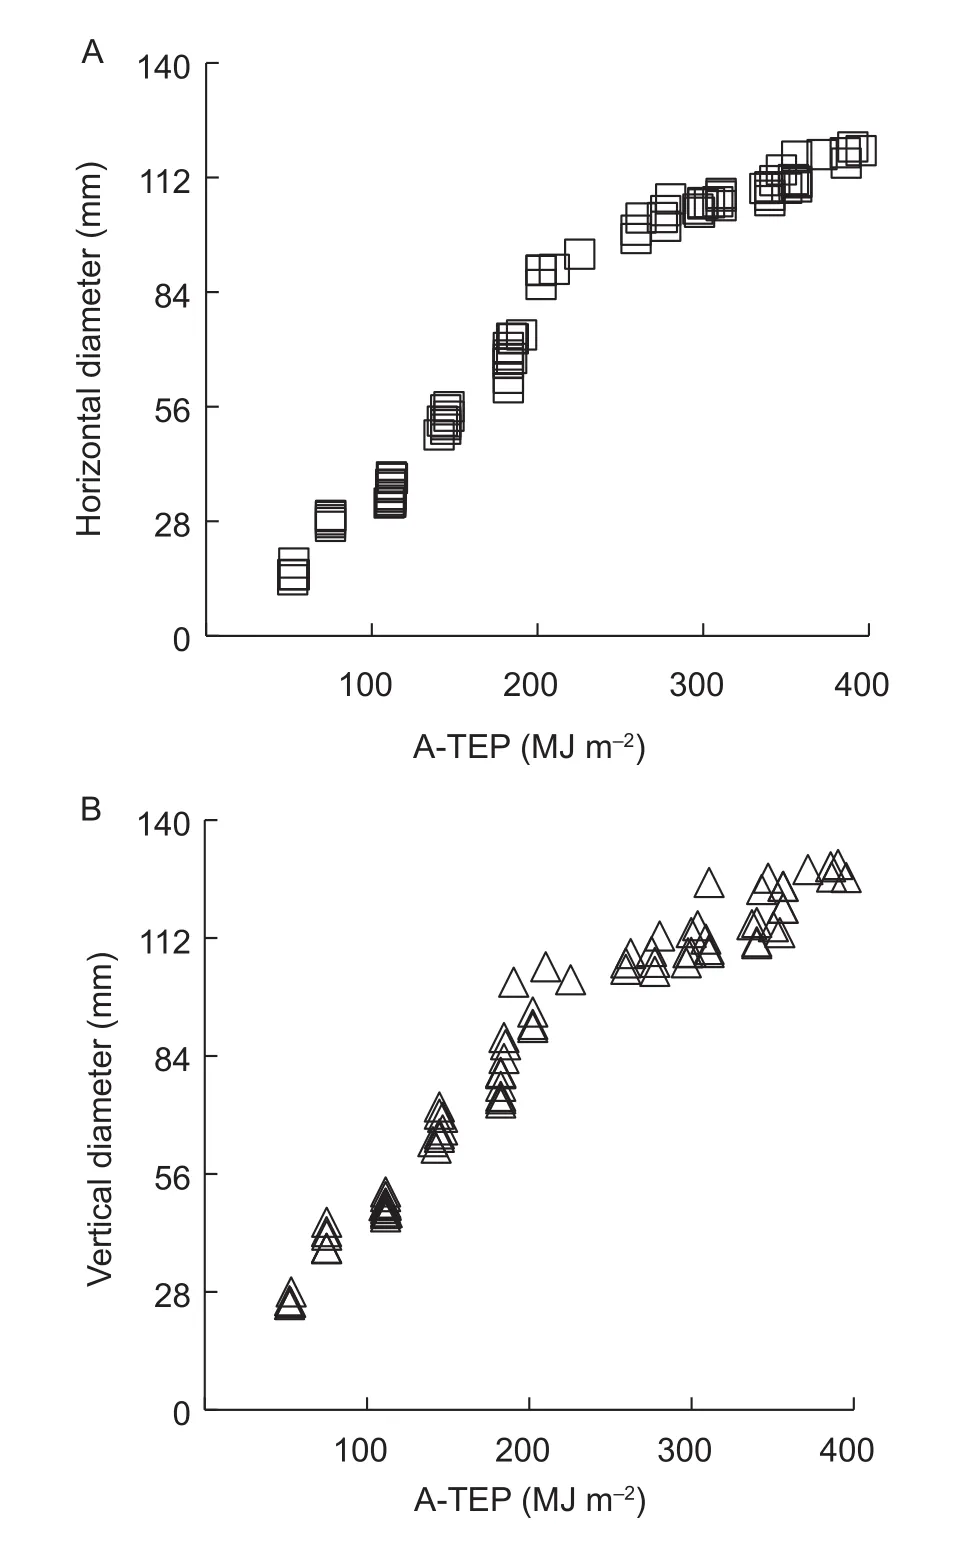
Fig. 4 Relationship between horizontal (A) and vertical (B)muskmelon fruit diameters and the accumulated thermal effectiveness and photosynthetic active radiation (PAR)(A-TEP). MJ, mega joule.
So, the fruit horizontal and vertical diameters were both 78 mm withR2=0.9941 and SE=3.6381,R2=0.9879 and SE=4.8741, respectively. After pollination, the growing rates of horizontal and vertical diameters were different, which was slowly at 0–5 d, then rapidly at 5–25 d, at last became very slowly until fruit maturation.
3.3. Simulation of fruit color defined as the (red, green and blue) RGB color value
Images were taken at the same time of each day during fruit growth cycle, which was to minimize changes in sun light intensity, and the surface color information was extracted.The RGB values were analyzed using MATLAB 2009b(MathWork), and normalized for reducing inconsistency in sample light intensity.

Where, R, G, and B represented the red, green, and blue color indices of muskmelon, respectively.
As shown in Fig. 5, normalized R decreased at the beginning and then increased during fruit ripening. While,normalized G,making up the largest proportion of fruit color, firstly increased and then decreased. These results indicated that green was the predominant color of fruit during the growing season. Normalized B gradually increased during fruit growth. Based on the relationships of RGB values and A-TEP, the following equation can be derived:
FR, FG, FB(A-TEP)=Fa×ΔA-TEPj2+Fb×ΔA-TEPj2+Fc(14)
Where,FR,FG and FB(A-TEP) are the A-TEP of normalized R, G, and B of at certain time, respectively; andFa,FbandFcare coefficients.
Hue, saturation and brightness (HlS) of colorHue is the transmission color, which is reflected or transmitted by objects. Saturation refers to the level of color depth. The higher saturation levels are, the deeper colors are resulted;and the higher the proportion of white has, the lower the saturation level is. Brightness refers to the intensity of light perceived by the human eye. There are conversion relationships between the values of HSI and RGB, so HSI values were calculated from RGB values.

Fig. 5 Relationship between fruit red, green and blue (RGB)values and the cumulative production of thermal radiation(A-TEP).
For a given color image, hue was calculated using the following equations:

The saturation component was calculated using the following equation:

Finally, the brightness component was calculated using the following equation:

Based on HSI data for fruit surface color during the growth process, the relationship between HSI and A-TEP could be estimated (Fig. 6). The hue channel value changed little during the growth process, whereas the saturation channel value decreased continuously. The brightness channel values first increased and then decreased with time. The saturation and brightnesschannels were obtained using the following eqs. (19) and (20):

WhereFg,Fh,Fi,FjandFkare coefficients. According to calculations based on the experimental data, the values ofFg,Fh,Fi,FjandFkwere 0.52, ?8.96×10⁻⁴, 9.35×10⁻⁴, 0.40,and 55.79, respectively.
3.4. Simulation of netting formation
A gray level co-occurrence matrix (GLCM) was used to study the process of fruit texture formation. Three characteristic parameters were used to quantify the dynamic formation of netting: angular second moment (ASM), entropy and contrast.
The method for extracting netting characteristic parametersGLCM is defined as a joint probability distribution (Pδ) of two gray-scale pixels, which can be simultaneously observed at distanceδ=(Δx, Δy) in an image.An element of GLCM,Pδ(i,j), have one pixel of gray scale(i) and another pixel of gray scale (j), and the two pixels are appearance at a distanceδequaling to (Δx, Δy).δreflects the distance and direction of two pixels. Usually,four directions are used for a pixel position: i) 0°, that is, the horizontal direction,δ=(0, ±d),dmean two pixels distance;ii) 45°,δ=(d, –d) andδ=(–d,d); iii) 90°, the vertical direction,δ=(±d, 0); iv) 135°,δ=(d,d) andδ=(–d, –d)


Fig. 6 Relationship between fruit hue, saturation, and brightness values and the accumulated thermal effectiveness and photosynthetic active radiation (PAR) (A-TEP). MJ, mega joule.
MATLAB 2009b (MathWork, USA) was used to measure three netting characteristic parameters, GLCM, energy(ASM), entropy and contrast at directions of 0°, 45°, 90° and 135°, from the images. Then, the average values for each of the four directions were calculated for netting analysis.
ASM, is a measure of uniformity of the image grayscale distribution, it is also known as energy when elements of the GLCM distribution are more concentrated in the diagonal which indicates that grayscale distribution is more uniform than the local area of the observed image. When each value of theP(i,j) distribution is uniform, ASM is smaller; when any singleP(i,j) value is high and the remaining values are small, ASM is larger.

Where,Lis the the number of pixels in an image;iandjare the grayscale values of two images.
Entropy is information amount in an image, where netting is one source of information. In this study, if there was little netting information and GLCM was almost 0, entropy was also close to 0. If images were filled with thin netting and values ofP(i, j) were approximately equal, entropy was high.If thin netting was less densely distributed in the image,there was a large difference in the values ofP(i, j), and the entropy of the image was small.

The contrast of the image can be understood as the sharpness of the image, which in turn reflects the sharpness of the netting. In an image, the deeper netting grooves showed, the greater contrast and the clearer visually were.Conversely, if the contrast was small, the visual effect was fuzzy, indicating that the netting grooves were shallow. The higher the number of pairs of pixels with large contrasts, the higher the contrast value is.

Simulation of netting characteristic parametersThe values of the netting characteristic parameters during different stages of fruit growth, such as ASM, entropy and contrast, were collected and analyzed alongside changes in A-TEP (Fig. 7). The values of ASM were different significantly at different growth stages, but there were no obvious changing regulation. The value of entropy increased with melon maturity, indicating the number of netting stripes gradually increased during netting formation. The increase in contrast indicated that netting became deeper, and the clarity of texture increased. The relationships between entropy, contrast and A-TEP were calculated from the data shown in Fig. 8 entropy and nine contrast as follows:
Contrast (A-TEPj) or Contrast (A-TEPj)=

Where, entropy (A-TEPj) and contrast (A-TEPj) are the values of entropy and contrast at certain time of A–TEPj.Two coefficients,FlandFm, were 6.45×10⁻³, 0.398 and 3.82×10⁻³, –0.693, respectively.
Simulation of netting coverageAccording to the data on fruit netting coverage rate throughout the growing season,analyzed with A-TEP, muskmelon fruit coverage rate was calculated as follows:

Where, coverage rate (A-TEPj) is the netting coverage at certain time of A-TEPj, which was 29 withR2=0.9967 and SE=0.015.

Fig. 7 Relationship between fruit angular second moment (ASM), entropy, contrast values, and the accumulated thermal effectiveness and photosynthetic active radiation (PAR) (A-TEP). MJ, mega joule.
Based on eq. (25), after pollination, netting did not appear on muskmelon within 15 d, whereas between 15–30 d the netting grew rapidly, and then could cover nearly half of the fruit surface. After pollination 30 d, the coverage did not change too much (Fig. 9).
3.5. Simulation results
The autumn experimental data were used to test the fruit growth model parameters based on A-TEP. Using A-TEP to simulate the growth of muskmelon fruit in the greenhouse yielded relatively precise values of vertical and horizontal diameters; the RMSE values between the simulated and measured fruit vertical and horizontal diameters were 3.527 and 4.696 mm, respectively.
RMSE between the simulated and measured red, green,blue, and saturation and brightness values were 0.999,2.690, 2.992, 0.033 and 5.51, respectively (Fig. 10).
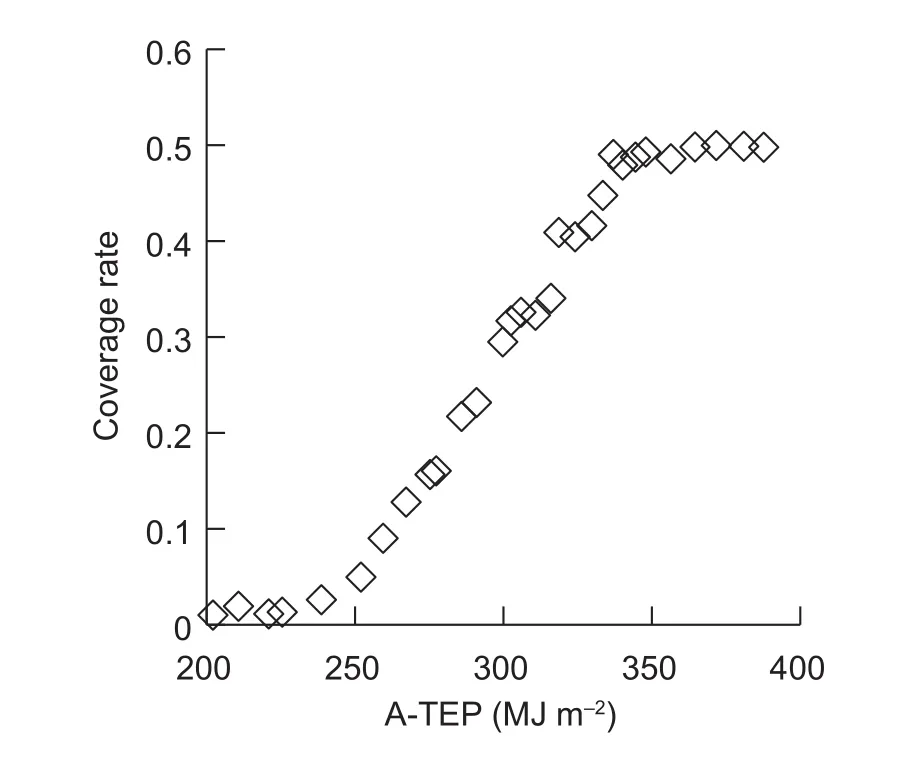
Fig. 8 Relationship between netting coverage rate and the accumulated thermal effectiveness and photosynthetic active radiation (PAR) (A-TEP). MJ, mega joule.
RMSE between the simulated and measured values for entropy, contrast and coverage rates were 0.077, 0.063 and 0.015, respectively (Fig. 11).
4. Discussion
The external quality of muskmelon fruit not only enhances the aesthetic degree, but also improves the commodity value (Puthmeeet al.2013). Studying the change in muskmelon fruit attributes during the growth process and their relationship with environmental conditions is important for understanding the rules of fruit formation and predicting external quality, so as to provide the basis for cultivation management.
The vertical and horizontal diameters of fruit are an important biological indicator of fruit growth characteristics,and hence are important parameters for building morphological models. We found that changes in vertical and horizontal diameter followed a logistic curve with rapid fruit growth 5–25 d after pollination, which is consistent with previous reports(Heuvelink1996;Keren-Keisermanet al.2004). RMSE values between the simulated and measured results for the vertical and horizontal diameters, were 3.527 and 4.696 mm, respectively. Therefore, the vertical and horizontal models could accurately simulate the dynamic change in fruit size.
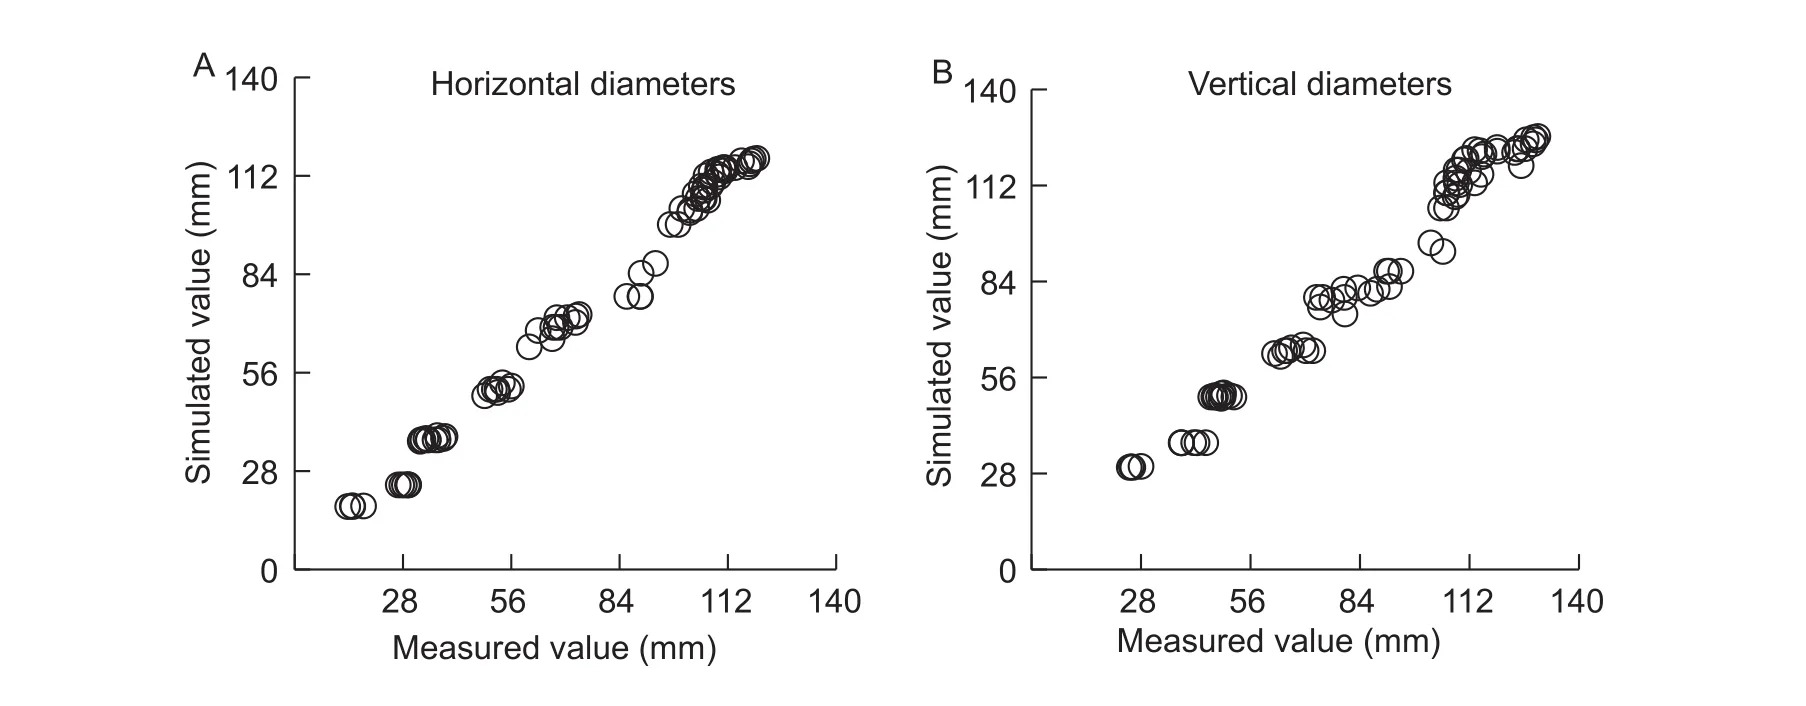
Fig. 9 Comparison of the simulated and measured horizontal (A) and vertical (B) fruit diameters of muskmelon.
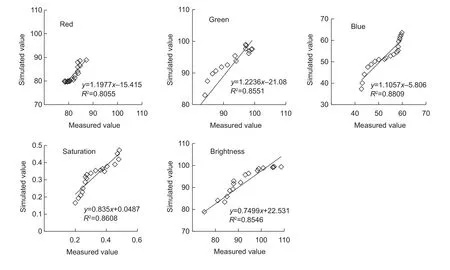
Fig. 11 Comparison of the simulated and measured values for red, green, blue, saturation, and brightness of muskmelon fruit.

Fig. 10 Comparison of simulated and measured entropy, contrast and coverage rate values of muskmelon fruit.
In this study, two color spaces, RGB and HSI, were used to describe the change in fruit color. These methods have been used in a number of applications, including automatic inspection and quality evaluation of fruits and vegetables(Cuberoet al.2011), locating fruit on trees (Jimenezet al.2000), automatic sorting and grading of fruit (Raoet al.2004), disease inspections (Kimet al.2009) and assessing external damage to fruit (Riquelmeet al.2008). We found that the green value was the dominant color, accounting for the largest proportion of the three components. Green color increased during the early stages of fruit development and then decreased at maturity. The red value was low at first, and then increased during fruit ripening, indicating that red was the main color at this stage. The blue value gradually increased during fruit growth. The hue value was basically stable, while the S value decreased continuously.The brightnessvalue first increased and then decreased during fruit growth. The RMSE between the simulated and measured results for red, green, blue, saturation,and brightnesswere 0.999, 2.690, 2.992, 0.033 and 5.51 respectively. Therefore, the dynamic change process of fruit color with the A-TEP could be simulated by red, green,blue, saturation, and brightnessmodel.
Skin netting on muskmelon fruit is an important factor for assessing external quality because the appearance of netting is considered an attractive attribute. Netting formation follows a biological pattern described by several groups (Webster and Craig 1976; Heuvelink 1996; Keren-Keisermanet al.2004a). In this paper, three characteristic parameters of the GLCM, ASM, entropy and contrast, and the coverage rate were used to describe the process of muskmelon fruit netting formation. We found that ASM varied between different growths stages, but there was no obvious pattern. Entropy increased with fruit growth,which indicated that the number of netting stripes gradually increased with fruit growth. Contrast also increased,indicating that the thickness of the netting became deeper and clearer with maturity. Based on coverage rate, netting grew rapidly 15–30 d after pollination. The RMSE between the simulated and measured values for entropy, contrast and coverage rate were 0.077, 0.063 and 0.015, respectively,indicating that the coverage rate model including A-TEP could simulate the dynamic process of fruit netting.
In this study, changes in soil moisture status would affect netting formation during fruit growth and hence affect the modeling process. Therefore, research on the effect of outside attributes in stressful environments would enhance applicability. Our present work serves as the basis for predict and regulate external quality of muskmelon fruit.
5. Conclusion
In this study, three of muskmelon fruit traits, size, color and skin netting, were continuously monitored during fruit development using machine vision and image. Results showed that all the three traits followed a specific biological pattern during fruit development. And the simulated value for fruit traits by A-TEP were consistent with that of measured.
Acknowledgements
This work was supported by the National Natural Science Foundation of China (31471411) and the Shanghai Agriculture Applied Technology Development Program,China ((2017) 3-8-4).
Combrink N, Agenbag G, Langenhoven P, Jacobs G, Marais E. 2001. Anatomical and compositional changes during fruit development of ‘Galia’ melons.South African Journal of Plant and Soil,18, 7–14.
Cubero S, Aleixos N, Albert F, Albert F, Torregrosa A, Ortiz C,Garcia-Navarrete O, Blasco J. 2014. Optimised computer vision system for automatic pre-grading of citrus fruit in the field using a mobile platform.Precision Agriculture,15, 80–94.
Cubero S, Aleixos N, Moltó E, Gómez-Sanchis J, Blasco J.2011. Advances in machine vision applications for automatic inspection and quality evaluation of fruits and vegetables.Food and Bioprocess Technology,4, 487–504.
Dai J, Liu S, Zhang W. 2011. Quantifying the effects of nitrogen on fruit growth and yield of cucumber crop in greenhouses.Scientia Horticulturae,130, 551–561.
Domingo D L, Serrano B P, Serrano E P, Del Rosario E J.2012. Digital photometric method for determining degree of harvest maturity and ripeness of ‘Sinta’ papaya (CaricapapayaL.) fruits.Philippine Agricultural Scientist,95,252–259.
Evans J R. 1989. Photosynthesis and nitrogen relationships in leaves of C3plants.Oecologia,78, 9–19.
Fiorani F, Rascher U, Jahnke S, Schurr U. 2012. Imaging plants dynamics in heterogenic environments.Current Opinion in Biotechnology,23, 227–235.
Gerchikov N, Keren-Keiserman A, Perl-Treves R, Ginzberg I.2008. Wounding of melon fruits as a model system to study rind netting.Scientia Horticulturae,117, 115–122.
Gomes J F S, Vieira R R, De Oliveira I A, Leta F R. 2014.Influence of illumination on the characterization of banana ripening.Journal of Food Engineering,120, 215–222.
Gonzalez-Esquiva J M, Oates M J, Garcia-Mateos G, Moros-Valle B, Molina-Martinez J M, Ruiz-Canales A. 2017.Development of a visual monitoring system for water balance estimation of horticultural crops using low cost cameras.Computers and Electronics in Agriculture,141,15–26.
Goudriaan J, Van Laar H H. 1994. Modelling potential crop growth processes.Agricultural Systems,2, 131–142.
Hassan H E, El-Rahman A A, Attia M M. 2011. Color properties of olive fruits during its maturity stages using image analysis.American Institute of Physics,2011, 101-106.
Helyes L, Pék Z. 2001. The simultaneous effect of water supply and radiation on tomato flowering and setting.Acta Horticulturae,542, 227–234.
Hemming J, Rath T. 2001. Computer-vision-based weed identification under field conditions using controlled lighting.Journal of Agricultural Engineering Research,78, 233–243.
Heuvelink E. 1996.Tomato Growth and Yield: Quantitative Analysis and Synthesis. Oxford University Press, USA.pp. 235–254.
Heuvelink E, Marcelis L F M. 1996. Influence of assimilate supply on leaf formation in sweet pepper and tomato.Journal of Horticultural Science,71, 405-414.
Jafari A, Fazayeli A, Zarezadeh M R. 2014. Estimation of orange skin thickness based on visual texture coarseness.Biosystems Engineering,117, 73–82.
Jarquin-Enriquez L, Mercado-Silva E M, Maldonado J L, Lopez-Baltazar J. 2013. Lycopene content and color index of tomatoes are affected by the greenhouse cover.Scientia Horticulturae,155, 43–48.
Jimenez A, Ceres R, Pons J. 2000. A survey of computer vision methods for locating fruit on trees.Transactions of the ASAE - American Society of Agricultural Engineers,43, 1911–1920.
Kacira M, Ling P P. 2001. Design and development of an automated and non-contact sensing system for continuous monitoring of plant health and growth.Transactions of the ASAE,44, 989–996.
Kazama H, Dan H, Imaseki H, Wasteneys G O. 2004. Transient exposure to ethylene stimulates cell division and alters the fate and polarity of hypocotyl epidermal cells.Plant Physiology,134, 1614–1623.
Keren-Keiserman A, Tanami Z, Shoseyov O, Ginzberg I. 2004a.Differing rind characteristics of developing fruits of smooth and netted melons (Cucumis melo).Journal of Horticultural Science & Biotechnology,79, 107–113.
Keren-Keiserman A, Tanami Z, Shoseyov O, Ginzberg I. 2004b.Peroxidase activity associated with suberization processes of the muskmelon (Cucumis melo) rind.Physiologia Plantarum,121, 141–148.
Kim D G, Burks T F, Qin J W, Bulanon D M. 2009. Classification of grapefruit peel diseases using color texture feature analysis.International journal of Agricultural & Biological Engineering,2, 41–50.
Li L, Chang L Y, Ke S K, Huang D F. 2012. Multifractal analysis and lacunarity analysis: A promising method for the automated assessment of muskmelon (Cucumis meloL.)epidermis netting.Computers and Electronics in Agriculture,88, 72–84.
Lovdal T, Olsen K M, Slimestad R, Verheul M, Lillo C. 2010.Synergetic effects of nitrogen depletion, temperature,and light on the content of phenolic compounds and gene expression in leaves of tomato.Phytochemistry,71,605–613.
Luo W, Dai J, Chen Y, Han L, Tai X, Zhang S. 2008. Quantifying the effects of leaf nitrogen content on leaf photosynthesis rate of greenhouse cucumber under different PAR and temperature conditions.Acta Horticulturae,801, 1379–1385.
Luo W, Dai J, Li Y, Yuan C, Chen Y, Ni J. 2006. Predicting leaf area of three greenhouse crops using PAR and temperature.Acta Horticulturae,718, 589–598.
Marcelis L F M, Heuvelink E, Goudriaan J. 1998. Modelling biomass production and yield of horticultural crops: A review.Scientia Horticulturae,74, 83–111.
Puthmee T, Takahashi K, Sugawara M, Kawamata R, Motomura Y, Nishizawa T, Aikawa T, Kumpoun W. 2013. The role of net development as a barrier to moistureloss in netted melon fruit (Cucumis meloL.).Hortscience,48, 1463–1469.
Pydipati R, Burks T F, Lee W S. 2005. Statistical and neural network classifiers for citrus disease detection using machine vision.Transactions of the ASAE,48, 2007–2014.
Rao P S, Gopal A, Revathy R, Meenakshi K. 2004. Colour analysis of fruits using machine vision system for automatic sorting and grading.Journal of Instrumental Society of India,34, 284–291.
Riquelme M, Barreiro P, Ruiz-Altisent M, Valero C. 2008. Olive classification according to external damage using image analysis.Journal of Food Engineering,87, 371–379.
Savakar D G, Anami B S. 2009. Recognition and classification of food grains, fruits and flowers using machine vision.International Journal of Food Engineering,5,64–67.
Seginer I, Elster R T, Goodrum J W. 1992. Plant wilt detection by computer vision tracking of leaf tips.Transactions of the American Society of Agricultural Engineers,35, 1563–1567.
Swain K C, Zaman Q U, Schumann A W, Percival D C, Bochtis D D. 2010. Computer vision system for wild blueberry fruit yield mapping.Biosystems Engineering,106, 389–394.
Turner N C. 1986. Crop water deficits: A decade of progress.Advances in Agronomy,39, 1–51.
Webster B, Craig M. 1976. Net morphogenesis and characteristics of the surface of muskmelon fruit.Journal American Society for Horticultural Science,101, 412–415.
 Journal of Integrative Agriculture2018年6期
- Journal of Integrative Agriculture的其它文章
- Improve access to the EU market by identifying French consumer preference for fresh fruit from China
- Factors influencing hybrid maize farmers’ risk attitudes and their perceptions in Punjab Province, Pakistan
- Long-term grazing exclusion influences arbuscular mycorrhizal fungi and their association with vegetation in typical steppe of lnner Mongolia, China
- Soil microbial characteristics and yield response to partial substitution of chemical fertilizer with organic amendments in greenhouse vegetable production
- Reducing nitrogen fertilization of intensive kiwifruit orchards decreases nitrate accumulation in soil without compromising crop production
- Ultrastructure of the sensilla on antennae and mouthparts of larval and adult Plutella xylostella (Lepidoptera: Plutellidae)
