Association of acute glycemic parameters at admission with cardiovascular mortality in the oldest old with acute myocardial infarction
Hui-Hui LIU,Meng ZHANG,Yuan-Lin GUO,Cheng-Gang ZHU,Na-Qiong WU,Ying GAO,Rui-Xia XU,Jie QIAN,Ke-Fei DOU,Jian-Jun LI
Cardiometabolic Center,State Key Laboratory of Cardiovascular Disease,Fuwai Hospital,National Center for Cardiovascular Diseases,National Clinical Research Center for Cardiovascular Diseases,Chinese Academy of Medical Sciences and Peking Union Medical College,Beijing,China
ABSTRACT OBJECTIVES Stress-related glycemic indicators,including admission blood glucose (ABG),stress-hyperglycemia ratio (SHR),and glycemic gap (GG),have been associated with worse outcomes after acute myocardial infarction (AMI).However,data regarding their prognostic value in the oldest old with AMI are unavailable.Therefore,this study aimed to investigate the association of stress-related glycemic indicators with short-and long-term cardiovascular mortality (CVM) in the oldest old (≥ 80 years)with AMI.METHODS In this prospective study,a total of 933 consecutive old patients with AMI admitted to FuWai hospital (Beijing,China) were enrolled.On admission,ABG,SHR,and GG were assessed and all participants were classified according to their quartiles.Kaplan-Meier,restricted cubic splines (RCS),and multivariate Cox regression analyses were performed to evaluate the association between these glycemic indicators and CVM within 30 days and long-term follow-up.RESULTS During an average of 1954 patient-years of follow-up,a total of 250 cardiovascular deaths were recorded.Kaplan-Meier analyses showed the lowest CVM in quartile 1 of ABG and in quartile 2 of SHR and GG.After adjusting for potential covariates,patients in quartile 4 of ABG,SHR,and GG had a respective 1.67-fold (95% CI: 1.03-2.69;P=0.036),1.80-fold (95% CI: 1.16-2.79;P=0.009),and 1.78-fold (95% CI: 1.14-2.79;P=0.011) higher risk of long-term CVM risk compared to those in the reference groups (quartile 1 of ABG and quartile 2 of SHR and GG).Furthermore,RCS suggested a J-shaped relationship of ABG and a Ushaped association of SHR and GG with long-term CVM.Additionally,we observed similar associations of these acute glycemic parameters with 30-day CVM.CONCLUSIONS Our data first indicated that SHR and GG consistently had a U-shaped association with both 30-day and longterm CVM among the oldest old with AMI,suggesting that they may be useful for risk stratification in this special population.
Nowadays,the aging population is increasing rapidly worldwide,while a higher proportion of elderly patients are expected to suffer from acute myocardial infarction(AMI).[1]AMI has become a most common cause of hospitalization in the elderly.Moreover,among patients with AMI,advanced age is a strong predictor of the risk of early and late death.[1]For example,the in-hospital mortality was 17% for those older than 85 years in the EuroHeart Survey,[2]and one-year allcause mortality was approximately 20% in patients over 75 years of age in the FAST-MI (French Registry of Acute ST-Elevation or Non-ST-elevation Myocardial Infarction) registry.[3]However,due to the characteristics of malnutrition,frailty,multiple comorbidities,and various oral medications,[4,5]elderly patients with AMI,especially those aged ≥ 80 years,are underrepresented in previous studies,[6]resulting in limited evidence on risk stratification and management in this special population.Therefore,the identification of simple and practical biomarkers to stratify and guide clinical strategy in the oldest old with AMI is of great significance.
Stress-induced hyperglycemia (SH) refers to the transient increase in blood glucose (BG) levels that occurs during an acute illness and has been suggested to be a powerful predictor of worse outcomes in patients with AMI.[7]Admission BG (ABG) has been clinically used as an index of SH.However,ABG levels are determined by both acute stress and chronic glycemic control,and a high value of it does not necessarily indicate an acute increase in BG levels in response to AMI.[8,9]Recently,the stress hyperglycemia ratio (SHR),which is calculated by dividing ABG by the estimated average glucose (eAG) derived from glycosylated hemoglobin (HbA1c),was recognized as a novel index of SH and had a better prognostic value than ABG in patients with AMI.[10-12]In addition,the glycemic gap (GG),defined as the difference between ABG and eAG,could also reflect SH and is associated with adverse outcomes in critically ill patients,[13]including those with AMI.[14]
The heterogeneity of patients with advanced age may influence both the baseline glucose metabolism and the acute response to stress.[15,16]Thus,the distinct spectra of glycemic status may alter the predictive value of the above glycemic parameters in this unique population after AMI.As such,in this study,we sought to investigate the short-and long-term prognostic significance of ABG,SHR,and GG in the oldest old (aged ≥ 80 years) with AMI,which has not been systematically evaluated before.
METHODS
Study Design and Population
This was a prospective observational cohort study at Fuwai Hospital,National Center for Cardiovascular Diseases.The study process was in accordance with the Declaration of Helsinki and was approved by the hospital’s ethics review board (Fuwai Hospital &National Center for Cardiovascular Diseases,Beijing,China).All participants provided their written informed consent prior to enrollment.
From January 2012 to August 2018,1288 patients aged ≥ 80 years,who were hospitalized at Fuwai Hospital (Beijing,China) for AMI,were consecutively evaluated.Patients who met the following criteria were excluded: (1) hospitalized for AMI over 24 h after the onset of symptoms,(2) prior history of MI,(3) missing crucial laboratory data,(4) serious infectious or systematic inflammatory disease,(5)severe hepatic or renal insufficiency,and (6) history of malignant disease.During the study,eight patients were lost to follow-up.Finally,933 patients aged ≥ 80 years with the first AMI were enrolled in the study (Figure 1).
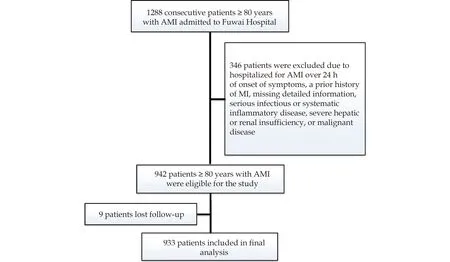
Figure 1 Flowchart illustrating the study population.AMI: acute myocardial infarction.
Data Collection and Definitions
Baseline information on demographics [age,sex,body mass index (BMI),and traditional cardiovascular risk factors] and clinical data (the main diagnosis on admission;baseline medication use;physical,laboratory,and imaging examination findings;and information on revascularization) were obtained from each patient.AMI was diagnosed according to the Third Universal Definition of Myocardial Infarction.[17]DM was defined if the participant had previously been diagnosed with diabetes,used hypoglycemic drugs or insulin,or had HbA1c > 6.5%.Hypertension was determined according to a previous diagnosis of hypertension or currently taking antihypertensive drugs.On admission,ABG levels were analyzed in a timely manner using the enzymatic hexokinase method and HbA1c value was measured with the Tosoh Automated Glycohemoglobin Analyzer (HLC-723G8,Tokyo,Japan).According to previous studies,eAG was calculated with the formula [(28.7 × HbA1c %) -46.7],[18]SHR was defined as ABG divided by eAG,[9]while GG was calculated by ABG minus eAG.[13,14]
Follow-up
All patients were followed up through outpatient visits and/or telephone calls by well-trained cardiologists/nurses at the first month and subsequently at six-month intervals after enrollment.The primary endpoint was defined as cardiovascular mortality (CVM) during long-term follow-up,indicating death caused by sudden cardiac death,AMI,HF,stroke,and other cardiovascular causes (malignant arrythmia,cardiovascular intervention,or pulmonary embolism),as well as deaths for which there was no clearly documented nonvascular cause.The secondary endpoints were defined as 30-day CVM and all-cause mortality (ACM).In-hospital CVM was identified directly through the abstraction of the medical record.Follow-up information was acquired from medical records or family members of patients who died after discharge.
Statistical Analysis
Categorical variables are presented as frequencies and proportions and compared between groups using χ2-test.Continuous variables are expressed as mean ± SD or median (interquartile range) and compared between groups using Student’s t-test or nonparametric test where appropriate.The log-rank test and Kaplan-Meier survival analyses were performed to explore differences in event-free survival rates among different groups.Restricted cubic spline(RCS) adjusted for age and sex was created to explore the characteristics of the correlation between glycemic parameters and the risk of CVM.Furthermore,multivariate Cox regression analyses were applied to identify the associations of glycemic parameters with CVM and calculate the corresponding hazard ratios (HRs) after adjustment for confounders,including age,sex,BMI,hypertension,DM,atrial fibrillation (AF),current smoking,post-AMI revascularization,heart rate,left ventricular ejection fraction,creatinine,low-density lipoprotein cholesterol,high-density lipoprotein cholesterol,triglyceride,baseline antiplatelet therapy,and baseline statin use.In addition,C-statistics were calculated to assess whether the addition of glycemic parameters to the original model could significantly improve its predictive ability.Two-tailedP-values < 0.05 were considered statistically significant in all analyses.SPSS version 24.0 software (SPSS Inc.,Chicago,IL,USA),STATA version 15.1 (StataCorp,College Station,TX,USA),and R language version 3.5.2(Feather Spray) were used to perform the statistical analyses and create the tables and figures.
RESULTS
Baseline Characteristics
The baseline characteristics of the entire population are shown in Table 1.The mean age was 82.9 ±2.9 years,560 (60.0%) patients were men,mean BMI was 23.81 ± 3.52,hypertensive patients represented 73.3%,366 (39.2%) patients were diagnosed with DM,373 (40.0%) patients were identified as current smokers,227 (24.3%) patients had a history of percutaneous coronary intervention (PCI) or coronary artery bypass grafting (CABG),and 439 (47.1%) subjects received revascularization therapy during hospitalization.
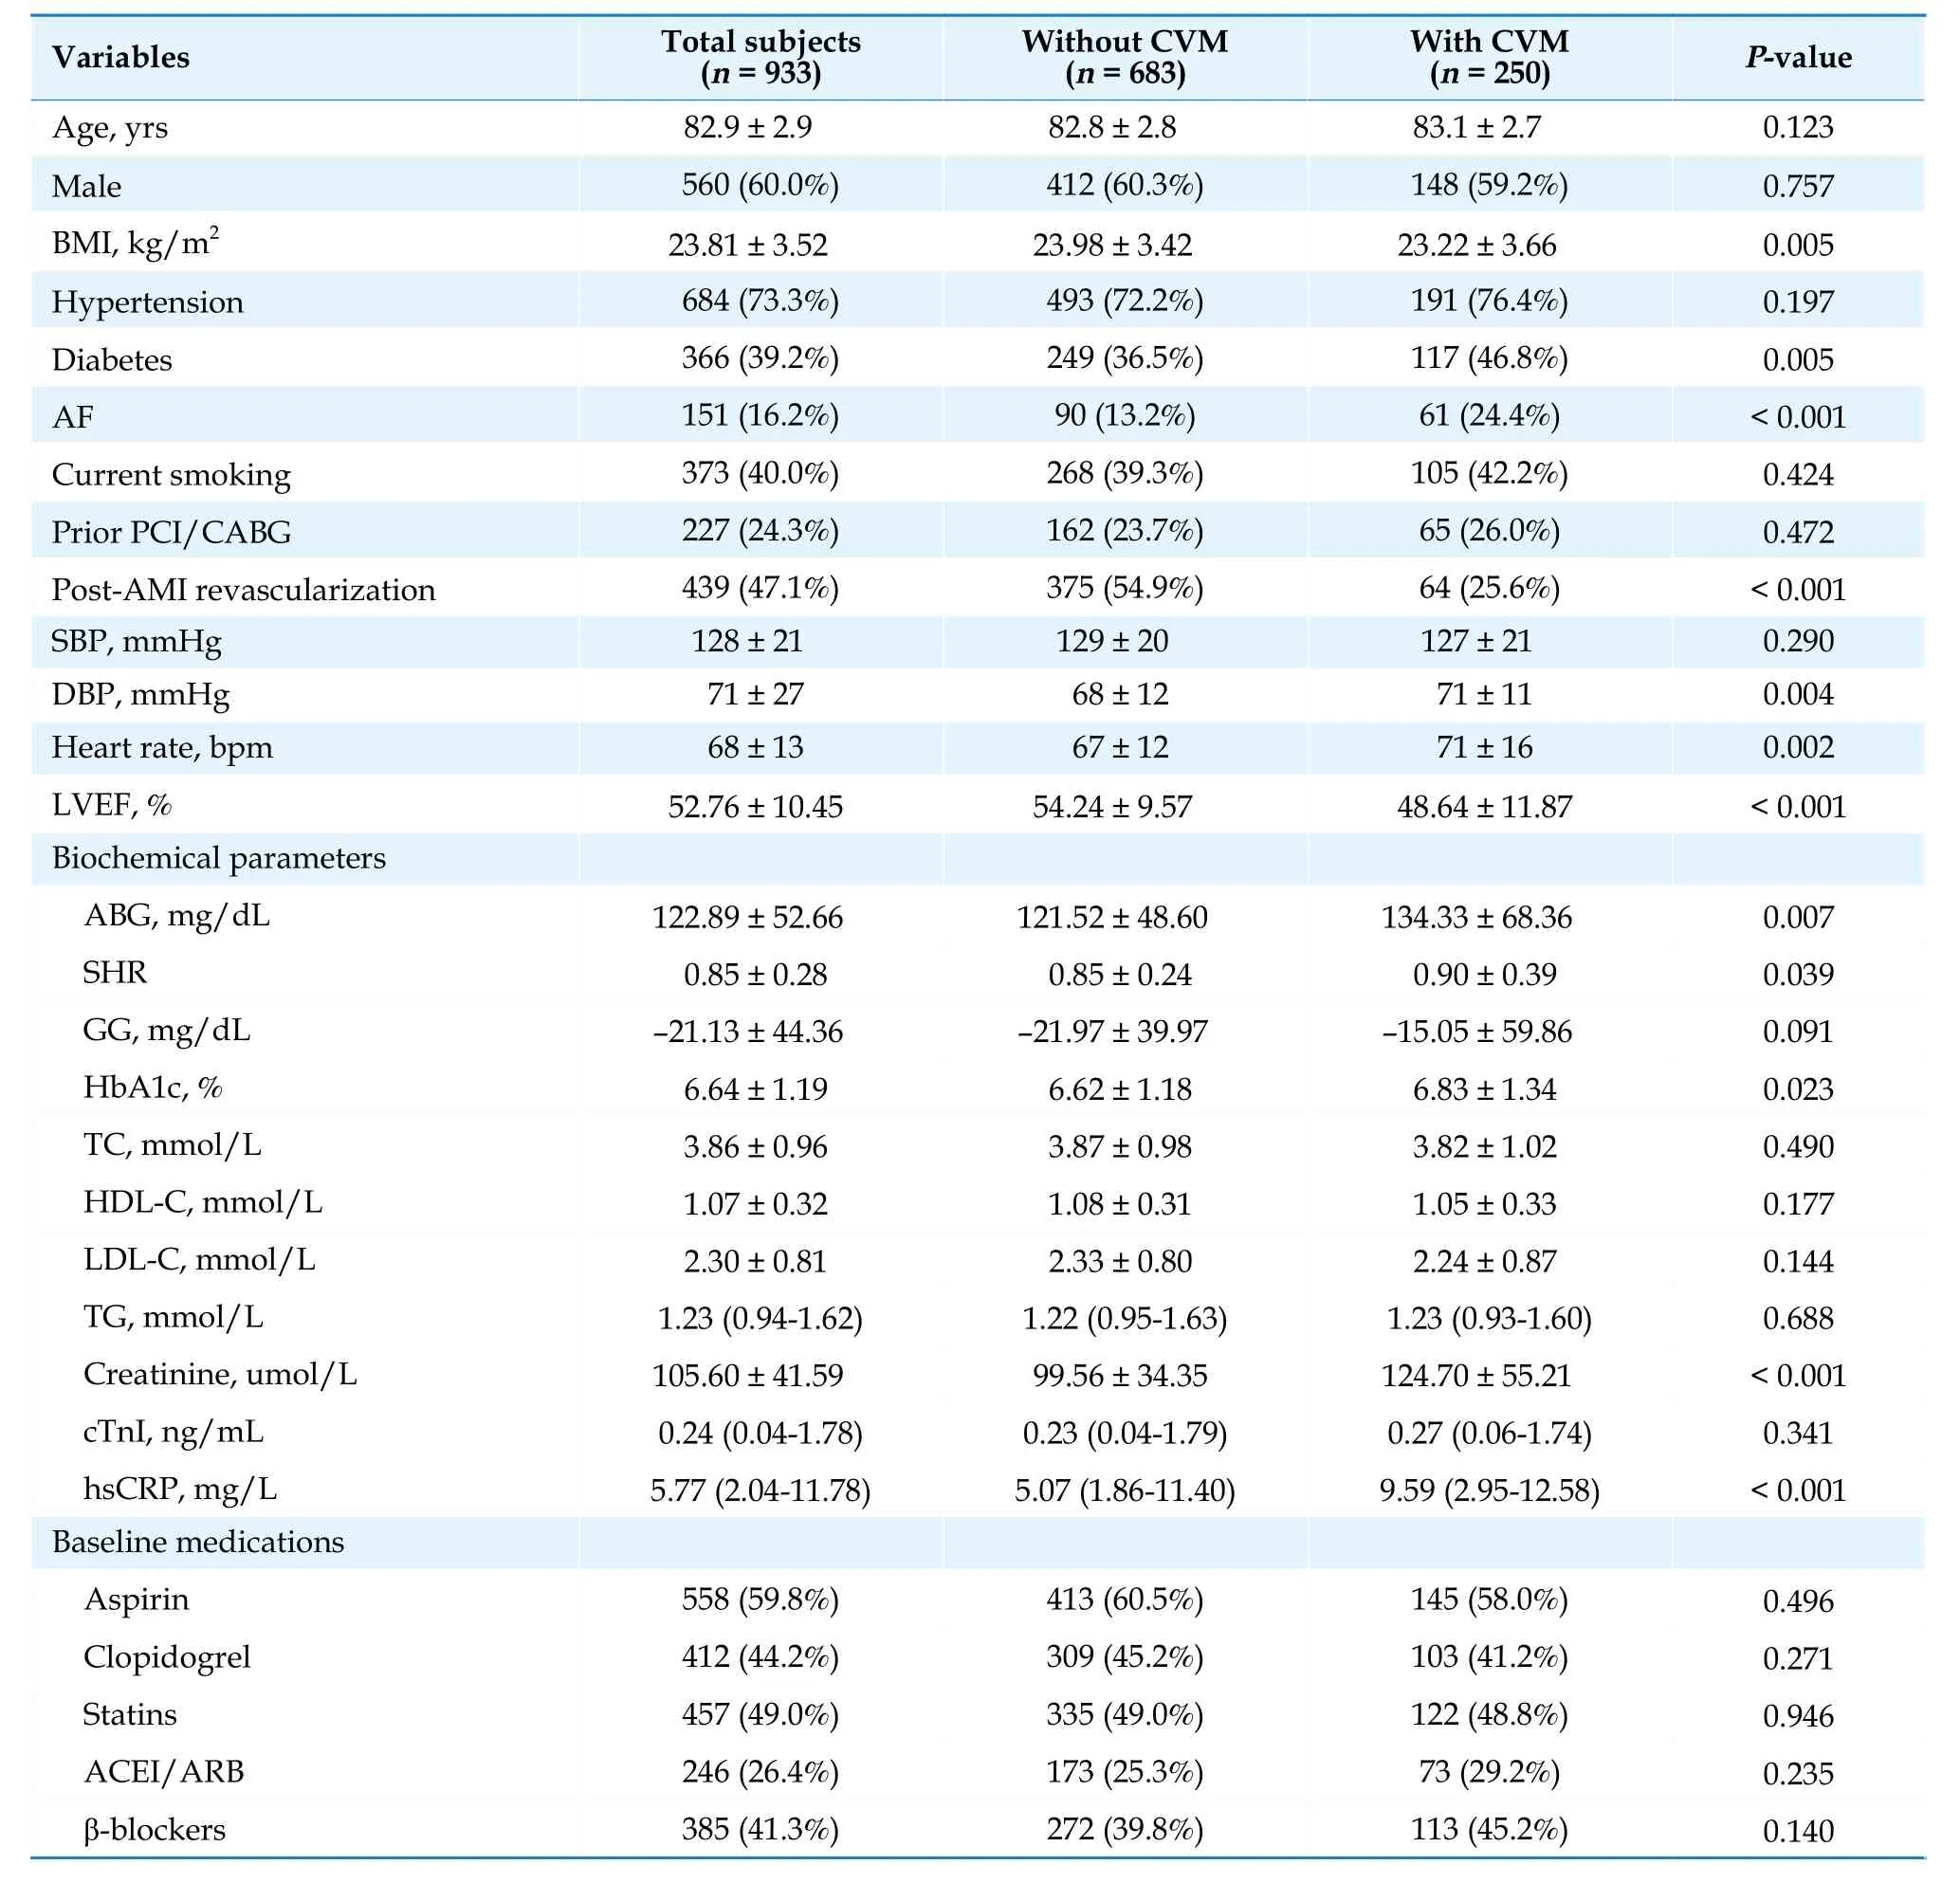
Table 1 Baseline characteristics of the participants with or without CVM.
Stress-related Glycemic Indicators and Long-Term CVM
Over an average of 1954 patient-years of followup [a median of 18.70 (8.95-34.73) months],280 allcause deaths were recorded.Thereinto,250 cardiovascular deaths (55 cardiovascular deaths occurred within 30 days and 37 cardiovascular deaths occurred during hospitalization).As presented in Table 1,patients with CVM had significantly higher levels of ABG,SHR,HbA1c,creatinine,high-sensitivity C-reactive protein,diastolic blood pressure,and heart rate,but lower levels of BMI and left ventricular ejection fraction (LVEF),compared to those in the group without event (allP< 0.05).Meanwhile,patients with CVM had a higher proportion of DM and AF and were less likely to receive revascularization after AMI compared to those without CVM (bothP< 0.05).In regards to the baseline medications,there was no significant difference between the two groups (allP> 0.05).
All patients were categorized according to the quartiles of ABG (< 91.26,91.26-104.75,104.76-138.73,≥ 138.74 mg/dL),SHR (< 0.71,0.71-0.78,0.79-0.91,≥ 0.92),and GG (< -41.23,-41.23 to-27.40,-27.41 to -11.08,≥ -11.09 mg/dL),respectively.The Kaplan-Meier survival analyses showed that patients in quartile 1 of ABG had the lowest risk of CVM and those in quartile 4 had the highest risk of CVM (bothP< 0.05;Figure 2A).However,when it comes to SHR and GG,patients in quartile 2 had the lowest risk of CVM and those in quartile 4 had the highest risk of CVM (bothP< 0.05;Figure 2 B-C).Further age-and sex-adjusted RCS analyses showed a J-shaped relationship between ABG and long-term CVM risk and a U-shaped association of SHR and GG with the risk of long-term CVM (allPfor nonlinearity < 0.001;Figure 3 A-C).The values of the ABG,SHR,and GG corresponding to the lowest risk of long-term CVM on RCS analyses were 104.76 mg/dL,0.80,and -27.00 mg/dL,respectively.After adjusting for the potential covariates,patients in quartile 4 of ABG,SHR,and GG had a respective 1.67-fold (95% CI: 1.03-2.69;P=0.036),1.80-fold (95% CI: 1.16-2.79;P=0.009),and 1.78-fold (95% CI: 1.14-2.79;P=0.011) higher risk of long-term CVM risk compared with those in the reference groups (quartile 1 of ABG and quartile 2 of SHR and GG),with the absolute risk increased 8.7,8.7,and 8.9 cardiovascular deaths per 100 person-years respectively.Moreover,the addition of ABG,SHR,and GG to the original model significantly increased the C-statistic by 0.026,0.026,and 0.027 respectively (allP< 0.05;Supplemental Table 1).Additionally,as shown in Supplemental Figure 1 and Supplemental Table 2,we observed similar associations of ABG,SHR,and GG quartiles with the risk of ACM.
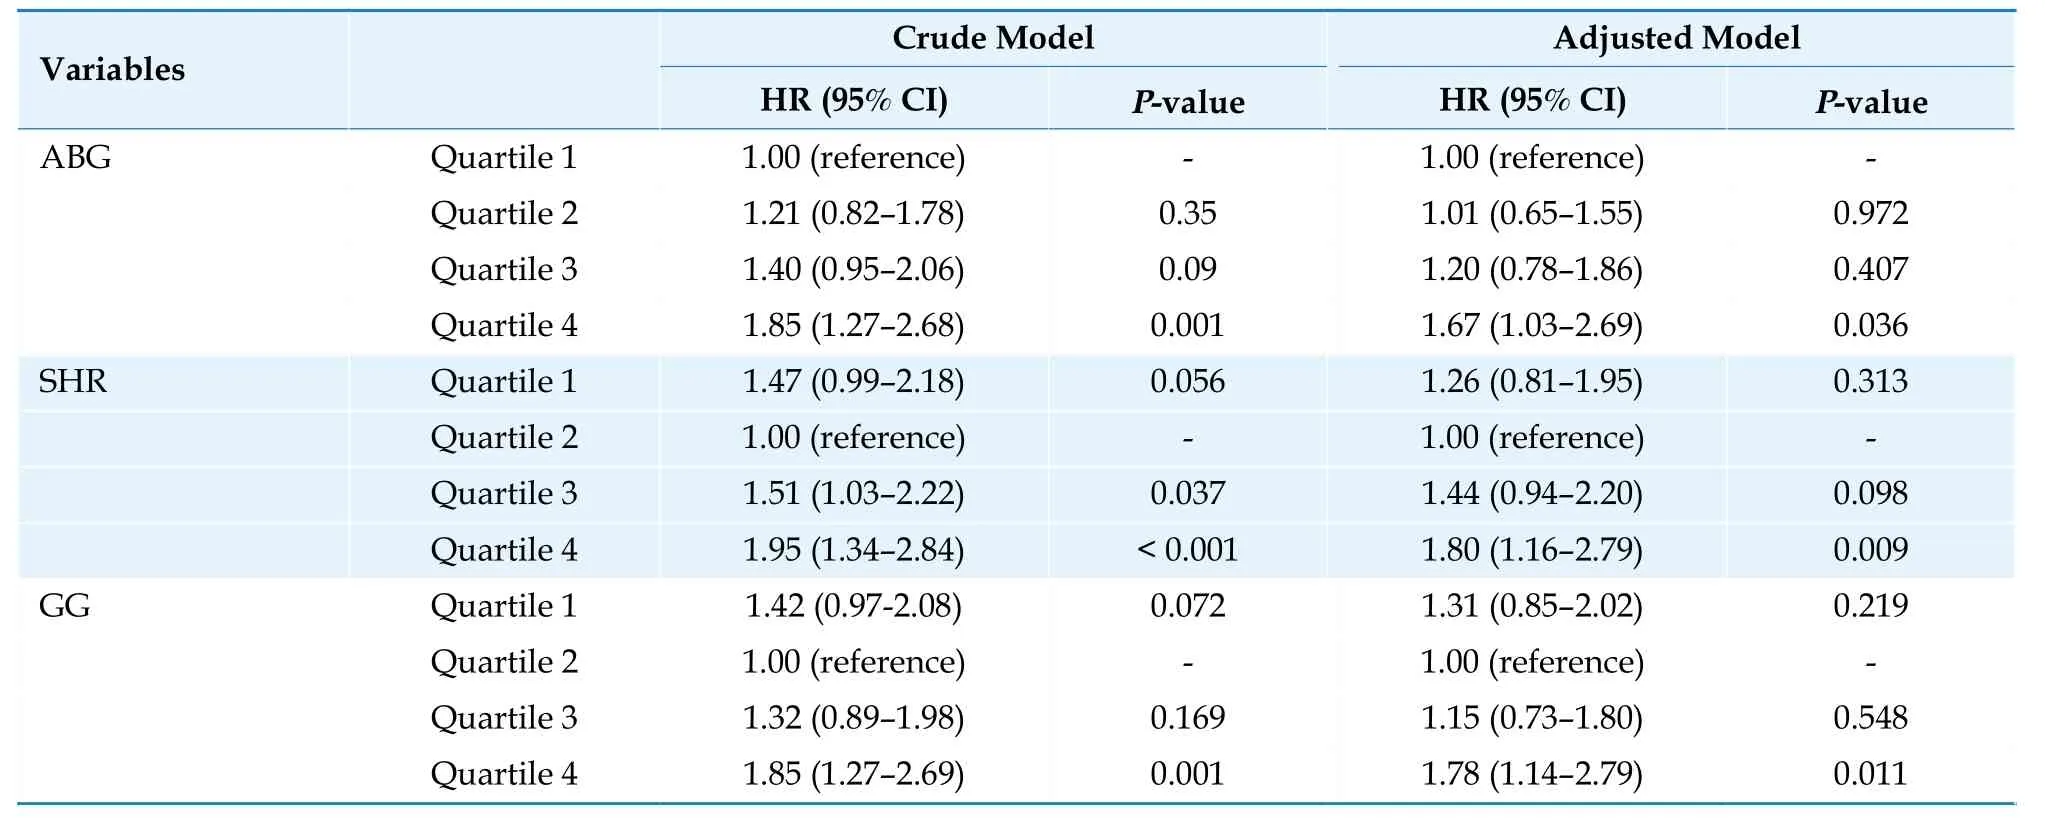
Table 2 Cox regression analyses of the association between stress-related glycemic indicators and long-term CVM.

Figure 2 Kaplan-Meier curves of long-term CVM stratified by the quartiles of stress-related glycemic indicators.(A): ABG and long-term CVM;(B): SHR and long-term CVM;(C): GG and long-term CVM.ABG: admission blood glucose;CVM: cardiovascular mortality;GG: glycemic gap;SHR: stress hyperglycemia ratio.
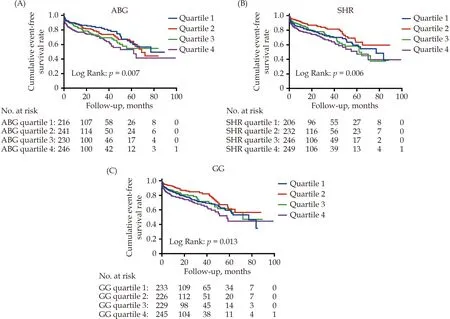
Figure 3 Age-and sex-adjusted RCS plot of the association between stress-related glycemic indicators and long-term CVM.(A):ABG and long-term CVM;(B): SHR and long-term CVM;(C): GG and long-term CVM.ABG: admission blood glucose;CVM: cardiovascular mortality;GG: glycemic gap;RCS: restricted cubic spline;SHR: stress hyperglycemia ratio.
Stress-related Glycemic Indicators and 30-day CVM
The Kaplan-Meier analyses showed that patients in quartile 2 and quartile 3 of ABG,SHR,and GG had similar and the lowest 30-day CVM risk respectively,while those in quartile 4 had the highest risk(allP< 0.05;Supplemental Figure 2 A-C).The ageand sex-adjusted RCS analysis suggested that the associations of these glycemic indicators with 30-day CVM risk were similar with their relationships with long-term CVM risk (Supplemental Figure 3).Multivariate Cox regression analyses showed that patients in quartile 4 of ABG,SHR,and GG had a respective 2.17-fold (95%CI: 1.01-4.66;P=0.047),3.07-fold (95%CI: 1.42-6.63;P=0.004),and 3.28-fold(95%CI: 1.48-7.23;P=0.003) increase in risk of 30-day CVM compared with those in the reference group (quartile 2+quartile 3;Supplemental Table 3).Furthermore,adding ABG,SHR,and GG to the original model had a nominal increase in the C-statistic of 0.018,0.030,and 0.029 respectively (Supplemental Table 4).
DISCUSSION
As the growth of an aging population and the high mortality of the elderly with AMI,the risk stratification and management of old patients with AMI have aroused great interest in the cardiovascular field.In this prospective cohort study,for the first time,we,comprehensively assessed the relationships between acute glycemic parameters and CVM risk in the oldest old with AMI.The main findings were: (1) SHR and GG were significant and independent predictors of both 30-day and long-term CVM risk in the oldest old with AMI,while ABG had a significant association with long-term CVM and a less significant relationship with 30-day CVM after adjusting for potential covariates.(2) RCS suggested a U-shaped association of SHR and GG and a J-shaped relationship of ABG with 30-day and long-term CVM risk.(3) Furthermore,the C-statistic analysis revealed that the addition of ABG,SHR,or GG to the original model could significantly improve the predictive capacity for CVM risk.Our data substantially expand current knowledge on the relationship between various metrics of acute glycemic status and the risk of CVM in the oldest old with AMI.
Currently,SH has been demonstrated to be strongly associated with adverse outcomes after AMI,[19-22]but the specific mechanisms underlying this association have not been fully understood.Evidence that lower levels of BG during the course of AMI could decrease mortality illustrates that SH is not just a component of the stress response.[23]The presence of SH has been suggested to be caused by a complex interaction of acute physiological responses,including detrimental adrenergic activation,insulin resistance,increased gluconeogenesis,and excessive counterregulatory hormones.[6,24]Moreover,SH could in turn lead to abnormal activation of the sympathetic nervous system,overdose release of catecholamine and cortisol,oxidative stress and inflammation,endothelial dysfunction,thrombosis,and ischemiareperfusion injury,all of which may result in further cardiac damage.[25-28]All these pathophysiologic changes constitute a vicious cycle and eventually contribute to adverse events in patients with AMI.
Previous studies have proposed many indexes to reflect the acute increase in BG during an acute illness,among which ABG,SHR,and GG are most commonly used in clinical practice.Some studies have shown that ABG was significantly associated with short-term and long-term prognoses in patients with AMI.[7,22,29,30]However,the real extent of SH cannot be accurately reflected by ABG value,which may also be influenced by chronic glucose levels.[6,31]SHR and GG,which are calculated by ABG adjusted for chronic glycemic status using HbA1c,may truly reflect acute hyperglycemic status.[13,31]There is growing evidence that SHR performs better than ABG in predicting a worse short-term prognosis after AMI.[10-12]In particular,recent studies suggested that SHR was also a strong predictor of late poor prognosis among patients with acute coronary syndrome or ST-segment elevation myocardial infarction (STEMI).[7,31]Although studies on the prognostic significance of GG in patients with AMI were scarce.[14]In the study by Liao,et al.,[14]among diabetic patients with AMI,elevated GG rather than acute hyperglycemia was significantly associated with a higher risk of in-hospital mortality and also showed superior discriminative ability for the early risk of major adverse cardiovascular events.
However,due to the underrepresentation of the very elderly in previous studies,the prognostic value of SH-related parameters in this unique population has been undetermined.Furthermore,common comorbidities,[4,5]such as frailty,malnutrition,and insulin resistance,in the elderly may affect baseline glycemic metabolism,as well as acute response to stress.[15,16]In addition,normal aging itself is associated with multiple endocrine changes,including a gradual sustained increase in glucocorticoid secretion.[32]Excess glucocorticoid levels can affect the normal response to stress in the elderly,bringing about an impaired ability to recover from stressful stimuli,and can also contribute to abnormal glucose metabolism.[32]In this study,most of the patients had acute ABG lower than the estimated average glucose (GG was negative),suggesting that they basically had no response to stress.All these characteristics in older patients may have an impact on the predictive value of SH in AMI,and the little available evidence regarding this association was inconsistent.For example,in the Cooperative Cardiovascular Project that included 141,680 patients with AMI over 65 years,ABG had a steep linear relationship with the 30-day and 1-year mortality risk in nondiabetic individuals.[33]Another study by Nicolauet al.showed that the predictive value of ABG was not significant in patients aged ≥ 80 years.[34]In a recently published study,SHR was suggested to have a nonlinear dose-response relationship with in-hospital adverse events in elderly patients with AMI.[6]In this study,we systematically investigated for the first time the short-term and long-term prognostic significance of multiple indicators of SH in the oldest old with AMI.We interestingly found that ABG,SHR,and GG were consistently associated with the risk of both 30-day and long-term CVM.Although the association of ABG with 30-day CVM was less significant compared to SHR and GG,which were in line with previous studies.[10-12,14]Moreover,the RCS showed a broad-based U-shaped association of SHR and GG with the risk of CVM and a J-shaped relationship between ABG and the risk of CVM.
The main strength of this study is the first comprehensive evaluation of the association between multiple stress-related glycemic indicators and CVM risk in the oldest old with AMI.However,this study also has several limitations.First,as an observational study in a single center,a causal association between SH indicators and CVM cannot be determined.Second,even though the major confounders were adjusted in the multivariate Cox model,there were possibly unmeasured or unknown residual confounding factors in our study that may explain the associations observed in this study.Finally,the sample size and follow-up time were relatively limited,and further studies with a larger sample size and longer follow-up are necessary to better describe and confirm our findings.
In summary,the present study,for the first time,indicated that SHR and GG had a significant U-shaped association and ABG had a significant J-shaped relationship with long-term CVM among the oldest old with AMI.Similar associations were observed between these acute glycemic indicators and the short-term risk of CVM.Our findings may provide more simple and practical tools for risk stratification and guidance of intensive intervention and monitoring in this unique population.
DISCLOSURE
Fundings
This work was supported by the Capital Health Development Fund [201614035],the CAMS Innovation Fund for Medical Sciences [2021-I2M-1-008],and the National High-level Hospital Clinical Research Funding [2023-GSP-RC-09;2023-GSP-QN-8].The sponsors had no role in study design,data collection and analysis,decision to publish,or manuscript preparation.
Conflicts of Interest
The authors declare that they have no competing interests.
Data Availability Statement
The data supporting the findings of this study are available from the corresponding author upon reasonable request,and the final decision to approve the request is at the discretion of the institute (Fuwai Hospital,Beijing) that holds the data.
Authors’ Contributions
H.H.L.designed the study,performed the statistical analyses,and drafted the original manuscript.M.Z.,Y.L.G.,C.G.Z.,N.Q.W.,Y.G.,R.X.X.,and J.Q.were in charge of data collection and interpretation and made critical revisions to the manuscript.K.F.D.and J.J.L.designed the study,supervised the conduction,and made critical revisions to the manuscript.All authors declare that they take responsibility for the content of the article.
Acknowledgments
The authors thank all the staff and participants of this study for their important contributions.
 Journal of Geriatric Cardiology2024年3期
- Journal of Geriatric Cardiology的其它文章
- Chinese Guidelines for the Diagnosis and Management of Atrial Fibrillation
- Health behavior outcomes in stroke survivors prescribed wearables for atrial fibrillation detection stratified by age
- Cardiovascular risk burden and disability: findings from the International Mobility in Aging Study (IMIAS)
- Effects of loneliness and isolation on cardiovascular diseases:a two sample Mendelian Randomization Study
- The diagnostic value of tenascin-C in acute aortic syndrome
- Sleep quality and characteristics of older adults with acute cardiovascular disease
