Existence of hidden attractors in nonlinear hydro-turbine governing systems and its stability analysis
Peng-Chong Zhao(趙鵬翀), Hao-Juan Wei(衛(wèi)皓娟), Zhen-Kun Xu(徐振坤),Di-Yi Chen(陳帝伊),?, Bei-Bei Xu(許貝貝), and Yu-Meng Wang(王雨萌)
1Key Laboratory of Agricultural Soil and Water Engineering in Arid and Semiarid Areas,Ministry of Education,Northwest Agriculture and Forestry University,Yangling 712100,China
2Institute of Water Resources and Hydropower Research,Northwest Agriculture and Forestry University,Yangling 712100,China
3Dongfang Electric Machinery Co Ltd,Deyang 618000,China
Keywords: nonlinear hydro-turbine governing systems,hidden attractors,basin of attraction,Lyapunov exponent spectrum
1.Introduction
The theoretical and experimental research activities on the hydro-turbine governing system (HTGS) have attracted wider attention from relevant communities since the chaos phenomenon for the HTGS was revealed.[1]As the core part of hydropower stations,the HTGS is a hydrodynamic,mechanical dynamic,and electrical dynamic system,[2,3]and its operation condition has a great influence on the stable operation of the power system.[4,5]Since China’s hydropower companies developed their business toward the high-capacity and highhead direction, many problems such as unstable vibrations including self-excited oscillations caused by water, machinery, electrical, and other factors have frequently occurred.[6]In fact, the flexible operation of hydropower station (e.g.,start-stop operations) as well as the adaptation to sharp load changes could lead these stations to act proactively for modulating the peak-frequency[7]in order to ensure safe and stable operation.[8]Moreover,there exists a complex nonlinear relationship among different components of the hydropower station, resulting in chaos.The classical Shilnikov’s theorem[9]deems that the chaotic system has at least one unstable equilibrium point.However, in recent years, many researchers have found a class of system that has only a stable equilibrium point,no equilibrium points,or an infinite number of equilibrium points where chaotic oscillations are still present,[10–13]for there exist hidden attractors in these systems.[14]The existence of hidden attractors increased the uncertainty of the system,so the system could suddenly switch to unexpected attractors under slight perturbations and such a transition could lead to disastrous consequences.[15,16]
An attractor is hidden if its basin of attractions does not intersect with a neighborhood of all equilibrium points(stationary points), otherwise, it is called a self-excited attractor.[17]In recent years, hidden attractors in continuous systems have been extensively studied.The chaotic system can exhibit three different families of hidden attractors: (i)the chaotic system with only one stable equilibrium point,(ii)the chaotic system without equilibrium point,and(iii)the chaotic system with infinite multiple equilibrium points.[18]A hidden attractor chaotic system with a stable equilibrium point was found by using a computer search algorithm in Ref.[19].Furthermore, the dynamic characteristics of the hidden-attractor chaotic systems were analyzed through Lyapunov exponent spectra,bifurcation diagrams,and attraction domains.A fourdimensional simplified Lorenz system with no equilibrium point was proposed in Ref.[20] which is capable of generating coexisting symmetric hidden attractors.Hidden attractors were found in a class of system with infinite multiple equilibrium points[21]where the sudden large vibration behaviors have also been analyzed and controlled.A high-dimensional system with hidden attractors was first studied in Ref.[22]and the dynamic behaviors of fractional-order hyperchaotic systems were then analyzed.Since hidden attractors cannot be found by the general numerical analysis method, the research and visualization of hidden attractors in the phase space may become challenging tasks.[23,24]Moreover, it increases the complexity and unpredictability of the dynamic behaviors of chaotic systems to some extent.Therefore,this study has an important theoretical research value for practical engineering applications.
The research on finding hidden attractors in nonlinear dynamical systems has attracted much attention due to its practical and theoretical importance.Some new examples of hidden attractors and numerical procedures for finding them as well as methods of controlling multi-stable systems were reviewed in Ref.[25].In addition to the above, the conjecture was that for a globally bounded autonomous system represented by ordinary differential equations with a unique equilibrium point, which is asymptotically stable, the subcritical Hopf bifurcation led to the birth of a hidden attractor.[17]In general, chaotic systems with multiple coexisting hidden attractors have been widely used in many fields ranging from the climate and ecosystems to financial markets and engineering applications.Here,the main purpose is to devise an approach for investigating hidden attractors in hydropower systems.The findings would allow one to study the mechanisms of hidden dynamics and the evolutions of their basins of attraction in high-dimensional hydropower systems.
Motivated by the above discussion, three main innovations are presented in this work to make the proposed approach more fascinating than previous researches.First, a saturated nonlinear turbine governing system model with a unique equilibrium point is proposed.Second, the concept of hidden attractors is introduced into the HTGS for the first time.The characteristics of equilibrium and basic dynamical properties of the system are then analyzed and the corresponding dynamic analyses are carried out.Third,a new method of drawing the basins of attraction, which is based on the Lyapunov exponent spectrum, is provided to analyze the hidden attractor.And the difference between this method and the traditional time-domain waveform observation method is analyzed.
The rest of this paper is organized as follows.First, the nonlinear model of the HTGS is developed in Section 2 and the dynamic properties of the system are then presented in Section 3.The existence and influence of hidden attractors are analyzed in Section 4,and the chaotic regions that are slightly different under the two methods of drawing the graph of the attraction domain are discussed in Section 5.Finally, in Section 6 are drawn some conclusions from the present findings in this work.
2.Nonlinear model of HTGS
The new mathematical model is developed based on the IEEE nonlinear turbine model which contains the pipe system,generator system, hydraulic servo system, output limiter, and governor system.[26]The detailed models for all these components within an HTGS are discussed in the following.
2.1.Pressure water diversion pipe model
The unsteady flow in the pressure penstock can be described through the following partial differential equations:
wherexis the penstock length[in unit m];vis pressure wave velocity[in unit m/s];tis the period[in unit s];fis the head loss coefficient in the penstock [pu];gis the acceleration of gravity (g=9.8 m2/s); [H],Q,DL, andAare the parameters of the penstock,which represent the pressure head(in unit m), flow rate (in unit m3/s), diameter (in unit m), and crosssectional area(in unit m2),respectively.
Owing to the penstock being much longer than the tail conduit,it can be assumed to be an ideal model by neglecting the hydraulic friction loss of the tail conduit which is insignificant to the experimental results.The upstream inlet section and downstream exit section are represented by A and B, respectively.Using Eqs.(1)and(2)for section A and section B,the following equation is obtained:[27]
Considering that the upstream pipline is connected with the reservoir,it can be assumed that the water level is constant in the transition process andHB(s)=0.The function in Eq.(3)can be simplified into
For clarity and simplicity,all head losses can be put aside.The flow equations can be written as
wherehw=vQ0/2gAH0is the water pipe characteristic coefficient.Substituting Eqs.(5) and (6) into Eq.(4), transfer functionGh(s)can be obtained and given below:
whereTr=2x/vis the phase length.Through the Taylor expansion,equation(7)can be rewritten as
where the value of indexiis important to accurately describe the model of the water hammer in different conditions.The researchers studied the above transfer function,which can appropriately simulate the elastic water hammer model fori ≥1.Fori=1,the transfer function in Eq.(8)can be written as[28]
Using the transfer function in Eq.(9),differential equation of the pressure water diversion pipe model can be obtained as follows:
For convenience, the form of the state-space equations for Eq.(10)can be rewritten as[29]
2.2.Generator model
It is well known that the generator plays an important role in the power system.Here,the first-order mathematical model is discussed as follows:
whereTa,Tb,mg0, andmtare the inertia time constant of the hydro generator, load rotational part of inertia time constant,active moment of the turbine, and disturbing moment of the turbine,respectively.Obviously,it is known that
wherePis the mechanical power of the turbine.Moreover,from Fig.1,one can write it as[26]
whereAt,D,Δω,andqnlare the scaling factor,velocity deviation damping coefficient, relative deviation value of the unit speed,and relative value of the no-load flow,respectively.
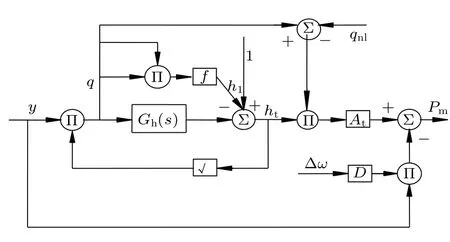
Fig.1.Hydraulic-machinery dynamic model of HTGS.
2.3.Dynamic model of hydraulic servo system
The dynamic characteristics of the hydraulic servo model can be represented as
whereTd,u, andy0are the reaction time constant of the servomotor,regulator output,,and initial guide vane opening,respectively.
2.4.Output limiter model
The diagram for the mathematical model of the output limiter model is shown in Fig.2(a).In this work, the hyperbolic sine function is substituted for the output limiter model for avoiding the computational complexities.The hyperbolic tangent function is described in Fig.2(b),wherezis assumed to be the input function,anduthe output function.Hence,the complete equations can be obtained as follows:
wherekp,ki, andkdrepresent the proportional, integral, and differential adjustment coefficient, respectively, andris the input signal.
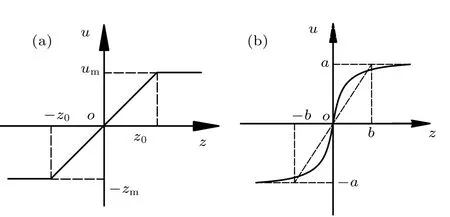
Fig.2.Diagram of output saturation link.(a)Output limiting link.(b)Hyperbolic tangent function.
From Eq.(1)to Eq.(16),the overall model of the HTGS can be written as
This model is used to analyze the dynamic properties of the system as shown in the following section.
3.Dynamic properties of system
3.1.Double-parameter symmetric chaos invariance
By observing the effects of parameters on the dynamic behaviors of the system,it can be found that the relation existing in the sixth subequation of Eq.(17)can be rewritten as
under the parameter transformation (a,b)→(-a,-b).If other parameters are fixed, the differential equation (17) representing the dynamics remains unchanged,thus,the resulting chaos is invariant.Here,aandbare the symmetric double parameters.
This parameter transformation describes that, under the condition of other parameters unchanged and initial conditions, two groups of parametersaandbgenerate identical chaotic attractors after taking the opposite number at the same time,thus,exerting no effect on the dynamic behaviors of the hydro-turbine regulating system.
3.2.Characteristic analysis of equilibrium point
If the right-hand side of Eq.(17) is set to 0, the equilibrium equation of the system can be obtained as follows:
Other parameters of the system are set tof= 0.06,Tr=2.178,At=1.3638,qnl=0.1607,D=0.5,r=0.05325,mg0= 0.96,ki= 0.8,a= 0.02, andb= 0.02.By solving Eq.(19), it can be obtained that the system only has an equilibrium point S(4.664,0,0.9219,0.05325,-0.0209,0.9463).By linearizing the equation system at this equilibrium point,the characteristic equation of the Jacobian matrix in Eq.(17)can be written as
According to the Routh–Hurwitz criterion, if the root of the characteristic equation (20) has a negative real part, then the equilibrium point S of system equation(17)is asymptotically stable.
3.3.Dissipation of system
Conservative systems have no attractors because the phase volume never changes.While in a dissipative system,all system trajectories will eventually be confined to a zerovolume set in which the progressive movement is fixed to an attractor.[28]A strange attractor P is said to exist in a dissipative system when the set P has a non-integer dimension.The sum of the Lyapunov exponents is usually negative for a dissipative system (as considered in Ref.[30]).Considering the system equation(17),one can obtain
The dissipative properties of the system are not unchanged but change with state variables.The relative values of the flow and guide blade opening meetx3>0,y >0 for which divV <0.Therefore,it can be concluded that the chaos produced by the system is indeed a dissipative chaos.All system trajectories will eventually be fixed to a single attractor,which further shows the existence of system attractors.
4.Numerical calculations and simulations
This section aims to provide the relevant calculations and simulation results as discussed in the following subsections.
4.1.Dynamic behavior analysis of the system
In this subsection, the bifurcation diagram is used to analyze the dynamics of the system, where governor parameterkpis used as the bifurcation parameter.The Lyapunov exponent spectra,Lyapunov dimensions,phase trajectory,and time waveforms are used to analyze the dynamic behaviors of the system.
The variations of the stability and dynamics of the system with different values of governor parameterkpare simulated.The remaining parameters are selected as follows:hw=0.64,Ta=5.4,kd=1.1,andy0=0.96.Initial values are considered as(4.728, 0, 0, 0.9345, 0, 0, 0.96)and the simulation time is 400 s.
The value of bifurcation parameterkpincreases from 5 to 15 to explore the dynamical behaviors of the system.The bifurcation diagram is plotted in Fig.3(a) according to the fourth-order Runge–Kutta method.[31]By utilizing the Wolf algorithm,[32]the Lyapunov exponent spectrum is depicted in Fig.3(b)which is generally consistent with the bifurcation diagram.Whenkpis between 11 and 12, the Lyapunov exponent spectrum does not correspond to the bifurcation diagram,which means that it may be caused by the complex dynamic behaviors,so it is necessary to carry out a further research.
Figure 3(a)shows the bifurcation diagrams of the relative speed varying with parameter.As demonstrated in Fig.3(a),the system with 5.3<kp<7.35 is in the stable period-1 oscillation.Whenkpis 7.35, the stable period-1 orbit becomes unstable,resulting in the stable period-2 oscillation.With the increase of parameterkp, the stable period-2 oscillation becomes unstable,and whenkpis 8.87,the stable period-4 oscillation takes place.When the value ofkpreaches 9.11,the stable period-4 oscillation changes to the chaotic oscillation.As can be seen,the chaotic oscillation is caused by the cascading of the period-doubling bifurcation.It is also observed that the two periodic windows appear with the increase of parameterkp.Whenkpis 10.61,the chaotic oscillation disappears,with the period-1 oscillation emerging.At the same time, a small jump occurs, which can also be found from Fig.3(a).If it is seen in the other way round, one can clearly find that a Hopf bifurcation appears with the decrease ofkp.Whenkpis equal to 12.23, the stable period-1 orbit becomes unstable via the stable period-2 oscillation and a new orbit appears.
In addition,whenkp=10,it can be found from Fig.3(b)thatLE1=0.0340,LE2=-0.00679,LE3=-0.0838,LE4=-0.826,LE5=-1.825,andLE6=-6.156,whereLE1,LE2,LE3,LE4,LE5, andLE6are six Lyapunov exponents of the system.
To gain a better insight into the chaotic feature of the system,we introduce Lyapunov dimension,a characteristic quantity which characterize the dynamic characteristics of the system and is defined as[33]

According to the above calculation, it can be seen that there is only one Lyapunov exponentLE1greater than 0, the sum of Lyapunov exponents is less than 0, the Lyapunov dimension of the system is greater than 2 and it is a fraction,which indicate that the system is in a chaotic state.[34]
To demonstrate this phenomenon more clearly,some typical phase portraits in thex–x2–uplane are illustrated in Fig.4.
By varying parameterkpand selecting initial conditionsx1(0) andy(0) in the range of (-5, 5), one can obtain the basins of attraction of the system as shown in Fig.5.
With the change of parameterkp, the topological structure of the motion trajectory of the system undergoes different changes.The multi-stable characteristics of the system dependent parameterkpare shown in Fig.5.Regions with different colors represent the initial conditions for those systems to achieve different dynamic behaviors, i.e., the domains of attraction corresponding to different attractors are divided into five colors, and the relationship between the dynamic behaviors of the corresponding system is shown in Table 1.The change of the red or orange region represents the change of the attraction domain of chaotic attractors under differentkpparameters.Besides, some regions are indistinguishable owing to the coexistence of many different trajectories.From these sub-graphs, one can see that Figs.5(a) and 5(c) show a narrow strip while figure 5(b) shows a riddled basin.Also,all dynamic modes(equilibrium point,limit cycle,and chaotic attractor)coexist under different initial conditions.

Fig.3.Dynamic behaviors of HTGS.(a) Bifurcation diagram of the HTGS.(b)Lyapunov exponents of the HTGS.

Fig.4.Attractors of the system with different values of kp: (a)kp=7,period-1 attractor;(b)kp=10,chaotic attractor;(c)kp=14,period-2 attractor.
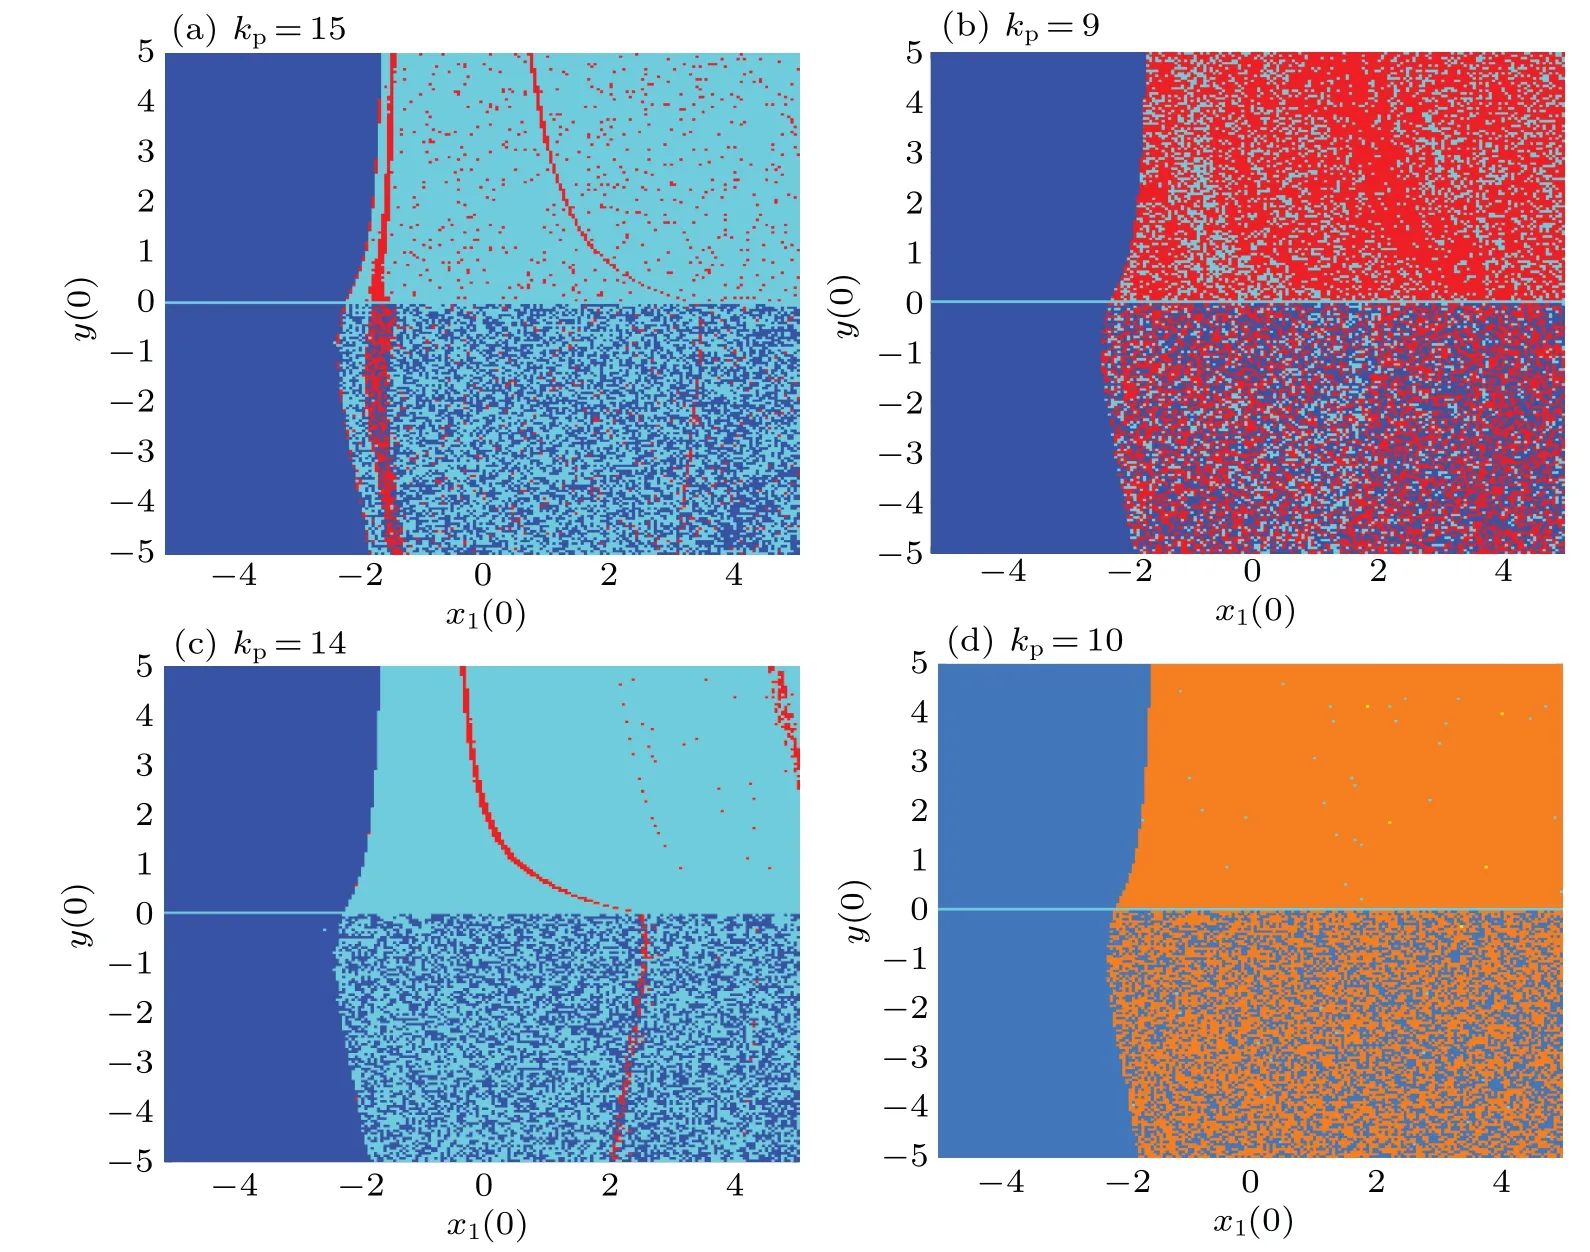
Fig.5.Local basins of attraction with initial values bing x1(0)and y(0)in the range of(-5,5),x2(0)=10-6,x3(0)=0.9345,x(0)=0.05325,u(0)=10-6,y(0)and different values of kp.

Table 1.System dynamic behaviors corresponding to different colors of the attracting basin.
The size of the attraction domain of the chaotic attractor also varies with parameterkp.The red areas represent the initial conditions for those systems to reach a chaotic state.These red regions are embedded in many blue regions,which means that the trajectories initialized from these regions has experienced a long transient chaotic process.This kind of phenomenon is not uncommon.
4.2.Presence of hidden attractor and its influence on dynamical system
The parameter switching (PS) algorithm[35–37]is a possible way to determine the location of hidden attractors.When other parameters are kept unchanged and the parameterkpis set to 5.3, the corresponding roots of the characteristic equation can be obtained to beλ1=-4.76,λ2=-1.8325+1.8641i,λ3=-1.8325-1.8641i,λ4=-0.1776,λ5=-0.0051+0.7563i,andλ6=-0.0051-0.7563i.
The HTGS has only one equilibrium point at S, i.e.(4.664, 0, 0.9219, 0.05325,-0.0209, 0.9463).The eigenvalues of the governing system by varying the parameterkpand keeping other parameters fixed are shown in Fig.6 from which it can be seen that the negative real parts of all eigenvalues of the system are approximately 5<kp<5.3.According to Subsection 3.2,the root of the characteristic equation of the Jacobi matrix has a negative real part,which indicates the equilibrium point S of the system is asymptotically stable.Thus,according to the concept of hidden attractor,[38–40]it is possible to have hidden chaotic attractors in the HTGS.
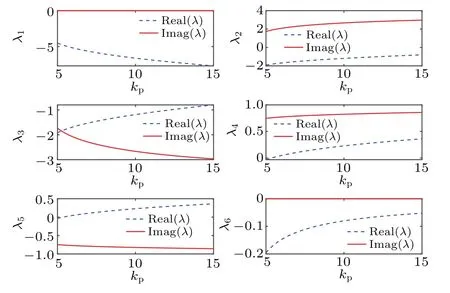
Fig.6.Variations of eigenvalues of HTGS with parameter kp.
Since the hidden chaos is defined by the domain of attraction,the properties of this hidden chaos set can be studied by using the graph withkp=5.3 and different initial conditions as shown in Fig.7.From Fig.7,the relation can be seen between the dynamical behaviors of the corresponding system whose attraction domains are divided into five colors as shown in Table 1.The red areas represent the initial conditions for those systems to reach a chaotic state.The number of dots in the transient chaos depends on the length of the simulation time.The longer the simulation time,the more dots in the transient chaos appear in the chaos basin.If the time is long enough,however,all the chaotic basins of attraction will disappear.
Remark Through a large number of simulations, it is found that all chaotic attractors in the system are transient.Therefore,all chaotic attractors are hidden and transient.Even if the system has the hidden transient chaos, it still operates chaotically for quite a long time.Therefore, once chaos appears,it will be very harmful to HTGS.The longer the chaos exists,the worse the stability of the system is and there will be more difficulties in controlling the system.[41]
Figure 7(a) describes the domain of attraction when the initial conditionsx1(0) andy(0) vary within (-10, 10), the red star“*”in Fig.7(a)represents the equilibrium point S,and the attraction domain of the chaotic attractor does not intersect with the neighborhood of the equilibrium point,indicating that there is a hidden attractor in the system.Similarly,the attraction domain is obtained under the initial value planesx1(0)–u(0),x2(0)–u(0),andx2(0)–x(0)as shown in Figs.7(b)–7(d),respectively.Thus, the motion trajectory depends on the initial conditions of the system.By comparing Fig.7(a) with Fig.7(b), the domains of attraction of hidden chaotic attractors and those of hidden periodic attractors change from the riddled domain with approximately vertical shape to the fractal domain with the sloping shape.A comparison among Figs.7(b)–7(d) shows that the domains of attraction of hidden chaotic attractors and those of hidden periodic attractors change from slope shape to horizontal ’M’ shape and then change into horizontal line shape.From the sub-graphs of four different initial value planes in Fig.7,it can be seen that there is no intersection between the set of initial conditions of hidden chaos and the equilibrium point.When the parameterkp=5.3,different dynamic behaviors such as chaos,periodic limit cycle, and quasi-periodic limit cycle appear owing to different initial conditions in the system’s operational trajectory.Moreover, it can be seen from these figures that both hidden periodic attractor and chaotic attractor have smaller attractive domains while both have banded structures and are interweaved with each other.This means that any slight change in the initial value can lead to a state transition behavior.In addition,the points under the initial condition of(4,0,0.9345,0.05325,-4.8,0.96)selected from Fig.7(b)constitute chaotic attractor phase diagrams as shown in Fig.8.
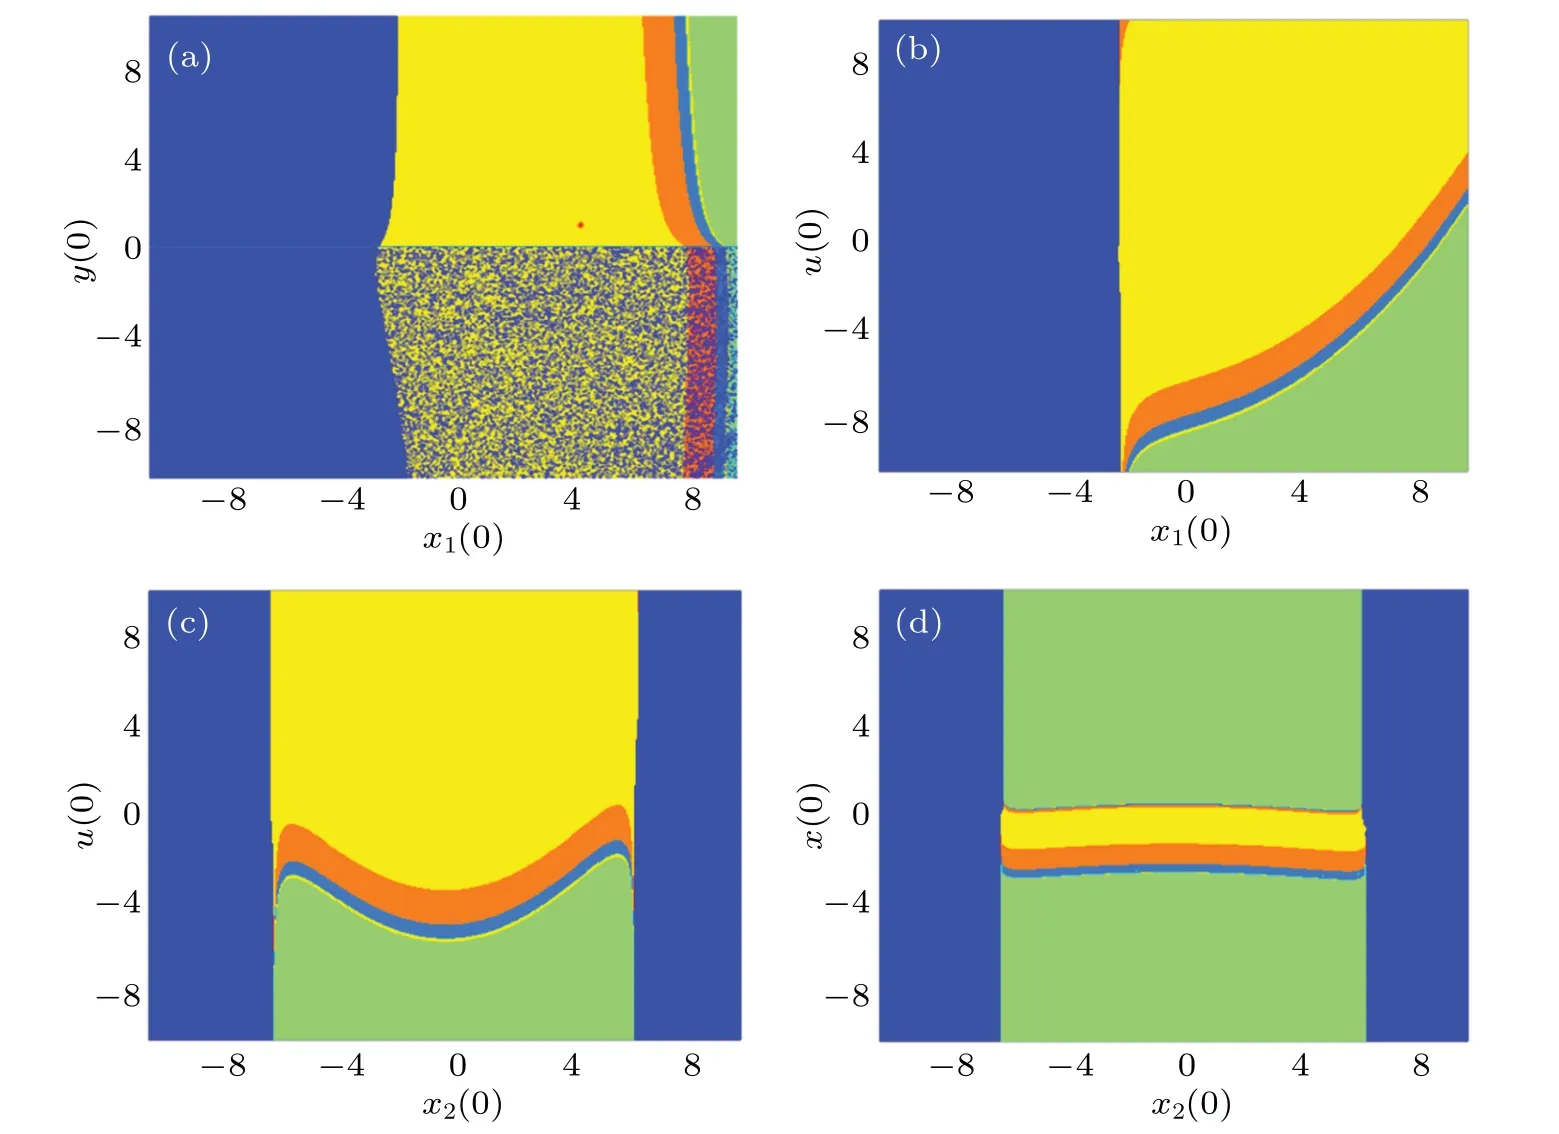
Fig.7.Local basins of attraction with different initial values when kp=5.3:(a)initial conditions x1(0)and y(0)in the range of(-10,10),x2(0)=10-6,x3(0)=0.9345,x(0)=0.05325,u(0)=10-6,and y(0);(b)initial conditions x1(0)and y(0)in the range of(-10,10),x2(0)=10-6,x3(0)=0.9345,x(0)=0.05325,u(0)=10-6,and y(0);(c)initial conditions x2(0)and u(0)in the range of(-10,10),x1(0)=4.728,x3(0)=0.9345,x(0)=0.05325,and y(0)=0.96;(d)initial conditions x2(0)and x(0)in the range of(-10,10),x1(0)=4.728,x3(0)=0.9345,u(0)=10-6,and y(0)=0.96.

Fig.8.Chaotic attractor phase diagrams in x–x2 (a),x2–x3 (b),and x–x2–u planes(c).
5.Discussion
The results of the above-mentioned basins of attraction between the local stability of equilibrium and the complex dynamic behaviors of the system are subtle.A time-domain waveform observation method[42]is adopted for attraction domains as mentioned above.Here,parameters are set tokp=7 andkp= 5.3 while all other parameters remain unchanged.Three initial conditions are selected as (u(0) andy(0) in the range of(-5,5),x1(0)=4.728,x2(0)=10-6,x3(0)=0.9345,andx(0)=0.05325),(x2(0)andu(0)in the range of(-6,6),x1(0)=4.728,x3(0)=0.9345,x(0)=0.05325,y(0)=0.96),and(x1(0)andu(0)in the range of(-10, 10),x2(0)=10-6,x3(0)=0.9345,x(0)=0.05325,u(0)=10-6).
According to the Lyapunov exponent spectrum, the corresponding relationship of dynamical motions as shown in Table 2 can be applied to numerical simulations to get another attraction domain as shown in Figs.9(b),9(d),and 9(f).Then,one can keep the same conditions and choose another method called the time-domain waveform observation method,so as to be able to obtain the attraction domain as shown in Figs.9(a),9(c),and 9(e).Herein,the orange color represents the system state of chaos.In Fig.9(b),the hybrid orange and blue area is obtained,and this figure only identifies many periodic motions and a few points of chaotic areas.

Table 2.Lyapunov exponent spectrum corresponding to system dynamic behaviors.
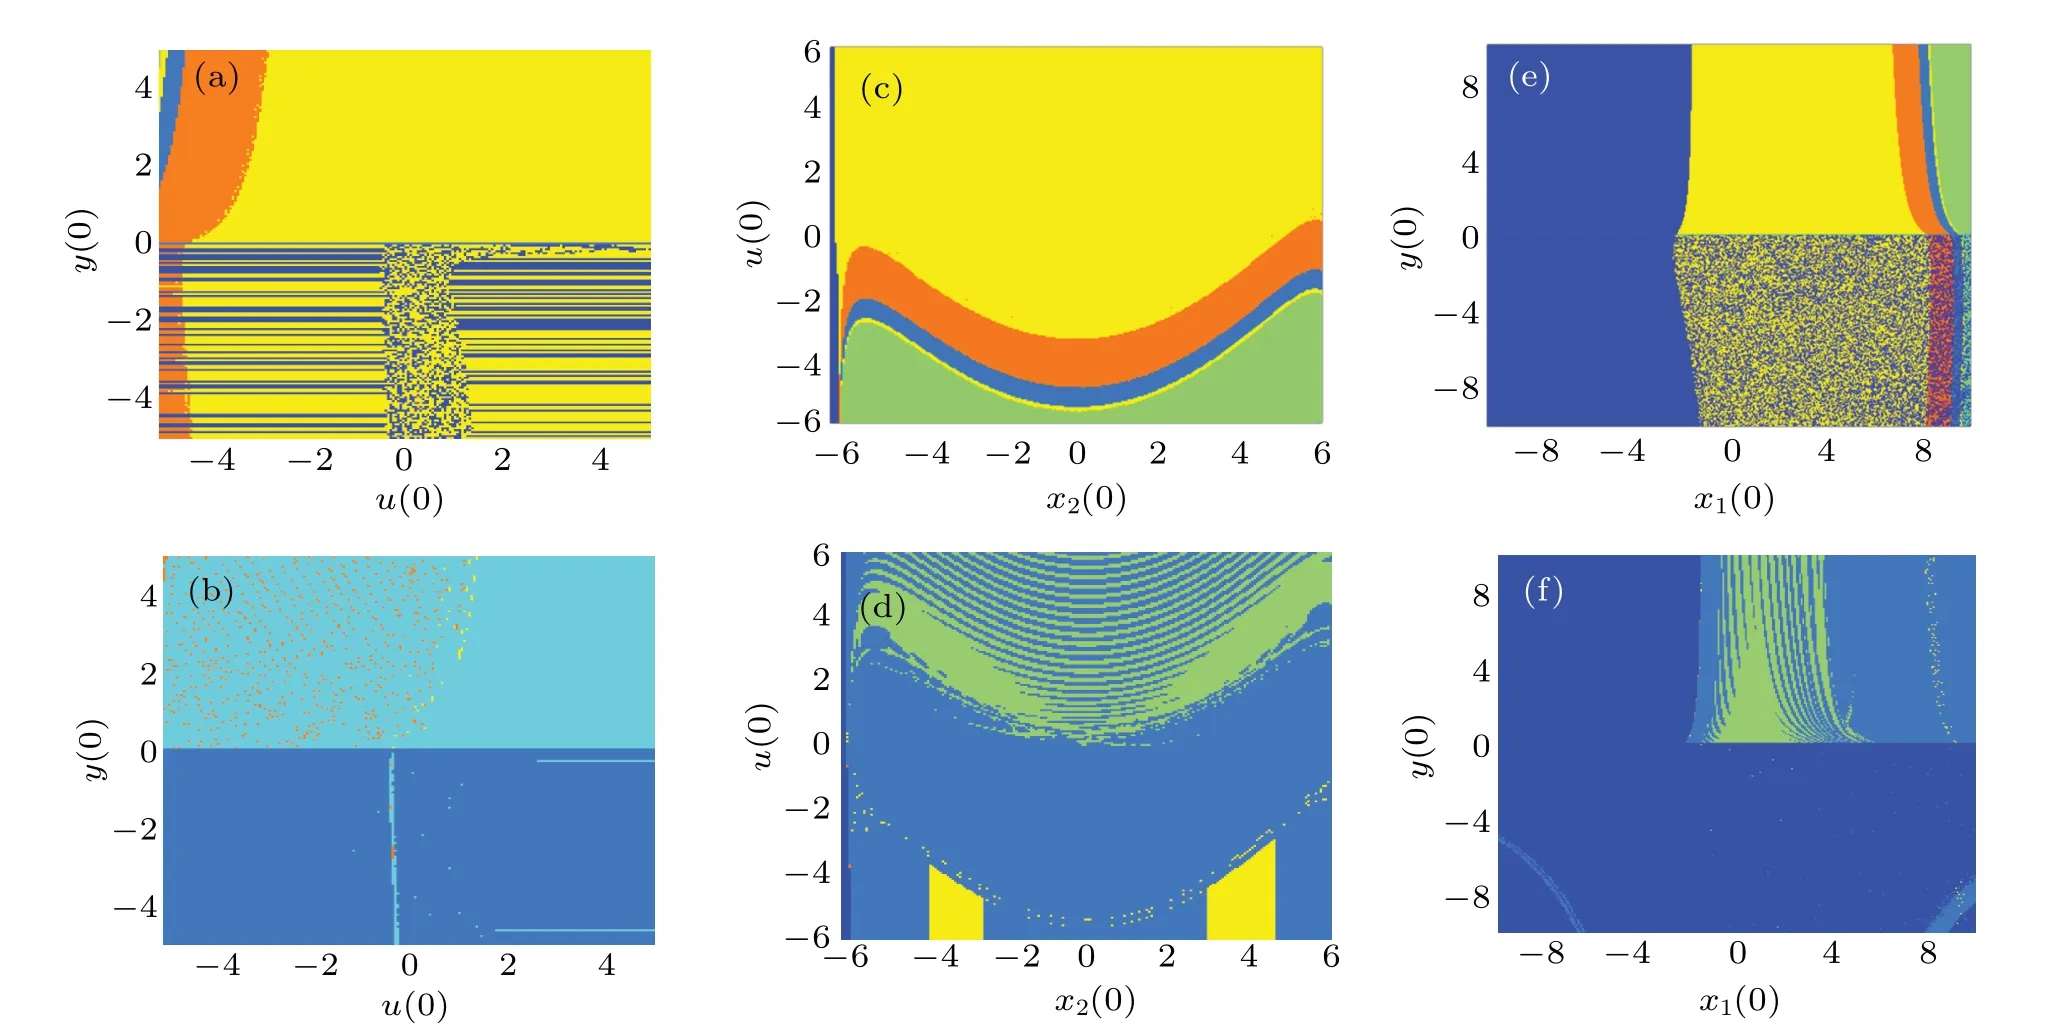
Fig.9.Basins of attraction obtained by ((a), (c), and (e)) time-domain waveform observation method, and ((b), (d), and (f)) Lyapunov exponent spectrum method, with different values of kp and initial conditions: (a) kp = 7 and initial conditions u(0) and y(0) in the range of (-5, 5),x1(0) = 4.728, x2(0) = 10-6, x3(0) = 0.9345, and x(0) = 0.05325; (b) kp = 7 and initial conditions u(0) and y(0) in the range of (-5, 5),x1(0)=4.728, x2(0)=10-6, x3(0)=0.9345, and x(0)=0.05325; (c) kp =5.3 and initial conditions x2(0) and u(0) in the range of (-6, 6),x1(0)=4.728, x3(0)=0.9345, x(0)=0.05325, and y(0)=0.96; (d) kp =5.3 and initial conditions x2(0) and u(0) in the range of (-6, 6),x1(0)=4.728, x3(0)=0.9345, x(0)=0.05325, and y(0)=0.96; (e) kp =5.3 and initial conditions x1(0) and u(0) in the range of (-10, 10),x2(0)=10-6, x3(0)=0.9345, x(0)=0.05325, and u(0)=10-6; (f) kp =5.3 and initial conditions x1(0) and u(0) in the range of (-10, 10),x2(0)=10-6,x3(0)=0.9345,x(0)=0.05325,and u(0)=10-6.
By comparing the two methods,some conclusions are obtained.First,owing to the inherent precision of numerical simulation in computing,both methods yield results with some degree of error.However,finer mesh divisions will often produce more accurate results.Second,strictly speaking,although the Lyapunov exponent spectrum method is widely used to determine chaotic motion, sometimes the calculation errors are still existent, such as the sign reversal which is produced by the Perron effect.Because the Lyapunov exponent spectrum method can only be calculated in a finite time, further research is needed to verify its accuracy.However, the timedomain waveform observation method can reflect the convergence characteristics of the system state variables, as well as dynamics information such as stability and oscillation amplitude more intuitively.
6.Conclusions
The mathematical model of the saturated nonlinear turbine governing system is developed in this work.The equilibrium point of the system is calculated and the stability of the equilibrium point is judged by analyzing the roots of the characteristic equation of the Jacobian matrix at the equilibrium point.The bifurcation diagram,Lyapunov exponent spectrum diagram, Lyapunov dimension, time-domain diagram, phase trajectory diagram, and attractor domain method are used to analyze the dynamic behavior of the system with the change of parameters and initial values and the existence and stability of hidden attractors.The chaos generated by the system with a unique stable equilibrium point is found to be hidden chaos which is verified via phase-portraits and basins of attraction.These results provide a theoretical reference for the dynamic optimization of hydraulic power generation systems.To further explore the stability and oscillation of hydropower station,the future work will focus on the hidden dynamics characteristics of HTGS under complex operating condition.Furthermore,in order to simulate a more realistic state,the hydraulic,mechanical,electrical,and other interference factors should be considered completely.
Acknowledgements
Project supported by the Fundamental Research Funds for the Northwest A & F University (Grant No./Z1090220172),the Scientific Research Foundation of the Natural Science Foundation of Shaanxi Province,China(Grant No.2019JLP-24), the Shaanxi Province Innovation Talent Promotion Plan-Science and Technology Innovation Team, China (Grant No.2020TD-025), and the Water Conservancy Science and Technology Program of Shaanxi Province, China (Grant No.2018slkj-9).
- Chinese Physics B的其它文章
- Dynamic responses of an energy harvesting system based on piezoelectric and electromagnetic mechanisms under colored noise
- Intervention against information diffusion in static and temporal coupling networks
- Turing pattern selection for a plant–wrack model with cross-diffusion
- Quantum correlation enhanced bound of the information exclusion principle
- Floquet dynamical quantum phase transitions in transverse XY spin chains under periodic kickings
- Generalized uncertainty principle from long-range kernel effects:The case of the Hawking black hole temperature

