
ldentification of genetic loci for grain yield-related traits in the wheat population Zhongmai 578/Jimai 22
2023-07-17 09:42:28LlUDanZHAODehuiZENGJianqiRabiuSaniSHAWAlTONGJingyangLlMingLlFajiZHOUShuoHUWenliXlAXianchunTlANYubingZHUQianWANGChunpingWANGDesenHEZhonghuLlUJindongZHANGYong
LlU Dan,ZHAO De-hui,,ZENG Jian-qi,Rabiu Sani SHAWAl,,TONG Jing-yang,Ll Ming,Ll Fa-ji,,ZHOU Shuo,HU Wen-li,XlA Xian-chun,TlAN Yu-bing,ZHU Qian,WANG Chun-ping,WANG De-sen,HE Zhong-hu,,LlU Jin-dong,,ZHANG Yong#
1 Institute of Crop Sciences,National Wheat Improvement Center,Chinese Academy of Agricultural Sciences (CAAS),Beijing 100081,P.R.China
2 College of Agriculture,Henan University of Science & Technology,Luoyang 471000,P.R.China
3 Department of Crop Science,Faculty of Agriculture and Agricultural Technology,Aliko Dangote University of Science and Technology Wudil,Kano 713281,Nigeria
4 Crop Research Institute,Shandong Academy of Agricultural Sciences,Jinan 250100,P.R.China
5 Institute of Biotechnology and Food Science,Hebei Academy of Agriculture and Forestry Sciences,Shijiazhuang 050051,P.R.China
6 Gaoyi Stock Seed Station,Shijiazhuang 053110,P.R.China
7 Shangqiu Academy of Agricultural and Forestry Sciences,Shangqiu 476000,P.R.China
8 International Maize and Wheat Improvement Center (CIMMYT),China Office,c/o CAAS,Beijing 100081,P.R.China
9 Agricultural Genomics Institute at Shenzhen,Chinese Academy of Agricultural Sciences,Shenzhen 518120,P.R.China
Abstract The identification of stable quantitative trait locus (QTL) for yield-related traits and tightly linked molecular markers is important for improving wheat grain yield. In the present study,six yield-related traits in a recombinant inbred line (RIL)population derived from the Zhongmai 578/Jimai 22 cross were phenotyped in five environments. The parents and 262 RILs were genotyped using the wheat 50K single nucleotide polymorphism (SNP) array. A high-density genetic map was constructed with 1 501 non-redundant bin markers,spanning 2 384.95 cM. Fifty-three QTLs for six yield-related traits were mapped on chromosomes 1D (2),2A (9),2B (6),2D,3A (2),3B (2),4A (5),4D,5B (8),5D (2),7A (7),7B (3)and 7D (5),which explained 2.7-25.5% of the phenotypic variances. Among the 53 QTLs,23 were detected in at least three environments,including seven for thousand-kernel weight (TKW),four for kernel length (KL),four for kernel width(KW),three for average grain filling rate (GFR),one for kernel number per spike (KNS) and four for plant height (PH).The stable QTLs QKl.caas-2A.1,QKl.caas-7D,QKw.caas-7D,QGfr.caas-2B.1,QGfr.caas-4A,QGfr.caas-7A and QPh.caas-2A.1 are likely to be new loci. Six QTL-rich regions on 2A,2B,4A,5B,7A and 7D,showed pleiotropic effects on various yield traits. TaSus2-2B and WAPO-A1 are potential candidate genes for the pleiotropic regions on 2B and 7A,respectively. The pleiotropic QTL on 7D for TKW,KL,KW and PH was verified in a natural population. The results of this study enrich our knowledge of the genetic basis underlying yield-related traits and provide molecular markers for high-yield wheat breeding.
Keywords: grain yield,KASP marker,QTL mapping,SNP chip
1.lntroduction
Common wheat (TriticumaestivumL.) is one of the most important staple crops,as it feeds more than 35% of the people in the world (Hussainet al.2017). To meet the rising food demands for the growing population,it is estimated that crop production needs to grow by at least 2.4% every year (Rayet al.2013). Thus,improving the yield potential is still a major task in wheat breeding,and it can be realized by improvements in the three main yield components,i.e.,spike number per unit area (SP),kernel number per spike (KNS) and thousand-kernel weight(TKW) (Simmondset al.2014). SP is affected by multiple factors,such as planting density,tiller production and tiller survival (Nerson 1980). KNS is largely determined by the spike architecture (Cuiet al.2011),with heritability estimated to be 0.63 (Xie and Sparkes 2021). TKW is determined by grain size and grain filling,with high heritability estimated to be 0.78 (Xie and Sparkes 2021);and grain size is related to kernel length (KL) and kernel width (KW),while grain filling is determined by grain-filling rate (GFR) and duration (GFD) (Yanget al.2019;Liet al.2021). In addition to these yield components,plant height(PH) is also significantly associated with yield by affecting lodging resistance and grain assimilate processes (Tianet al.2017;Zhouet al.2020).
Grain yield-related traits are controlled by multiple genes and sensitive to environmental effects. Many yieldrelated quantitative trait loci (QTLs) have been detected on all of the 21 chromosomes in the wheat genome (Gaoet al.2015;Liet al.2019,2020;Yanget al.2019;Caoet al.2020;Corsiet al.2021;Liuet al.2022;Quet al.2022). However,due to the large QTL intervals and lack of validation,few QTLs have been used in wheat breeding programs (Liuet al.2020). Therefore,it is important to narrow the QTL intervals and validate their effects in various genetic backgrounds. For example,Chenet al.(2020) identified a major stable QTLQTgw.cau-7Dusing a Hesheng 2/Nongda 4332 RIL population,and the QTL was delimited into a physical interval of approximately 4.4 Mb by fine mapping. Quet al.(2022) identified a colocated QTL for TKW and KL on chromosome 2D using bulked segregant analysis (BSA) and a wheat 660K SNP array,and successfully verified their effects in a natural population. By integrating QTL data from different studies,meta-QTL (MQTL) analysis is another effective approach to validate QTL and to narrow the QTL interval (Liuet al.2020). MQTL analysis was successfully used by Sainiet al.(2022),Yang Yet al.(2021) and Miaoet al.(2022)to narrow the confidence intervals by 8.8-,2.9-and 3.7-fold,respectively. Studies have also indicated that most of the MQTL found were mapped in the distal regions of chromosomes (Xie and Sparkes 2021),and more MQTL were enriched on chromosomes 4A,4B,4D,5B,6B,7A,7B,7D than on 1A,3D,5D and 6A (Liuet al.2020;Yang Yet al.2021;Sainiet al.2022).
With the rapid advancements in wheat genome sequencing and high-throughput genotyping,localizing and cloning genes have become more efficient and rapid.Dozens of genes have been identified through homology or map-based cloning. For example,TaCwi-A1(Maet al.2012),TaGW2(Suet al.2011),TaGS-D1(Zhanget al.2014),TaSus1,TaSus2(Jianget al.2011;Houet al.2014) andTaTGW6(Huet al.2016) were reported to regulate either grain size or weight;whileGNI1(Sakumaet al.2019),TB1(Dixonet al.2018),WAPO1(Kuzayet al.2019,2021),WFZP(Dobrovolskayaet al.2015;Duet al.2021) andTaCol-B5(Zhanget al.2022) are associated with spike development and significantly influence KNS.In addition,more than 20 dwarfing genes for plant height have been identified,among whichRht1,Rht2,Rht8,andRht24have been cloned and widely used in high-yield breeding programs (Elliset al.2002;Tianet al.2017,2019,2021;Wurschumet al.2017;Groveret al.2018;Chaiet al.2022;Xionget al.2022). To satisfy the modern breeding demands,it is important to identify as many grain yield-related loci as possible and develop functional markers to pyramid the favorable alleles through markerassisted selection (MAS) in wheat breeding.
The Yellow and Huai River Valleys Winter Wheat Region (YHRVWWR) is the most important wheat production area,contributing about 65% of the wheat production in China (Zhouet al.2007). Improving yield potential is one of the most important breeding objectives.In this study,262 recombinant inbred lines (RILs) were generated from a cross between Zhongmai 578 (ZM578)and Jimai 22 (JM22). The two leading cultivars produce high grain yield based on different traits;ZM578 has a larger kernel size and higher TKW,whereas JM22 has more kernels per spike. Therefore,it was practicable to dissect the genetic basis for grain yield-related traits using the RIL population. The main objectives of this study were: 1) to identify genetic loci for six grain yieldrelated traits of TKW,KL,KW,GFR,KNS and PH,and 2)to develop high-throughput molecular markers for MAS in high-yield wheat breeding.
2.Materials and methods
2.1.Plant materials
A total of 262 F5RILs derived by single-seed descent(SSD) from a cross between two leading wheat cultivars,ZM578 and JM22,were used for phenotyping and QTL mapping. ZM578,which is characterized by high yield,excellent pan bread quality,good disease resistance,and abiotic stress tolerance (see the pedigree shown in Appendix A),was a new leading cultivar approved for national release in 2020 and 2021 in the southern and northern parts of the YHRVWWR,respectively. It currently has a production area of around 0.4 million ha.JM22,which is characterized by high yield as well,was released in 2006 in the northern part of YHRVWWR,and then released in Anhui in 2010 and in Henan in 2011 in the southern part of YHRVWWR. During the past 12 years,it had an annual production area of around 1.5 million ha.
2.2.Field trials and phenotypic evaluation
The parents and 262 RILs were grown at Xinxiang(34°53′N,113°23′E) in the 2019-2020 and 2020-2021 cropping seasons (defined as E1 and E2,respectively),as well as at Shangqiu (33°43′N,114°49′E) in 2020-2021 (E3),and Luoyang (34°32′N,112°16′E) in 2020-2021 (E4) in Henan Province,and at Gaoyi (37°33′N,114°26′E) in 2020-2021 (E5) in Hebei Province. The field trials were carried out in randomized complete blocks with three replications in all environments. Each plot comprised one 1-m row with spacing of 20 cm.Thirty seeds were sown evenly in each row. Agronomic measurements of grain yield-related traits,including TKW,KL,KW,GFR,KNS and PH,were performed according to Liet al.(2019) with minor modifications.PH was measured from the base of the stem to the top of the spike,excluding awns. Thirty randomly selected spikes were harvested at maturity from each plot. KNS was the average seed number of 30 spikes. TKW,KL and KW were determined using a sample of 1 000 grains by a Wanshen SC-G seed detector (Wanshen Detection Technology Co.,Ltd.,Hangzhou,China). GFR(g d-1) was the ratio of TKW to the number of days from flowering to physiological maturity,with flowering date(FD) recorded as the time when approximately 50% of the spikes were flowering and the physiological maturity date recorded as the time when the spike peduncle and plant internodes of 50% of the plants in a plot lost all their green color. KNS was determined in four environments,excluding E4.
A diverse panel of 166 wheat cultivars was grown at Anyang (AY) in Henan Province and at Suixi (SX) in Anhui Province during the 2012-2013 and 2013-2014 cropping seasons (defined as 12-13AY,12-13SX,13-14AY,and 13-14SX,respectively),and at AY and Gaoyi (GY) in Hebei Province in 2014-2015 (14-15AY and 14-15GY).The phenotypic data of this natural population is available in Liet al.(2019),and these data were used to validate the effectiveness of the kompetitive allele-specific PCR(KASP) markers.
2.3.Statistical analyses
The best linear unbiased estimation (BLUE) values of lines in each environment and across environments were calculated using the PROC MIXED function in SAS 9.4 Software (SAS Institute Inc,Cary,NC,USA) for subsequent analysis. The basic statistical and correlation analyses were conducted using the PROC MEANS and PROC CORR functions,respectively. Analysis of variance (ANOVA) was performed for each trait using the PROC GLM function,and multiple comparisons among genotypes were performed by the Tukey test with lines nested in genotype as a random effect.Hb2was estimated using the formulaHb2=σ2g/(σ2g+σ2ge/e+σ2ε/re)(Nyquist and Baker 1991),whereσ2grefers to the variance of genotypes,σ2gerepresents the variance of the genotype by environment interaction,σ2εis the variance of error,andeandrrepresent the numbers of environments and replications,respectively.
2.4.Genetic map construction and QTL mapping
The RILs and two parents were genotyped using the wheat 50K SNP array at CapitalBio Corporation (Beijing,China;http://www.capitalbio.com) with 55 224 SNPs evenly distributed on the 21 wheat chromosomes. For genetic map construction,the monomorphic markers between parents and the markers with a high missing value (i.e.,more than 20.0%) or minor allele frequency(MAF) less than 0.3 were removed,and the remaining 9 661 high-quality polymorphic markers were used for subsequent analysis. The BIN function in IciMapping v4.2(http://www.isbreeding.net/;Menget al.2015) was used to remove redundant markers. Linkage analysis of the 1 501 non-redundant markers was performed with the JoinMap v4.0 Software using the regression mapping algorithm.The linkage maps were drawn using the MapChart v2.32 Software (https://www.wur.nl/en/show/Mapchart.htm;Voorrips 2002).
QTL analysis was carried out using the inclusive composite interval mapping (ICIM) function of IciMapping v4.2. The mapping parameters were set as step=0.1 cM,PIN=0.001,and the logarithm of odds (LOD) threshold was calculated with 1 000 permutations atP<0.05.QTL that explained more than 10.0% of the phenotypic variance were considered to be major loci,and those detected in more than three environments were regarded as stable. For TKW,KL,KW,GFR,and KNS,the favorable alleles were defined as those that increased the corresponding values;for PH,the favorable alleles were those that decreased the value. All QTLs were named in accordance with the International Rules of Genetic Nomenclature (McIntosh 2013).
2.5.DNA sequencing of WAPO-A1
Genomic DNA fragments ofWAPO-A1from homology cloning were amplified in ZM578 and JM22 using the primer pairs shown in Appendix B. The PCR products were purified and directly sequenced. Gene sequence alignments were performed with DNAMAN v8.0 Software.
2.6.KASP marker development and validation
Primers of the KASP markers were designed using the PolyMarker website (http://www.polymarker.info/).PCR was performed following Yang M Jet al.(2021).Fluorescence was detected on PHERAstar Plus SNP(BMG Labtech GmbH,Ortenberg,Germany) and the data were analyzed using KlusterCaller (LGC,Hoddesdon,UK). KASP markers were first validated on the parents,and then used to screen the RIL and natural populations.
3.Results
3.1.Phenotypic analysis
The investigated traits for the RILs and parents in five environments and the BLUE values are shown in Appendix C. Compared with JM22,ZM578 was characterized by higher values (mean±SD) of TKW(53.21±3.71),KL (6.60±0.28),KW (3.46±0.17) and GFR(1.70±0.11),but relatively lower KNS (37.10±2.95).The two parents had similar PH. Based on the BLUE values,frequency distribution diagrams for each trait indicated transgressive segregations for all six traits in the population (Appendix D). ANOVA showed that the effects of genotypes,genotype×environment interaction(G×E),and environments were all significant (P<0.001),and the broad-sense heritabilities ranged from 0.84 to 0.96 (Table 1),suggesting a determinant role of genetic factors.
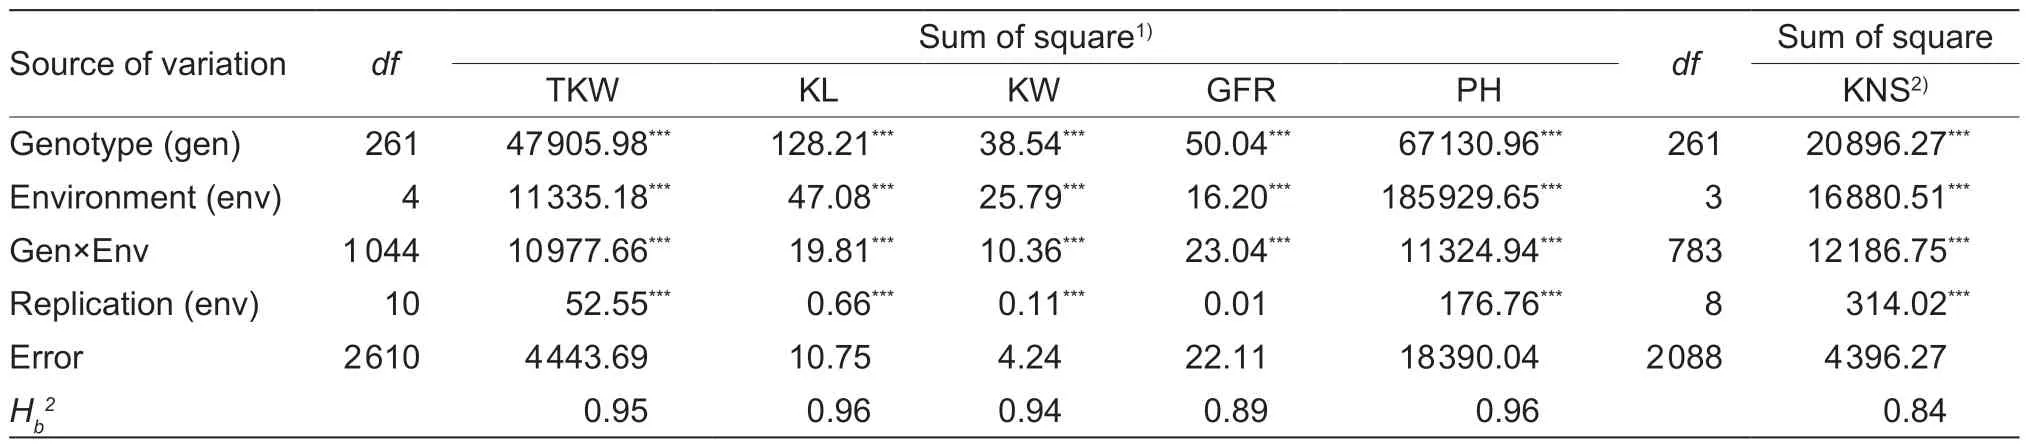
Table 1 Analysis of variance of the grain yield-related traits in the Zhongmai 578/Jimai 22 RIL population
The among-environment correlations for all traits were significant and positive (Appendix E). Highly significant and positive correlations were observed among TKW,KW and GFR (r=0.86-0.96,P<0.001),followed by those of PH with TKW,KW and GFR (r=0.68-0.71,P<0.001),and those of KL with TKW,KW,GFR and PH(r=0.33-0.68,P<0.001) based on BLUE values across the environments. There was no significant correlation between KNS and PH,whereas significant and negative correlations of KNS with TKW,KL,KW and GFR were observed (r=-0.28-(-0.39),P<0.001) (Appendix F).
3.2.High-density genetic map
The high-density genetic map with 1 501 bin markers was established on all chromosomes except 6B (Appendix G).The total length of the linkage map was 2 384.95 cM,with an average genetic distance of 1.59 cM per bin marker.The A genome had the maximum number of markers(562),followed by the B (545) and D genomes (394)(Appendices H and I).
3.3.QTL analysis
Fifty-three QTLs for the six grain yield-related traits on chromosomes 1D (2),2A (9),2B (6),2D,3A (2),3B(2),4A (5),4D,5B (8),5D (2),7A (7),7B (3) and 7D(5) were identified across the five environments,and they explained 2.7-25.5% of the phenotypic variances(Appendix J). Among the 53 QTLs,23 were detected in at least three environments. For kernel-related traits including TKW,KL,KW,and GFR,39 QTLs were detected on 13 chromosomes,and 18 of them were stable in at least three environments. One out of five detected QTLs for KNS and four out of nine QTLs for PH were stable across environments (Table 2).
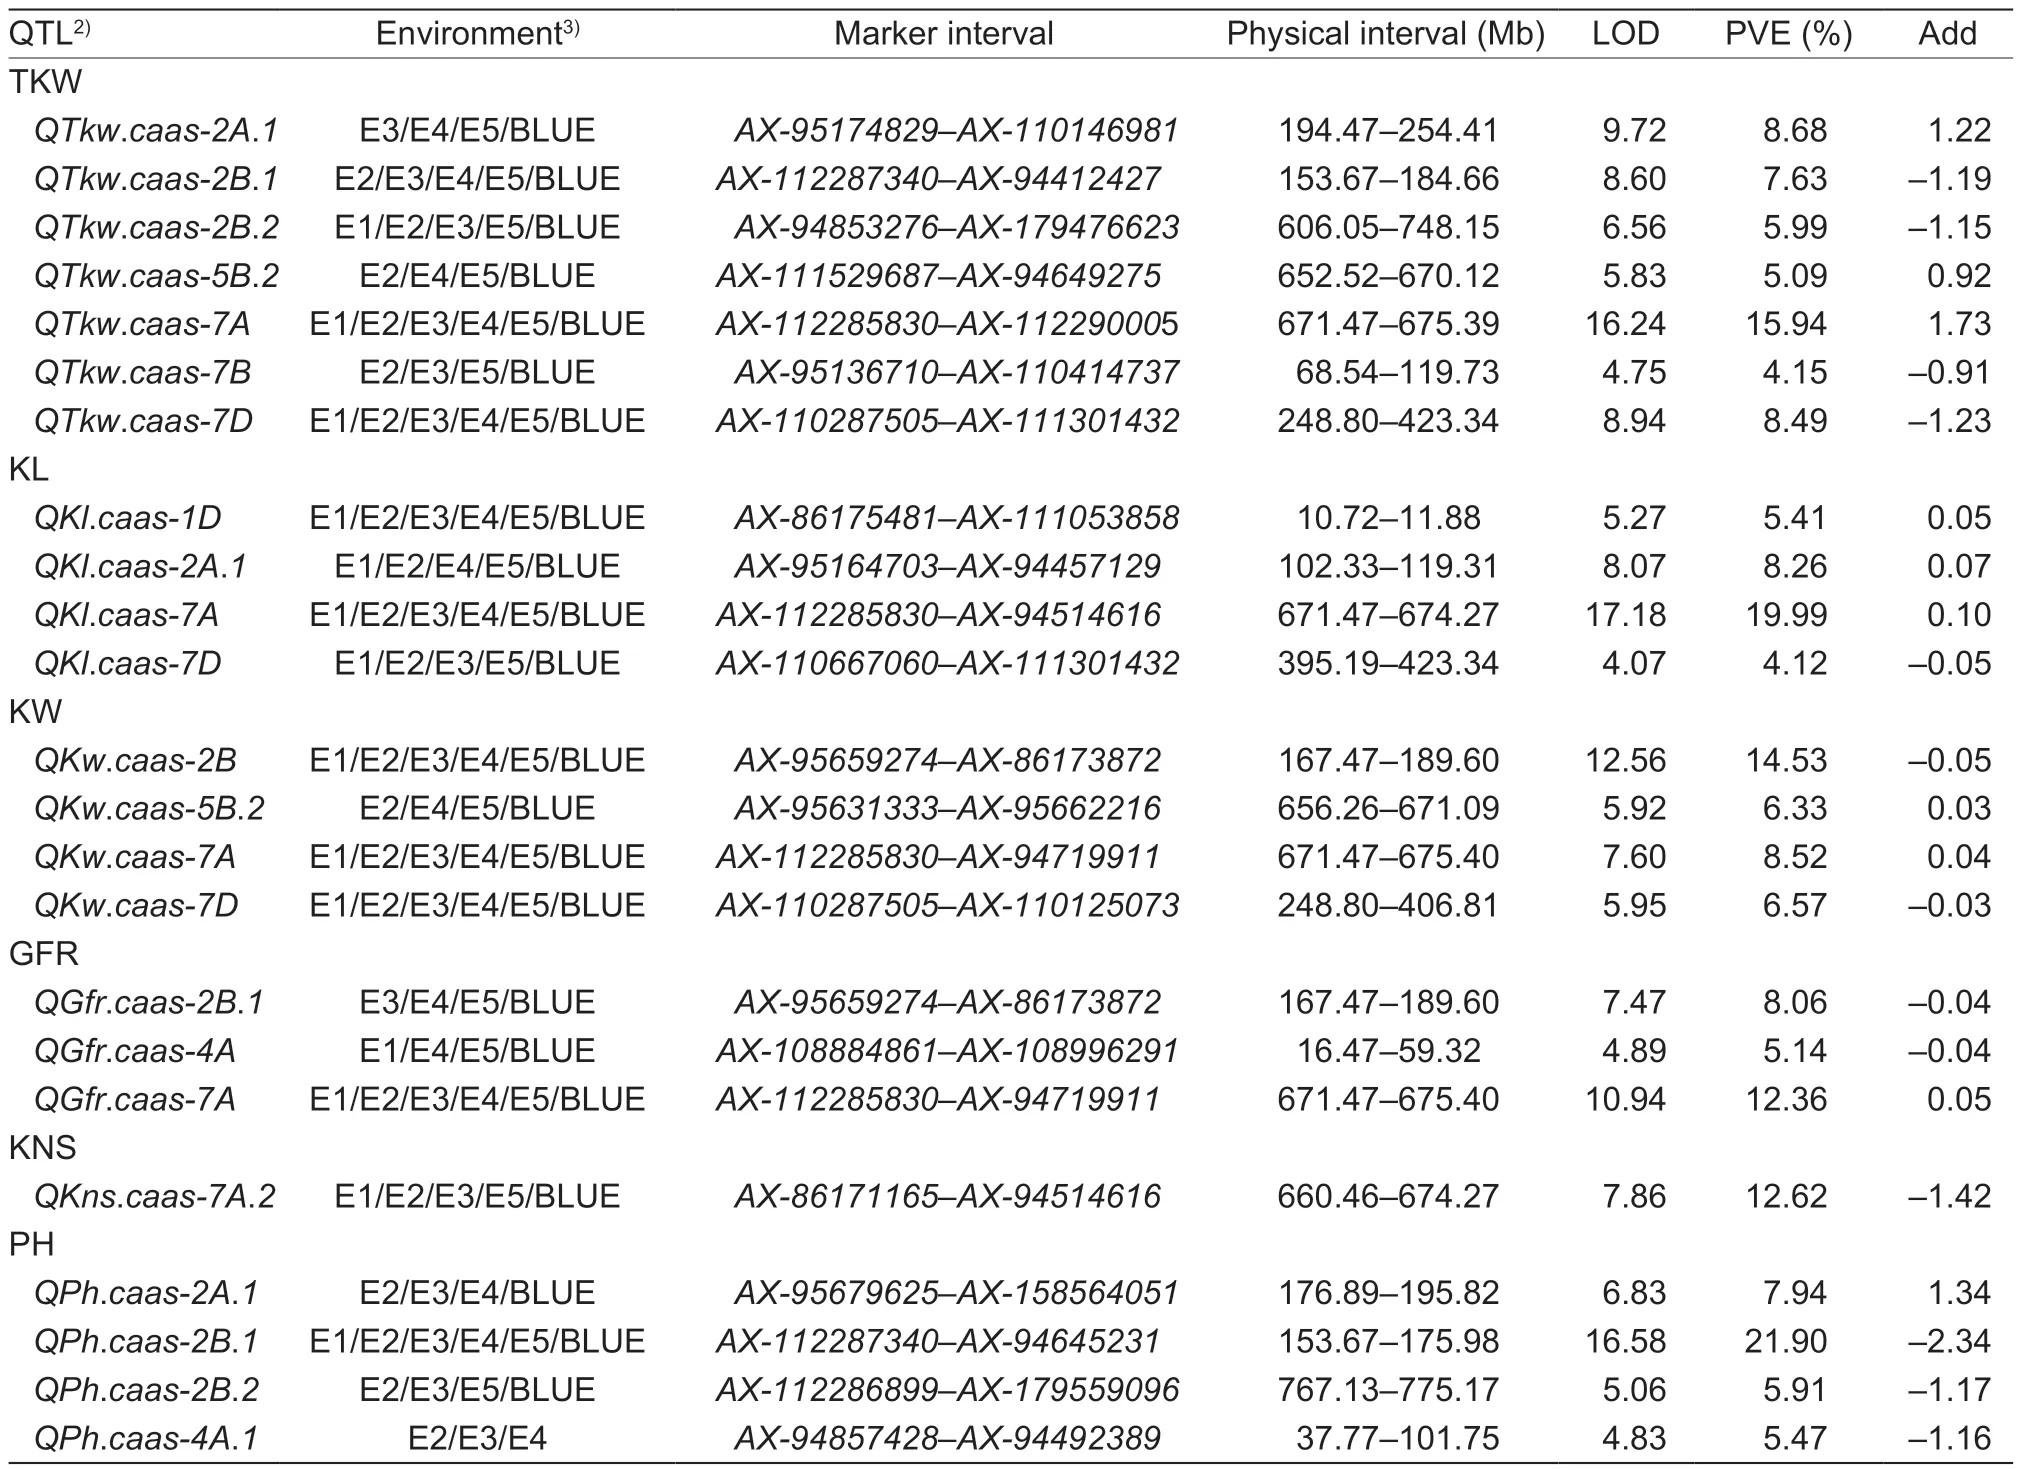
Table 2 Stable quantitative trait loci (QTLs) for six grain yield-related traits identified in the Zhongmai 578 (ZM578)/Jimai 22 (JM22)recombinant inbred line (RIL) population1)
QTL for kernel-related traitsTen QTLs for TKW were detected,including seven stable QTL on chromosomes 2A,2B (2),5B,7A,7B and 7D.QTkw.caas-7AandQTkw.caas-7Dwere detected in all five environments,and explained 11.8-19.2% and 3.5-13.3% of the phenotypic variances,respectively.QTkw.caas-2B.1andQTkw.caas-2B.2were identified in four environments and the BLUE value,and they contributed 4.2-13.2%and 3.3-10.3% of the phenotypic variances,respectively.QTkw.caas-2A.1,QTkw.caas-5B.2,andQTkw.caas-7Bwere detected in three environments and the BLUE value,and they explained 3.2-9.5% of the phenotypic variances.The positive additive effects of the QTL on chromosomes 2A,5B and 7A were derived from ZM578,while those ofthe other four on 2B (2),7B and 7D were from JM22.
Four stable QTLs for KL were identified on chromosomes 1D,2A,7A and 7D.QKl.caas-1DandQKl.caas-7Awere detected in all five environments,and they explained 4.6-6.4% and 16.6-22.1% of the phenotypic variances,respectively.QKl.caas-2A.1andQKl.caas-7Dwere observed in four environments and the BLUE value,and they explained 6.1-13.5% and 3.2-4.6% of the phenotypic variances,respectively. The positive additive effects of the QTL on chromosomes 1D,2A and 7A were from ZM578,while the one on chromosome 7D was from JM22.
Four stable QTLs for KW were identified on chromosomes 2B,5B,7A and 7D.QKw.caas-2B,QKw.caas-7AandQKw.caas-7Dwere detected in all environments,and they accounted for 7.9-21.3,7.4-10.9 and 3.4-12.2% of the phenotypic variances,respectively.QKw.caas-5B.2,which explained 4.3-9.3%of the phenotypic variances,was identified in three environments. For the QTL on chromosomes 5B and 7A,the positive alleles were contributed by ZM578,whereas those on 2B and 7D were from JM22.
Ten QTLs for GFR were detected and three of them were stable.QGfr.caas-7Awas stable in all environments with the positive allele from ZM578,and it explained 6.9-15.9% of the phenotypic variances.QGfr.caas-2B.1andQGfr.caas-4A,with the positive alleles from JM22,were detected in three environments and explained 4.2-12.1%and 4.2-5.9% of the phenotypic variances,respectively.
QTL for KNSFive QTLs for KNS were detected on chromosomes 3A,4A,7A (2) and 7D,andQKns.caas-7A.2was the only stable and major QTL among them. It was identified in four environments and the BLUE value,and explained 7.4-18.7% of the phenotypic variances.The positive allele of this QTL was donated by JM22.
QTL for PHNine QTLs for PH were mapped on chromosomes 2A (2),2B (2),3B,4A (2),7A and 7D,and four of them were stable.QPh.caas-2A.1was identified in three environments and the BLUE value,with the favorable allele from JM22,and it explained 5.9-12.0% of the phenotypic variances.QPh.caas-2B.1was detected in all five environments and had the largest effect on PH,accounting for 17.5-25.5% of the phenotypic variances.QPh.caas-2B.2andQPh.caas-4A.1were identified in three environments,and explained 4.4-7.0% and 4.6-6.6% of the phenotypic variances,respectively. The favorable alleles of the three QTLs on chromosomes 2B(2) and 4A were from ZM578 (Table 2).
3.4.QTL-rich regions and pleiotropic effects
Six QTL-rich regions (R1 to R6) were identified on chromosomes 2A,2B,4A,5B,7A and 7D,respectively(Fig.1;Appendix K). The number of QTLs in these regions ranged from two to six. In R1,four QTLs for TKW,KL,GFR and PH were located in the region of 16.64-19.06 cM (176.89-254.41 Mb) on chromosome 2A,with the positive alleles provided by ZM578. In R2,four QTLs for TKW,KW,GFR and PH spanned from 96.24 to 101.24 cM (153.67-189.60 Mb) on chromosome 2B,with the positive alleles from JM22. In R3,two stable QTLs for GFR and PH were located in the region of 32.38-61.73 cM(16.47-101.75 Mb) on chromosome 4A,with the positive alleles provided by JM22. In R4,three stable QTLs for TKW,KW and GFR were mapped in the region of 5.71-21.07 cM (652.52-671.09 Mb) on chromosome 5B,with ZM578 contributing the positive alleles. In R5,five stable and major QTLs for TKW,KL,KW,GFR and KNS,and a QTL for PH spanned from 123.37 to 140.94 cM (660.46-680.90 Mb) on chromosome 7A. The positive alleles for TKW,KL,KW,GFR and PH were from ZM578,while the positive allele for KNS was from JM22. In R6,four QTLs for TKW,KL,KW and PH were mapped in the region spanning from 42.16 to 46.11 cM (248.80-423.34 Mb) on chromosome 7D,and the positive alleles were contributed by JM22.
3.5.TaSus2-2B is likely to be the candidate gene for the pleiotropic QTL on 2B
Four stable and major QTLs showing pleiotropic effects on TKW,KW,GFR and PH were mapped on chromosome 2B,whereTaSus2-2B(TraesCS2B02G194200) for starch biosynthesis and TKW was located.TaSus2-2Bhad two haplotypes,and the average TKW forHap-H(43.17 g)was 4.26 g higher than that ofHap-L(38.91 g) among the modern varieties in a previous study (Jianget al.2011).Using the functional markers ofTaSus2-2B(Jianget al.2011),ZM578 hadHap-L,whereas JM22 possessedHap-H(Fig.2-A). A SNP in the fifth exon was converted into a KASP marker designated asK-Sus2_2B(Fig.2-B).Student’st-test indicated that the RILs carrying the allele(CC) from JM22 had significantly (P<0.05) higher TKW and PH but lower KNS than those carrying the allele (TT)from ZM578 (Fig.2-C).
3.6.Cloning WAPO-A1 and validation of the effects of pleiotropic QTL on 7A
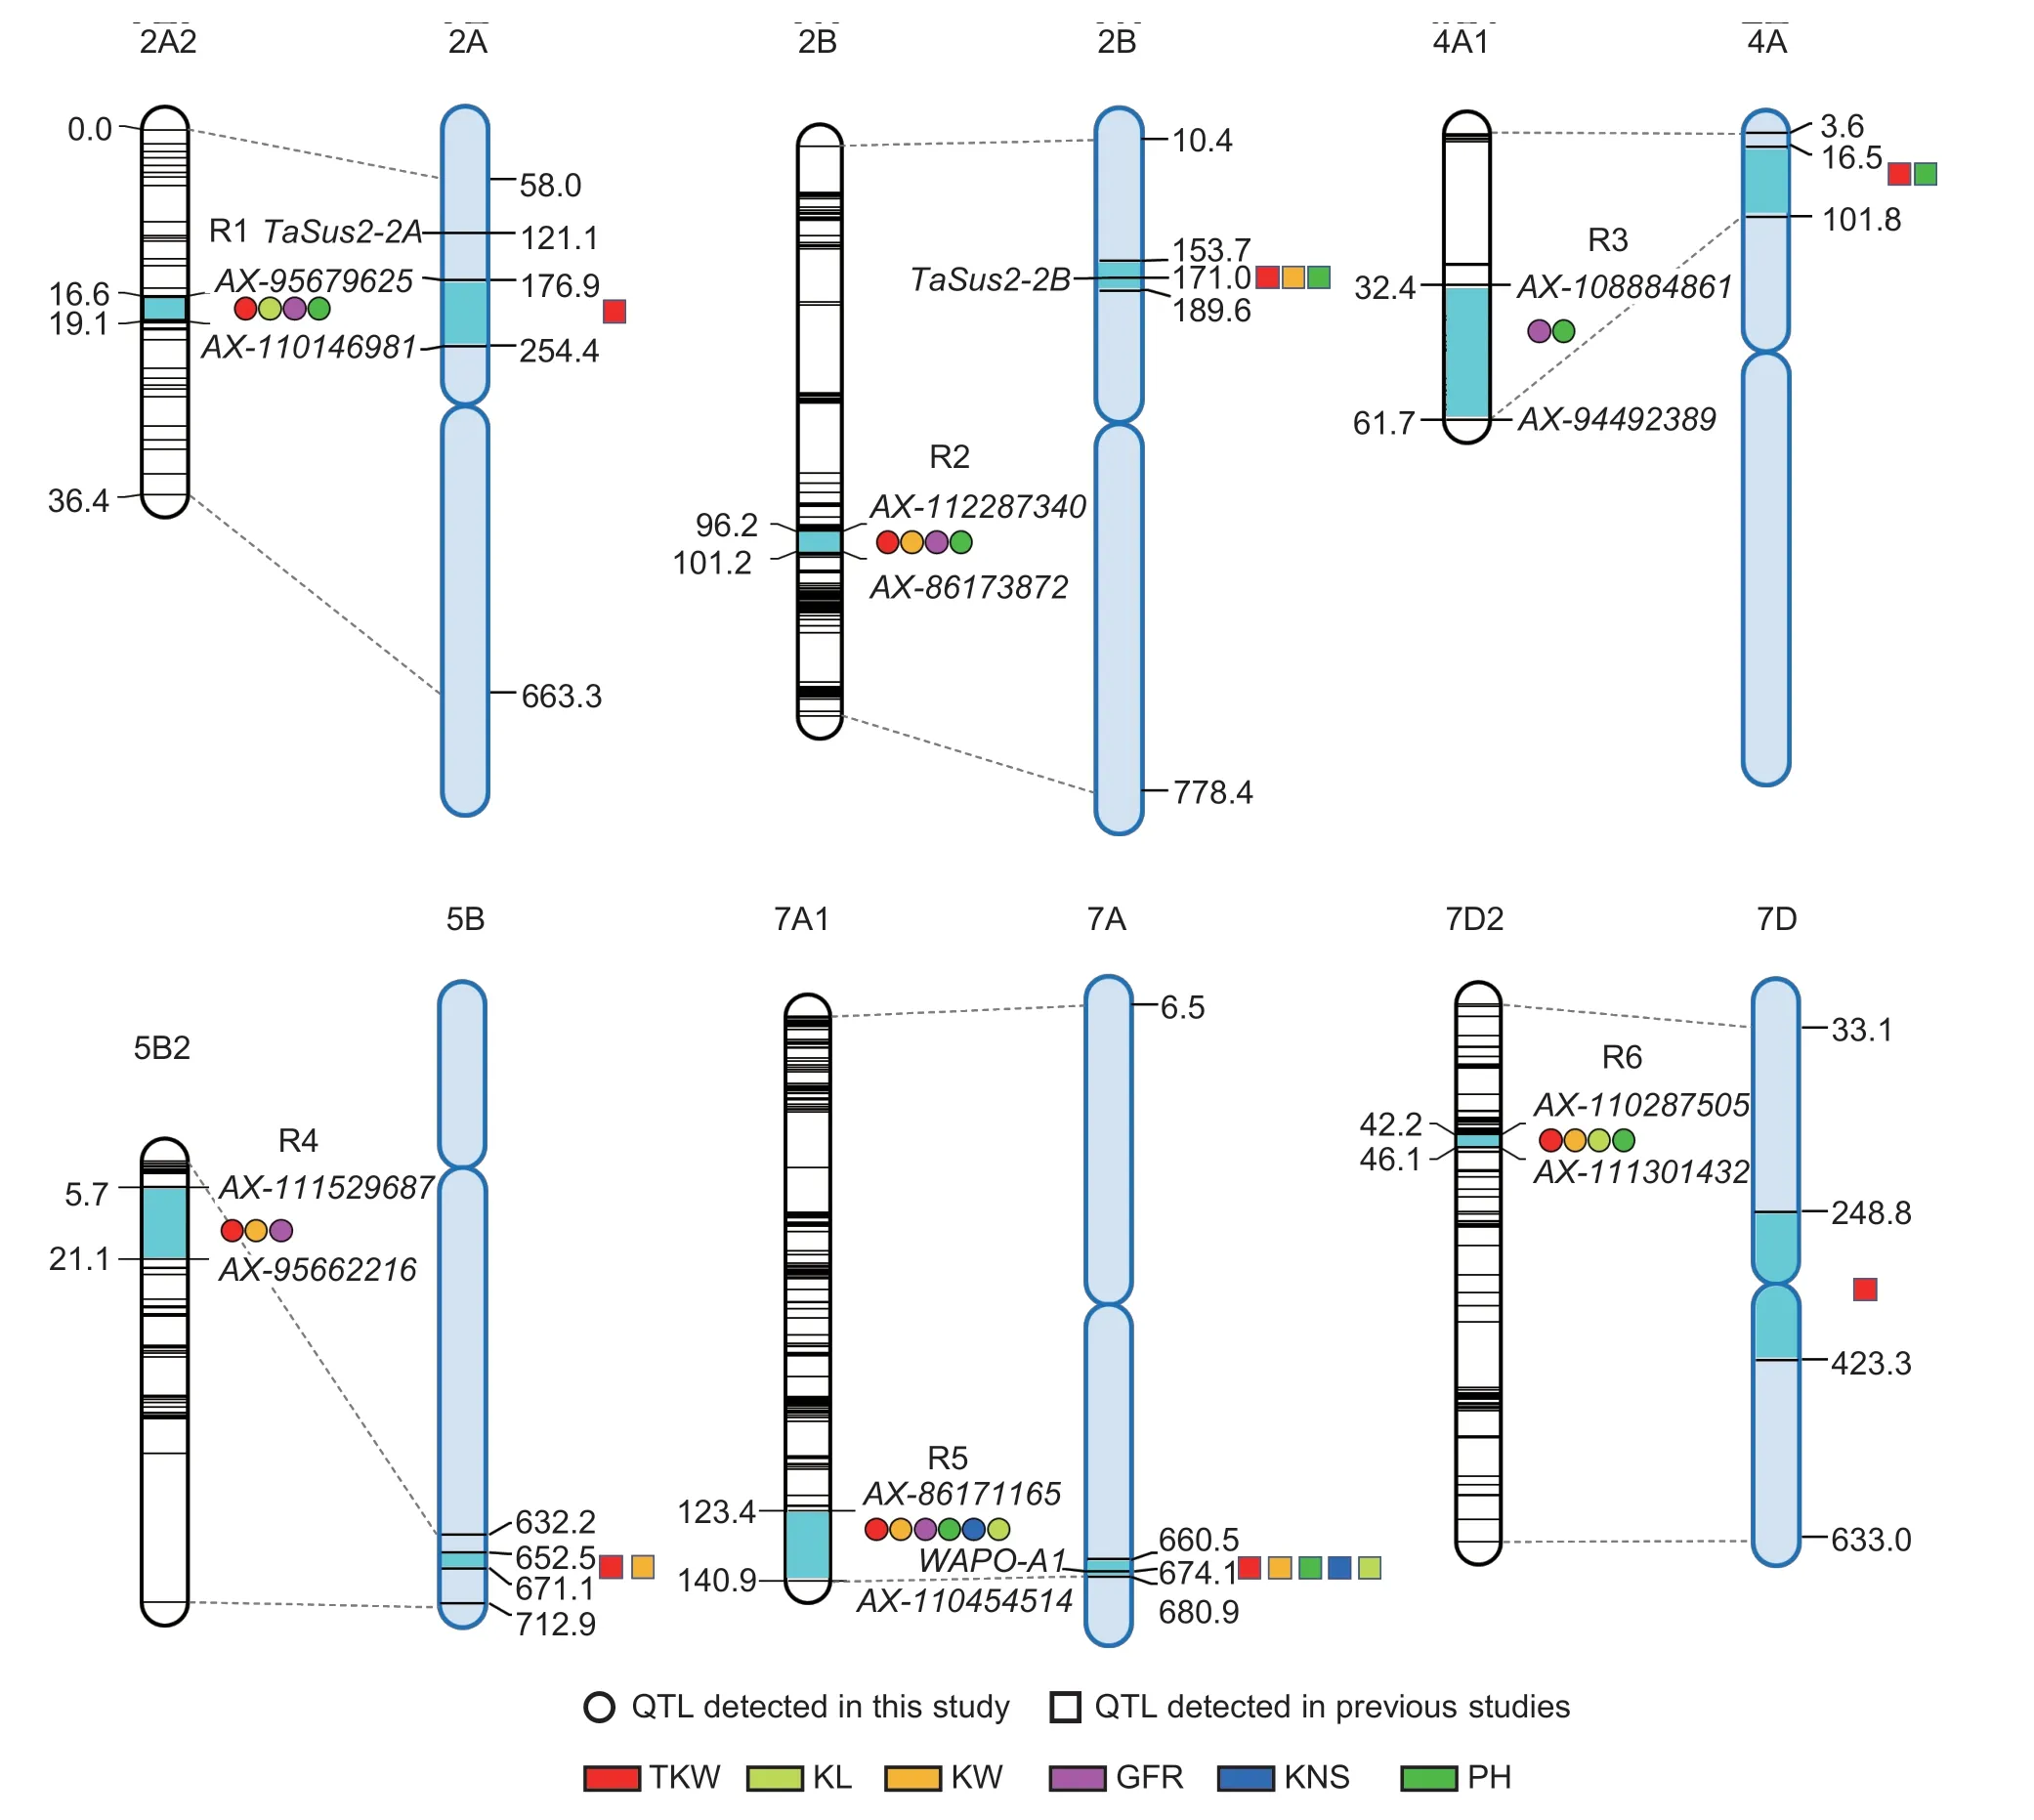
Fig. 1 Chromosomal locations of six quantitative trait locus (QTL)-rich regions. For each chromosome,the linkage map is shown on the left and the physical map is on the right,the numbers indicated on the maps are genetic (cM) and physical (Mb) locations,respectively. The segments in cyan on the genetic map and physical map indicate the genetic intervals and the approximate physical positions of the QTL-rich regions identified. QTL for thousand-kernel weight (TKW),kernel length (KL),kernel width (KW),average grain-filling rate (GFR),kernel number per spike (KNS) and plant height (PH) were marked in red,light green,orange,pink,blue and green colors,respectively.
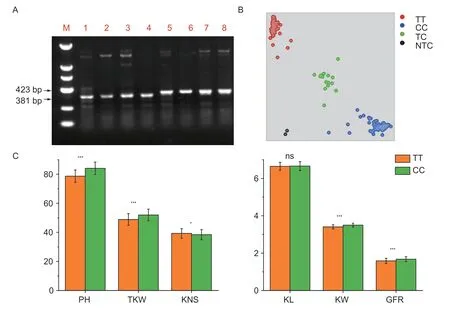
Fig. 2 Validation of the allelic effects of TaSus2-2B in the Zhongmai 578 (ZM578)/Jimai 22 (JM22) recombinant inbred line (RIL)population. A,using the functional marker of TaSus2-2B (Jiang et al. 2011) to detect the haplotypes of ZM578 and JM22. M,DL2000;1-4,Zhongmai 578;5-8,JM22. B,genotyping the RIL population using the KASP marker K-Sus2_2B. C,effects of TaSus2-2B on the six grain yield-related traits after dividing the RILs into two groups based on the KASP marker. PH,plant height (cm);TKW,thousand-kernel weight (g);KNS,kernel number per spike;KL,kernel length (mm);KW,kernel width (mm);GFR,average grainfilling rate (g d-1). The TT and CC alleles indicate the genotypes of ZM578 and JM22,respectively;TC indicates heterozygous lines and NTC means blank. Bars means SD (TT,n=143;CC,n=94). *,P<0.05;**,P<0.01;***,P<0.001;ns,not significant.
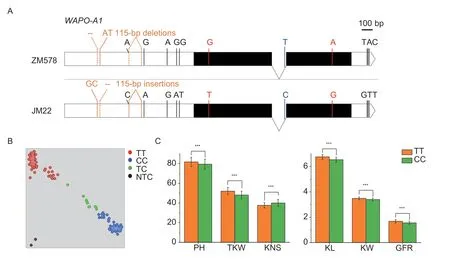
Fig. 3 Validation of the allelic effects of WAPO-A1 in the Zhongmai 578 (ZM578)/Jimai 22 (JM22) population. A,gene structures of WAPO-A1 in ZM578 and JM22. The black boxes,black line,and white box at the left and the white boxes at the right represent exons,intron,promoter region and 3′ UTR,respectively. Insertion and deletion (InDel) between the two parents are indicated in orange,and “--” means 2 bp deletions. Single nucleotide polymorphism (SNP) in the promoter region,exons,intron and 3′ UTR are indicated in black,red,blue and black colors,respectively. B,genotyping the recombinant inbred line (RIL) population using the KASP marker K-WAPO1_Intron. C,effects of WAPO-A1 on the six grain yield-related traits after dividing the RILs into two groups based on the KASP marker. PH,plant height (cm);TKW,thousand-kernel weight (g);KNS,kernel number per spike;KL,kernel length (mm);KW,kernel width (mm);GFR,average grain-filling rate (g d-1). The TT and CC alleles indicate the genotypes of Zhongmai 578 and Jimai 22,respectively;TC indicates heterozygous lines and NTC means blank. Bars mean SD (TT,n=96;CC,n=133). *,P<0.05;**,P<0.01;***,P<0.001.
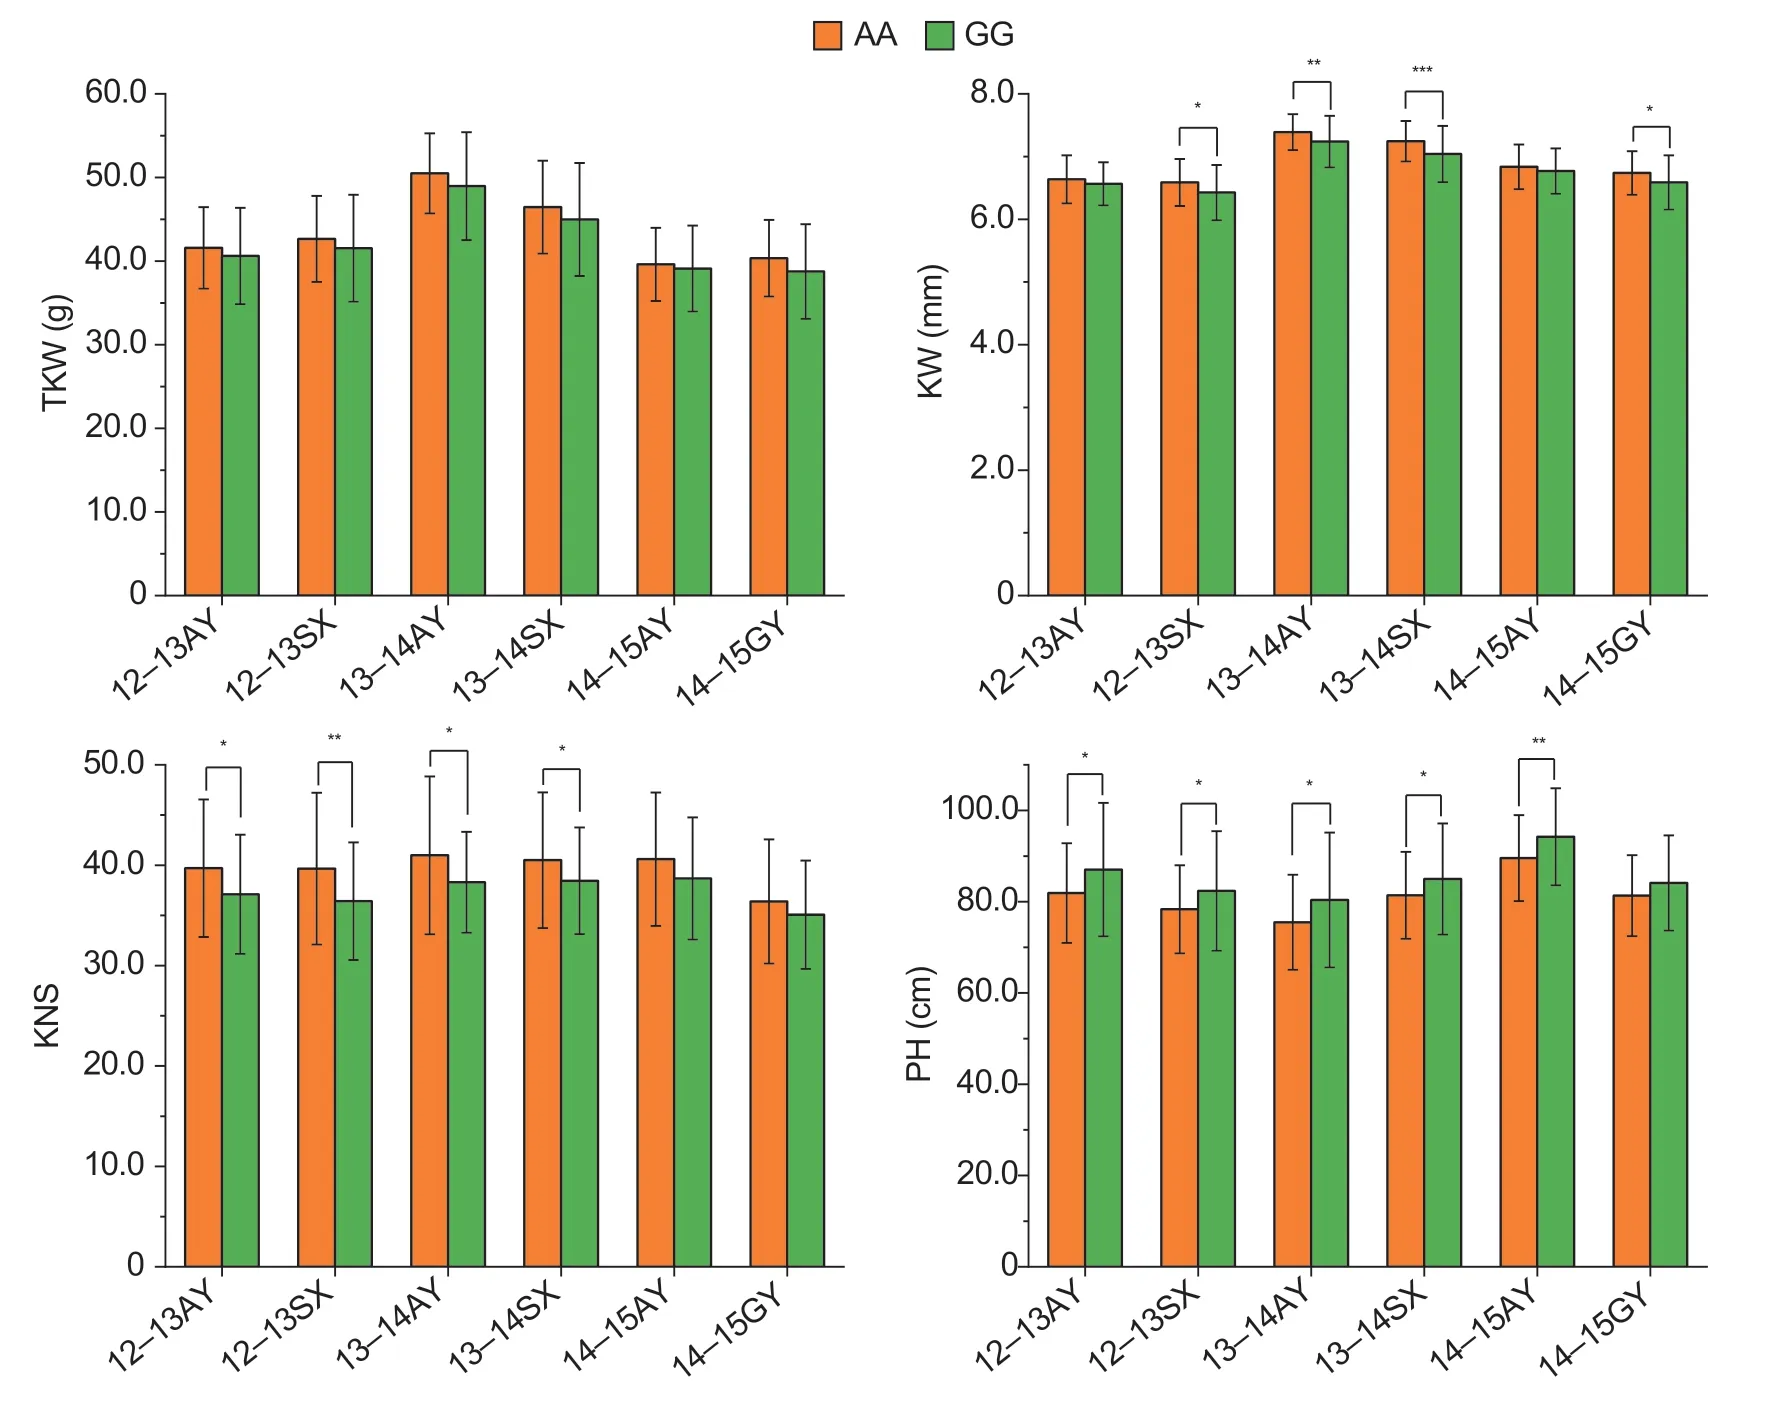
Fig. 4 Validation of the quantitative trait locus (QTL) on chromosome 7D in a diverse panel of 166 wheat cultivars. AA and GG indicate the genotypes of Zhongmai 578 (ZM578) and Jimai 22 (JM22),respectively. TKW,thousand-kernel weight;KW,kernel width;KNS,kernel number per spike;PH,plant height. 12-13AY,2012-2013 Anyang;12-13SX,2012-2013 Suixi;13-14AY,2013-2014 Anyang;13-14SX,2013-2014 Suixi;14-15AY,2014-2015 Anyang;14-15GY,2014-2015 Gaoyi. Bars mean SD(AA,n=92;GG,n=70). *,P<0.05;**,P<0.01;***,P<0.001.
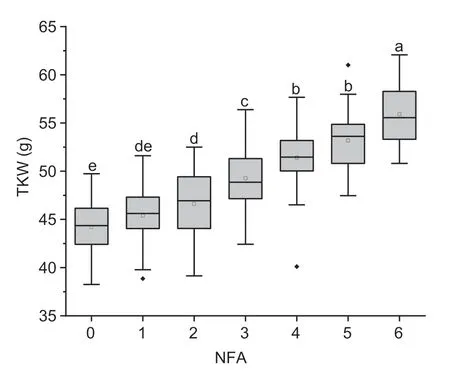
Fig. 5 The effect of the number of favorable alleles on thousandkernel weight (TKW). Each of the box plots shows the upper and lower whisker,the 25 and 75% quartiles,the median(as solid line) and the mean (as rectangle). NFA,number of favorable alleles for TKW. Different letters indicate significant differences at P<0.05.
WAPO-A1(TraesCS7A02G481600) was located in the stable QTL-rich region for TKW,KL,KW,GFR and KNS on chromosome 7A. This gene has four haplotypes(H1,H2,H3andH4),and haplotypesH2andH4were favorable for increasing spikelet number per spike and KNS (Dinget al.2021). Four gene-specific primer pairs covering the whole genomic sequence and the promoter regions ofWAPO-A1were designed and used to analyze the polymorphisms between ZM578 and JM22 (Appendix B). Compared with JM22,there was a 115-bp deletion in the promoter region ofWAPO-A1in ZM578. Eleven more SNPs between the two parents were tested,including five SNPs in the gene upstream region,two in the exons,one in the intron,and three in the gene downstream region(Fig.3-A). The three SNPs in the promoter region and the SNP in the intron were shown to be closely linked with that in the first exon (Appendix L) using the resequencing data of 677 cultivars from WheatUnion Database (http://wheat.cau.edu.cn/WheatUnion/b_4/;Wanget al.2020).Referring to Dinget al.(2021),the SNP in the first exon was critical for identifying favorable haplotypes,while the other four closely linked SNPs could also be developed into diagnostic markers,includingK-WAPO_Intronfor the intron ofWAPO-A1(Appendix B;Fig.3-B). ZM578 containedH1with low KNS,whereas JM22 hadH2with high KNS. The genotype with the TT allele from ZM578 had significantly (P<0.001) higher TKW,KL,KW,GFR and PH,but lower KNS,than those of JM22 in the RIL population (Fig.3-C).
3.7.Validation of a pleiotropic QTL in the natural population
The QTL-rich region on chromosome 7D influenced TKW,KL,KW and PH simultaneously. A KASP marker based on a closely linked marker namedK-AX-110125073was successfully developed and used to verify the allelic effects (Appendix B). The pleiotropic QTL had no significant effect on TKW,but it influenced KW,KNS and PH significantly in at least four environments in the natural population. The AA allele from ZM578 significantly increased KW and KNS in four environments and reduced PH in five environments (Fig.4).
3.8.Additive effects of favorable alleles for TKW
Seven stable QTLs for TKW were detected on chromosomes 2A,2B (2),5B,7A,7B and 7D,and they explained 3.2-19.2% of the phenotypic variances.Employing the flanking and KASP markers,the 262 RILs were divided into seven groups based on the number of favorable alleles,which ranged from zero to six. None of the lines carried all seven favorable alleles for TKW. With the number of favorable alleles increasing,TKW increased significantly,and the TKW of the genotype with six favorable alleles was 11.7 g higher than the genotype without any favorable alleles (Fig.5). Moreover,the genotype with six favorable alleles for TKW also had significantly higher KL,KW,GFR and PH,but lower KNS,than the genotype without any favorable alleles (Appendix M).
4.Discussion
4.1.The impact of the linkage map on QTL mapping
In the present study,a new linkage map with 1 501 bin markers,representing 9 349 SNP markers,was constructed using the 50K SNP array. However,the distribution of markers on the 21 chromosomes was uneven,as no markers were found on 6B,and some chromosomes (2A,2D,4A,6D and 7D) were divided into more than two linkage groups. There are two reasons underlying the loss of the chromosome 6B: 1) The parents of the RIL population used in this research are ZM578 and JM22,and JM22 is one of the parents of ZM578(Appendices A and N),which means that (theoretically)nearly 75% of the genetic background of the RILs originated from JM22. 2) Most of the QTLs/loci for yield related traits distributed on 6B chromosome may have been artificially selected under strong selection pressure,since both JM22 and ZM578 are high-yielding varieties,with yield potentials over 12 tons per hectare.
Among the 55 224 markers in the array,9 661 were polymorphic with high quality. The sequences of these markers were searched in BLASTN against the Chinese Spring reference genome in IWGSC (RefSeq v1.0,http://www.wheatgenome.org/;IWGSC 2018),and a density map of polymorphic markers between the two parents was drawn based on the physical locations (Appendix N). As shown in Appendix N,markers were enriched on 1A,1BL,2A,2B,2D,3A,4D,5AL,5B,7A,7B and 7D,while the two parents had fewer markers with polymorphic differences on 6B. All of the 23 stable QTLs identified were located in the marker-rich regions,which is in agreement with the report of Yanget al.(2019). In that study,a linkage map with 65 linkage groups for Zhongmai 871/Zhongmai 895 RIL population was constructed using a 660K SNP array,where the two parents were sister lines. The markers were also unevenly distributed on 20 chromosomes but no markers were detected on 3D,and the major and stable QTL for grain yield-related traits were identified in regions with more markers on 1AL,3AL,2BS and 5B (Yanget al.2019).
4.2.Comparison of the QTL for grain yield-related traits with previous studies
In previous studies,QTLs or genes for grain yield-related traits were mapped on all 21 chromosomes (Caoet al.2020;Xie and Sparkes 2021). The seven stable QTLs for TKW identified in this study were co-located with the loci reported previously,indicating the reliability of our results.QTkw.caas-2Ashares a similar position with the QTL reported by Luoet al.(2020).QTkw.caas-2B.2is similar toQTkw.haaf-2BL,QTkw-2B.3andQTKW.co-2Bfrom previous reports (Cuiet al.2014;Liuet al.2019;Liet al.2021).QTkw.caas-2B.1is a major stable QTL,withTaSus2-2Bas the candidate gene (Jianget al.2011) and coincides withQtgw.nwafu-2B(Lvet al.2021).QTkw.caas-5B.2overlaps with the meta-QTLQTgw-5B.2(Xie and Sparkes 2021),and it also shares similar positions withQTkw-5B.8W(Xuet al.2017) andQTKW.caas-5B.2(Li Xet al.2015).QTkw.caas-7Ais located in a similar position with the QTL in many studies (Assangaet al.2017;Guanet al.2018;Keeble-Gagnereet al.2018;Chenet al.2020),andWAPO-A1is likely to be the candidate gene (Kuzayet al.2019,2021).QTkw.caas-7Bwas mapped to a physical interval of 68.5-119.7 Mb,at a similar position asqTGW-7B.2(Wanget al.2019),with a nearby geneTaSus1-7Blocated at 68.35 Mb (Suet al.2011). The sequence ofTaSus1-7Bdiffers between the two parents,highlighting the possibility ofTaSus1-7Bas the causal gene.QTkw.caas-7Dis located in a physical interval of 248.8-423.3 Mb,similar to the locus reported by Zhanget al.(2018). It also overlaps with the meta-QTLQTgw-7D.2in an interval of 386.4-410.5 Mb (Xie and Sparkes 2021).
Four stable QTLs for KL were detected,and two of them on chromosomes 7A and 7D share the same intervals with those for TKW.QKl.caas-7Ais consistent withQGl-7A.1(Caoet al.2019). Thus far,few stable QTLs for KL have been detected on chromosome 7D.Renet al.(2021) identified a QTLQKl.sau-7Dlocated at 446.4-452.7 Mb. In the present study,QKl.caas-7Dlocated in 395.2-423.3 Mb is potentially new.QKl.caas-1Dwas mapped in a physical interval of 10.72-11.88 Mb,and it was the only stable QTL mapped on chromosome 1D. In previous studies,some QTLs have been reported to share a close position withQKl.caas-1D. Liet al.(2007)identified a QTL with pleiotropic effects on TKW and SP in 9.6-14.0 Mb using a RIL population derived from Chuan 35050 and Shannong 483. Li Qet al.(2015) identified a QTL for KL with the linked markerWPT-665480located at 3.3 Mb. Wuet al.(2015) also detected a QTL,qKL-1D,at 15.4 Mb.QKl.caas-2Awas mapped in a physical interval of 82.1-119.3 Mb,which is very close toTaSus2-2Aat 121.14 Mb. However,using the functional markers ofTaSus2-2Afrom Houet al.(2014),no variations were detected between ZM578 and JM22,indicating that this QTL is likely to be a new one.
Four stable QTLs for KW identified on chromosomes 2B,5B,7A and 7D overlap with the QTL for TKW,in agreement with the highly significant and positive correlation between TKW and KW (r=0.96).QKw.caas-2Bshares a similar position withQgw.nwafu-2B(Lvet al.2021). Liet al.(2018) detected four QTLs for KNS,KW,PH and flag leaf width in a region of 654.2-696.0 Mb using three RIL populations;whileQKw.caas-5B.2is located at 656.3-671.1 Mb,sharing a similar interval withQKW.caas-5BL.QKw.caas-7Ais similar toQGw.cau-7A-2(Chenet al.2020).QKw.caas-7Dis located in 248.8-406.8 Mb,while no QTL for KW has been reported in this region,indicating that this might be a new QTL.
Three stable QTLs for GFR on chromosomes 2B,4A and 7A overlap with the QTL for TKW and KW,in agreement with the highly significant and positive correlations among TKW,KW and GFR (r=0.86-0.96).Thus far,few studies have reported QTL for GFR (Kirigwiet al.2007;Wanget al.2009;Xieet al.2015;Yanget al.2019;Linet al.2020). In this study,QGfr.caas-2B.1was mapped in a region of 167.5-189.6 Mb. Yanget al.(2019) also identified a QTL on chromosome 2B,which was designated asQgfr.caas-2BSand influences TKW,KW and GFR simultaneously,but it is located at 41.4 Mb,differing fromQGfr.caas-2B.1. In this study,QGfr.caas-4Awas located on the short arm of chromosome 4A,which differs from those reported by Linet al.(2020) and Kirigwiet al.(2007).QGfr.caas-7Awas mapped in a region of 671.5-675.4 Mb,which is different fromQGfr.sicau-7Aon the short arm of 7A (Linet al.2020). Therefore,the three stable QTLs for GFR identified in this study are likely to be new.
QKns.caas-7A.2is a stable and major QTL for KNS,and it shares a similar position withQmt.tamu.7A.1(Assangaet al.2017),QKNS.caas-7AL(Liet al.2018)andQGns.cau-7A.5(Guanet al.2018). Four stable QTLs for PH were identified,among whichQPh.caas-2A.1,which overlaps with the QTL for TKW on chromosome 2A,is likely to be a new QTL.QPh.caas-2B.1,QPh.caas-2B.2andQPh.caas-4A.1are at similar positions toQPh-2B(Liuet al.2014),QPh.sau-2B.1(Renet al.2021) andQHT.uia2.4A-1(Ishamet al.2021),respectively.
4.3.Application of MAS for high-yield wheat breeding
Twenty-three stable QTLs for six grain yield-related traits were identified in the present study,among which ZM578 provided favorable alleles at 12 loci:QTkw.caas-2A.1,QTkw.caas-5B.2,QTkw.caas-7A,QKl.caas-1D,QKl.caas-2A.1,QKl.caas-7A,QKw.caas-5B.2,QKw.caas-7A,QGfr.caas-7A,QPh.caas-2B.1,QPh.caas-2B.2,andQPh.caas-4A.1. Liet al.(2020) mapped some QTLs for TKW with favorable alleles from JM22 located on chromosomes 2D and 6D,as well as QTL with favorable alleles for reduced plant height from JM22 mapped on chromosomes 2D,4D and 6D,which is totally different from our results.These differences are not surprising because ZM578 was selected from a cross between Zhongmai 255 and JM22 through a modified pedigree method,and the RIL population of ZM578/JM22 was used in this research,indicating that all 12 of the favorable alleles were inherited from Zhongmai 255 which was selected from a cross of Yumai 49 and the Australian wheat cultivar Sunstate. It should be noted that many favorable alleles in ZM578 inherited from JM22 could not be detected in this RIL population,because JM22 is one of the parents of this cultivar. Therefore,further research should be conducted using a population of ZM578 with some cultivars other than JM22,in order to find more grain yield-related genes in ZM578.
It is interesting to trace the favorable alleles back to their origination in the pedigree of ZM578,in order to provide more information for MAS in the future.Therefore,six additional KASP markers (K1-K6) were successfully developed based on the tightly linked SNP markers for the corresponding QTL (Appendix B). An analysis and comparison of the genotypic data (Appendix O) indicated that the favorable alleles forQTkw.caas-2A.1andQKl.caas-2A.1were inherited from Yumai 49,but whether the favorable alleles were from Wen 394A or Yumai 2 (Appendix P) remains uncertain. The favorable alleles forQTkw.caas-5B.2andQKw.caas-5B.2can be traced back to Yumai 2 through Yumai 49 (Appendix Q),while those forQTkw.caas-7A,QKl.caas-7A,QKw.caas-7AandQGfr.caas-7Acan be traced back to VPM1 through Sunstate (Appendix R). ForQKl.caas-1D,the positive allele was from Yumai 49,which was inherited from Kanghuixianhong through Yumai 2 (Appendix S).The favorable allele forQPh.caas-2B.1can be traced back to VPM1 or Pavon 76 through Sunstate (Appendix T). However,many lines in the pedigree possess the favorable alleles ofQPh.caas-2B.2andQPh.caas-4A.1,therefore,it is difficult to identify their origins (Appendices U and V).
Some significant correlations between different yield related traits were observed in this study,and six QTLrich regions were identified,reflecting the complex relationships among different traits. In the present study,there were significantly negative correlations of TKW with KNS (r=-0.328,P<0.001) and FD (r=-0.177,P<0.001),and of KNS with SP (r=-0.309,P<0.001),but a significantly positive correlation of KNS with FD(r=0.126,P<0.05) was observed,and there were no significant correlations of TKW with SP,or SP with FD (Appendix W). Therefore,the major QTLs on chromosomes 2B (TaSus2-2B),7A (WAPO-A1) and 7D(QTkw.caas-7D) were selected to analyze their effects on yield-component traits,as well as FD. Different trade-offs among the yield components were detected for the QTLs on 2B (TaSus2-2B) and 7A (WAPO-A1)(Appendix W).QTkw.caas-7Dsignificantly influenced TKW and FD,while no significant effects on KNS or SP were observed in the RIL population,indicating the potential value of this QTL in MAS when ZM578 is used as a parent (Appendix W). Moreover,improving grain yield is always an important breeding objective,although most of the related traits are controlled by multiple genes and significantly affected by environments,making it more challenging. TKW is relatively less sensitive to environments and has high heritability,in agreement with previous reports (Li Xal.2015;Assangaet al.2017;Xuet al.2017;Lvet al.2021;Xie and Sparkes 2021). Seven QTLs for TKW were identified,and the genotype with six favorable alleles gave a value that was 11.7 g higher than the genotype without any favorable alleles,indicating that pyramiding different favorable alleles is an important strategy in wheat breeding. The KASP markers developed here will be useful for MAS in breeding programs,especially for grain yield improvements of leading cultivars such as ZM578 and JM22.
5.Conclusion
The present study constructed a new linkage map for a ZM578/JM22 RIL population,and six grain yield-related traits were evaluated in five environments. A total of 53 QTLs were detected by ICIM,23 of which were stable in at least three environments. Seven QTLs are likely to be new loci. Six QTL-rich regions showed pleiotropic effects on multiple traits,andTaSus2-2BandWAPO-A1are potential candidate genes for the pleiotropic regions on 2B and 7A,respectively. The additive effect of six QTLs for TKW was 11.7 g,indicating that pyramiding different favorable alleles is an important strategy to increase yield. The KSAP markers developed in this study provide molecular markers for high-yield wheat breeding.
Acknowledgements
Some germplasm resources in the pedigree of Zhongmai 578 were provided by the National Germplasm Bank of China in Beijing. This work was funded by the Core Research Budget of the Non-profit Governmental Research Institutions,Institute of Crop Sciences,CAAS(S2022ZD04),the Agricultural Science and Technology Innovation Program,CAAS (CAAS-ZDRW202002),and the Young Elite Scientists Sponsorship Program by China Association for Science and Technology (CAST)(2020QNRC001).
Declaration of competing interest
The authors declare that they have no conflicts of interest.
Appendicesassociated with this paper are available on https://doi.org/10.1016/j.jia.2022.12.002
 Journal of Integrative Agriculture2023年7期
- Journal of Integrative Agriculture的其它文章
- Understanding changes in volatile compounds and fatty acids of Jincheng orange peel oil at different growth stages using GC-MS
- Untargeted UHPLC-Q-Exactive-MS-based metabolomics reveals associations between pre-and post-cooked metabolites and the taste quality of geographical indication rice and regular rice
- A double-layer model for improving the estimation of wheat canopy nitrogen content from unmanned aerial vehicle multispectral imagery
- The potential of green manure to increase soil carbon sequestration and reduce the yield-scaled carbon footprint of rice production in southern China
- lmprovement of soil fertility and rice yield after long-term application of cow manure combined with inorganic fertilizers
- A novel short transcript isoform of chicken lRF7 negatively regulates interferon-β production