
The potential of green manure to increase soil carbon sequestration and reduce the yield-scaled carbon footprint of rice production in southern China
2023-07-17 09:42:54GAOSongjuanLlShunZHOUGuopengCAOWeidong
GAO Song-juan,Ll Shun,ZHOU Guo-peng,CAO Wei-dong#
1 College of Resources and Environmental Sciences,Nanjing Agricultural University,Nanjing 210095,P.R.China
2 Key Laboratory of Plant Nutrition and Fertilizer,Ministry of Agriculture and Rural Affairs/Institute of Agricultural Resources and Regional Planning,Chinese Academy of Agricultural Sciences,Beijing 100018,P.R.China
Abstract Green manure (GM) has been used to support rice production in southern China for thousands of years. However,the effects of GM on soil carbon sequestration (CS) and the carbon footprint (CF) at a regional scale remain unclear.Therefore,we combined the datasets from long-term multisite experiments with a meta-analysis approach to quantify the potential of GM to increase the CS and reduce the CF of paddy soils in southern China. Compared with the fallowrice practice,the GM-rice practice increased the soil C stock at a rate of 1.62 Mg CO2-eq ha-1 yr-1 and reduced chemical N application by 40% with no loss in the rice yield. The total CF varied from 7.51 to 13.66 Mg CO2-eq ha-1 yr-1 and was dominated by CH4 emissions (60.7-81.3%). GM decreased the indirect CF by 31.4% but increased the direct CH4 emissions by 19.6%. In the low and high CH4 emission scenarios,the CH4 emission factors of GM (EFgc) were 5.58 and 21.31%,respectively. The greater soil CS offset the increase in GM-derived CF in the low CH4 scenario,but it could not offset the CF increase in the high CH4 scenario. A trade-off analysis also showed that GM can simultaneously increase the CS and reduce the total CF of the rice production system when the EFgc was less than 9.20%. The variation in EFgc was mainly regulated by the GM application rates and water management patterns. Determining the appropriate GM application rate and drainage pattern warrant further investigation to optimize the potential of the GM-rice system to increase the CS and reduce the total CF in China.
Keywords: green manure,paddy soil,soil carbon sequestration,carbon footprint
1.lntroduction
Soil management is the major driving force of the soil organic carbon (SOC) dynamics and greenhouse gas(GHG) emissions for agricultural soils (Smith 2012).Developing sustainable soil management practices to increase the carbon sequestration (CS) and reduce the GHG emissions of paddy soil is one way to achieve C neutrality in China. Green manure (GM) fixes the atmospheric CO2and N2(when using leguminous GM)into biomass. Planting and utilizing GM during the fallow season is an effective strategy for improving soil fertility while enhancing soil CS;in fact,GM is increasingly being planted in China’s rice regions in consideration of the soil ecology and environment (Caoet al.2017;Lianget al.2022). Based on the results of seven long-term experiments from 2008 to 2020 in southern China,Gaoet al.(2020) found that the planting of leguminous GM can decrease inputs of chemical fertilizers by 20-40%.This combination strategy improves the soil organic carbon (SOC) and soil total nitrogen (N) of paddy soils by 3.95-4.15 and 1.22-1.74%,respectively,significantly increasing the crop yield compared with the application of chemical fertilizers alone. In contrast to non-GM practices,GM enhances soil microbial abundance,activity,and diversity (Kimet al.2020;Gaoet al.2021),reduces the runoff and leaching losses of soil nutrients(Liuet al.2021),and suppresses weeds (Osipitanet al.2019),thereby improving a number of different soil health indicators and ecosystem services (Wood and Bowman 2021). Therefore,GM shows great potential to increase the CS and ecosystem services of paddy soils while enhancing crop yield.
However,previous studies have indicated that the incorporation of GM in paddy soils stimulates CH4emissions and slightly affects N2O emissions as a result of the continuous flooded anaerobic environment (Haqueet al.2015a;Hwanget al.2017;Liet al.2021). The CH4emissions of the GM-rice practice were 7.1-151.7%higher than those of the fallow-rice practice (Zhuet al.2012;Nieet al.2018;Houet al.2022). However,a few studies have reported the opposite results,i.e.,the absence of significant effects or slightly decreased CH4emissions under GM incorporation (Caiet al.2001;Houet al.2022). These contradictory results may be due to multiple factors,such as the specific soil properties,climatic conditions,field management practices,and GM C/N ratios,in the various study regions (Tariqet al.2017;Raheemet al.2019;Leeet al.2020). Tariqet al.(2017)and Leeet al.(2020) suggested that pre-planting drainage and short-term dry soil conditions after GM incorporation can reduce the CH4emissions of paddy soils. Moreover,the use of GM crops with low C/N ratios,such as milk vetch,results in lower CH4emissions than winter GM crops with high C/N ratios,such as rye and rapeseed(Raheemet al.2019;Kimet al.2012). At present,the effects of GM on CH4emissions from paddy fields on the national scale remain unclear. This gap in knowledge limits the ecological and environmental evaluation of the global effects of GM.
Life cycle analysis (LCA) is widely used to comprehensively evaluate the C footprint (CF) of an agricultural ecosystem. This type of analysis includes the direct GHG emissions and CS of paddy soils and the indirect emissions of agricultural material production,transportation,and storage,in addition to field management practices and energy use (Liuet al.2016;Caiet al.2018;Chenet al.2021). Through LCA,Chenet al.(2021) evaluated the CFs of 16 major crop systems and found that fertilization and irrigation are the major factors that determine the CF of crop production in China. Therefore,in the present study,an LCA-based CF analysis was adopted to evaluate the effects of GM on the total CF of rice production and identify the key factors which can further reduce the CF.
In this study,we combined the datasets from long-term multisite experiments with a meta-analysis approach to address three main questions: (i) What is the CS rate of paddy soils under GM? (ii) Can an increase in the soil CS(and a reduction in agricultural inputs) offset the increase in CH4emissions under GM? and (iii) What are the key factors affecting the CF of GM-rice practices,and how can these factors be mitigated?
2.Materials and methods
2.1.Site description and long-term experiments
The nine field experimental sites are located in major rice production provinces in southern China. Six longterm field experiments were established in 2008-2011 at the Hunan,Hubei,Henan,Jiangxi,Fujian,and Anhui sites,and have been running for more than 10 years.Three additional experiments were established in 2018 at the Zhejiang,Guangxi,and Sichuan sites. All sites are located in the humid or sub-humid subtropical monsoon climate zones with four distinct seasons. At the sites,the annual mean air temperatures range from 15.2 to 21.6°C,and the annual precipitation amounts range from 1 200 to 1 900 mm (Table 1). The climatic environment of this region is highly suitable for rice cultivation. The Hunan,Guangxi,and Jiangxi sites are under double rice cropping systems,and the other sites are under single rice production systems. The basic soil properties at the different sites show large variations in pH (varying from 4.7 to 8.2),soil organic matter (1.0 to 6.9%),and soil total N(0.3 to 5.7 g kg-1).
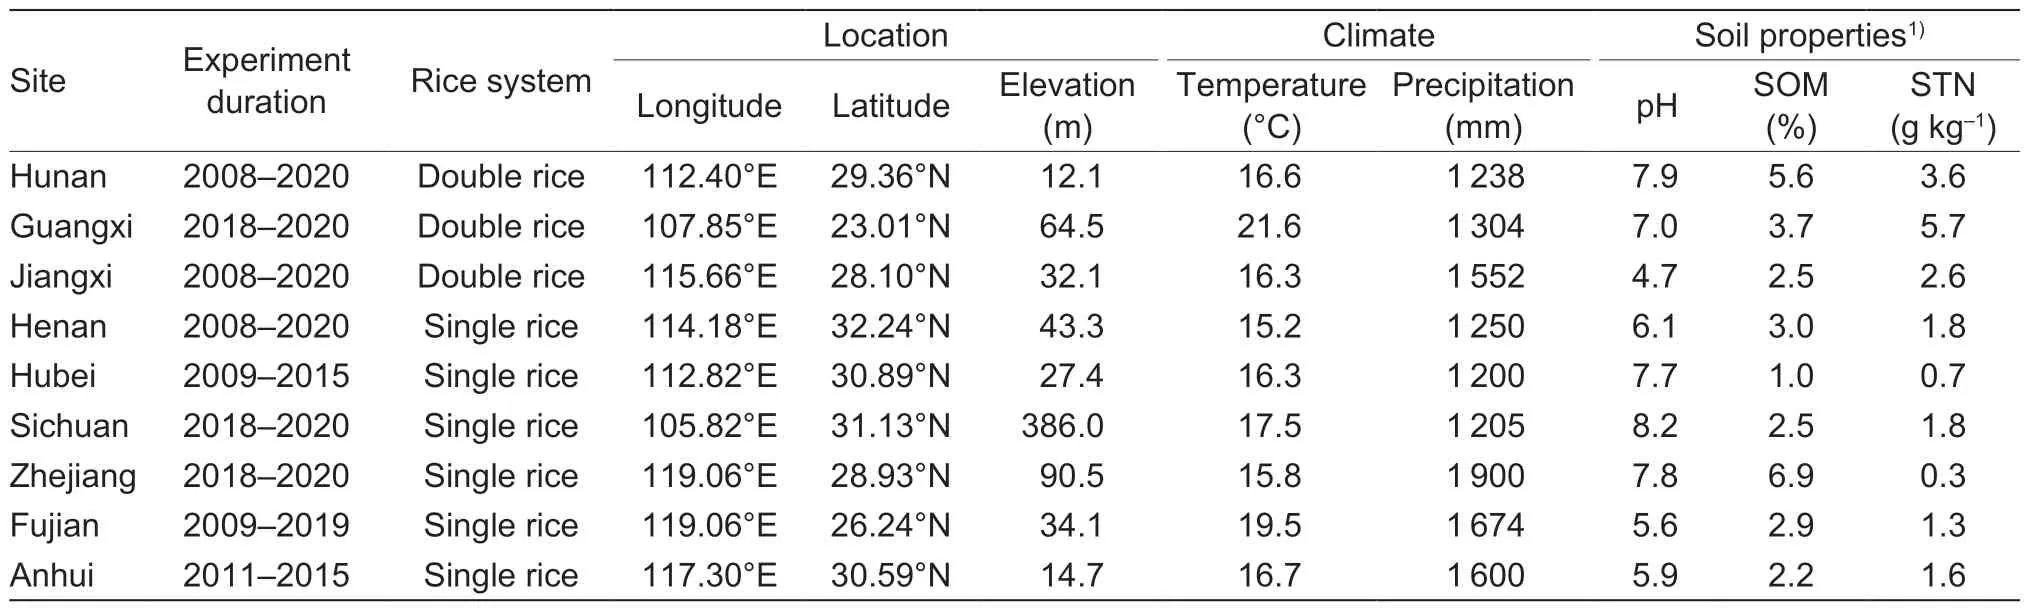
Table 1 Basic information of the experimental sites in nine sites in southern China
2.2.Experimental design and field management
The field experimental design remained consistent across all sites. Five treatments were designed for this multisite experiment: (1) FP is the fallow-rice practiceunder the farmer’s chemical N application rate (FNR)and the fields remained fallow during winter (Fig.1). (2)100%FG is the GM-rice practice with 100% FNR. (3)80%FG is the GM-rice practice with 80% FNR. (4)60%FG is the GM-rice practice with 60% FNR. (5)40%FG is the GM-rice practice with 40% FNR. The fertilizer application rates of the different treatments are listed in Appendix A. The GM crop was leguminous milk vetch,which is grown during the winter and widely used in this region. Milk vetch is usually broadcasted in late September or early October after the harvest of late rice and incorporated into the soil at full flowering (early April)before the transplantation of early rice. The dates of sowing,transplanting,GM incorporation,and harvesting of the GM-rice practices are illustrated in Fig.1. The amount of GM incorporated was 22 500 kg ha-1fresh biomass in all the experiments. The biomass of GM was measured before incorporation. If the biomass was greater than 22 500 kg ha-1,the extra plants were moved out of the plot,or if it was less than 22 500 kg ha-1,the amount required to bring it up to that level was moved into the plot from another field.
2.3.Sampling and analysis
The basic soil chemical properties at all sites were measured at the beginning of the field experiment(Table 1). Soil pH was determined at a soil-to-water ratio of 1:2.5,and soil total N was measuredviathe Kjeldahl method. Soil samples were collected from the 0-20 cm soil layer of the sites under different treatments after the rice harvest,and the content of soil organic matter was measured using the potassium dichromate oxidation method (Lu 2000). The soil C stock (SCS;Mg C ha-1) of the 0-20 cm soil layer was calculated based on the soil organic carbon content and bulk density:
where Depth is soil depth (20 cm in this case),BD is soil bulk density (g cm-3),and SOC is soil organic carbon content (g kg-1).
At the full flowering stage of milk vetch,a 1.0 m2area in each plot was sampled randomly. Plant material was oven-dried at 75°C to a constant weight. Dried crop samples were subsequently ground,and the N concentration in the dry matter was determined by H2SO4-H2O2digestion and indophenol blue colorimetry. At rice maturity,the rice yield was determined by harvesting the rice in all plots.
2.4.CH4 and N2O fluxe observations
Annual soil CH4and N2O fluxes at the Hunan site were observed with the use of a static chamber gas chromatography technique (Raheemet al.2019). The size of the chamber base was 50 cm×50 cm and its height was 150 cm. Gas samples were collected four times with a 50-mL syringe from 9:00 a.m.to 11:00 a.m.at 10-min intervals. Measurements were taken every 3 to 5 days during the rice growth season,and a 10-day interval was used in the other time periods (i.e.,fallow season or green manure growth season). The CH4and N2O concentrations were determined with the use of gas chromatography (Agilent 7890A,Agilent Technologies,Santa Clara,CA,USA). The fluxes of CH4and N2O were calculated by this formula:
where F is the gas flux of the CH4or N2O (mg m-2h-1),ρis the CH4or N2O density at standard atmospheric pressure (g L-1),His the height of the chamber (m),Tis the temperature in the chamber (°C),Pis the atmospheric pressure (kPa),P0is the standard atmospheric pressure(kPa),anddc/dtis the rate of change in the CH4or N2O concentration in the chamber (ppm h-1).
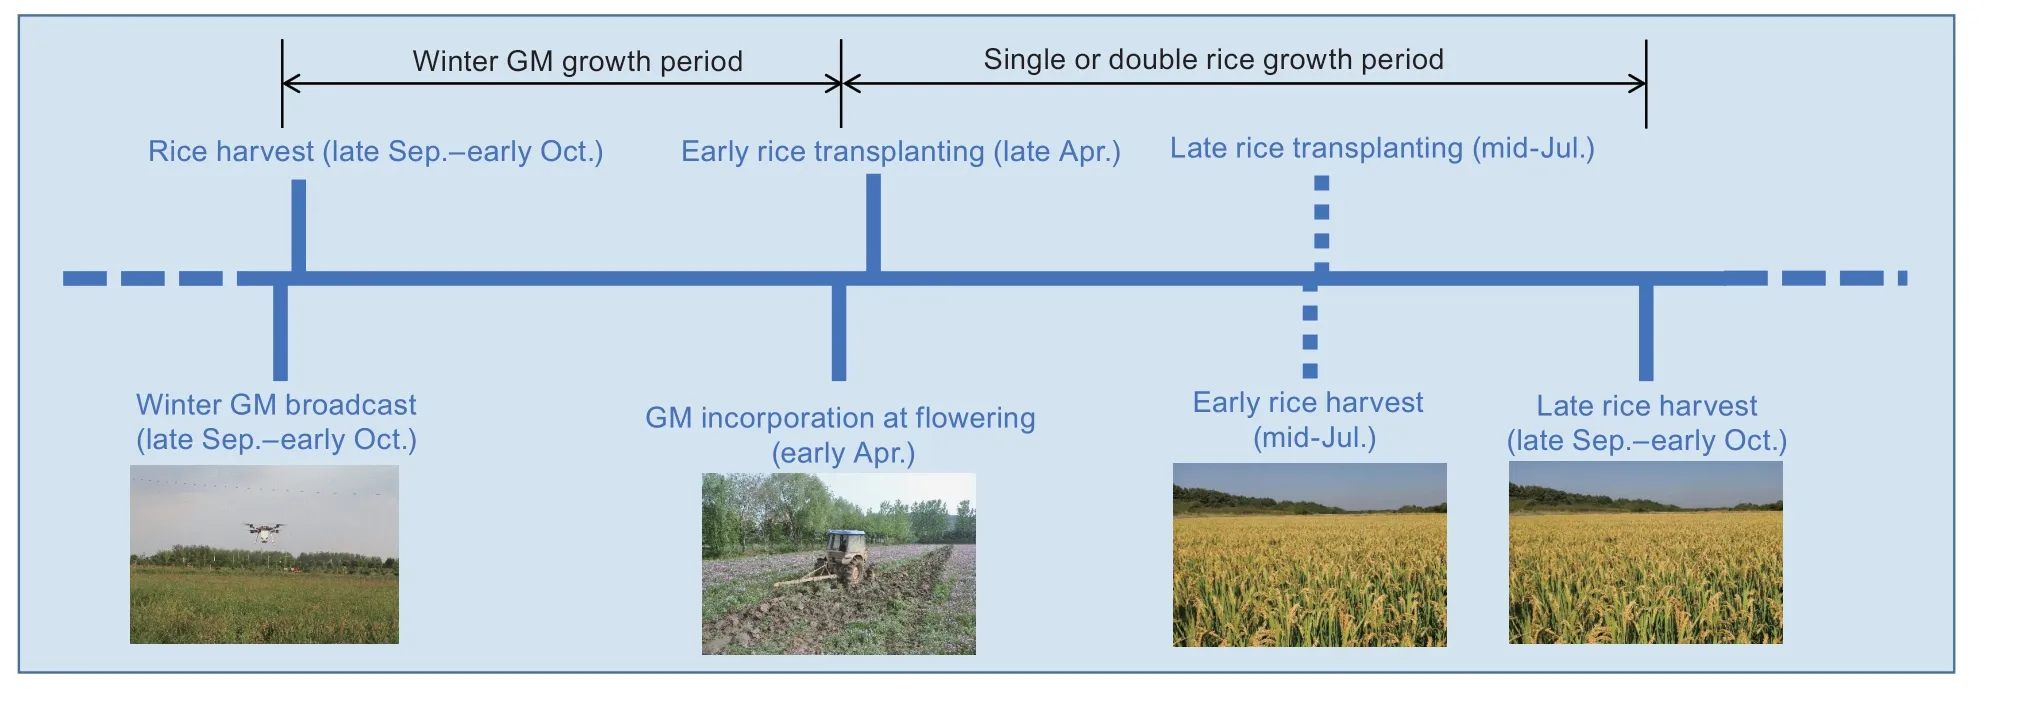
Fig. 1 Dates of sowing,transplanting,green manure incorporation,and harvesting of the green manure-rice rotation practices.GM,green manure.

Fig. 2 Soil organic carbon in the 0-20 cm soil layer of fallow-rice (A) and green manure-rice (B) practices,and the annual rice yields (C) at different sites in China. FP,fallow-rice practice under the farmer’s chemical N application rate (FNR);100%FG,green manure-rice practice with 100% FNR;80%FG,green manure-rice practice with 80% FNR;60%FG,green manure-rice practice with 60% FNR;40%FG,green manure-rice practice with 40% FNR. Error bars are SE (n=36,3,24,48,28,9,3,30 and 9,respectively). Different letters indicate significant difference between treatments at the level of P<0.05.
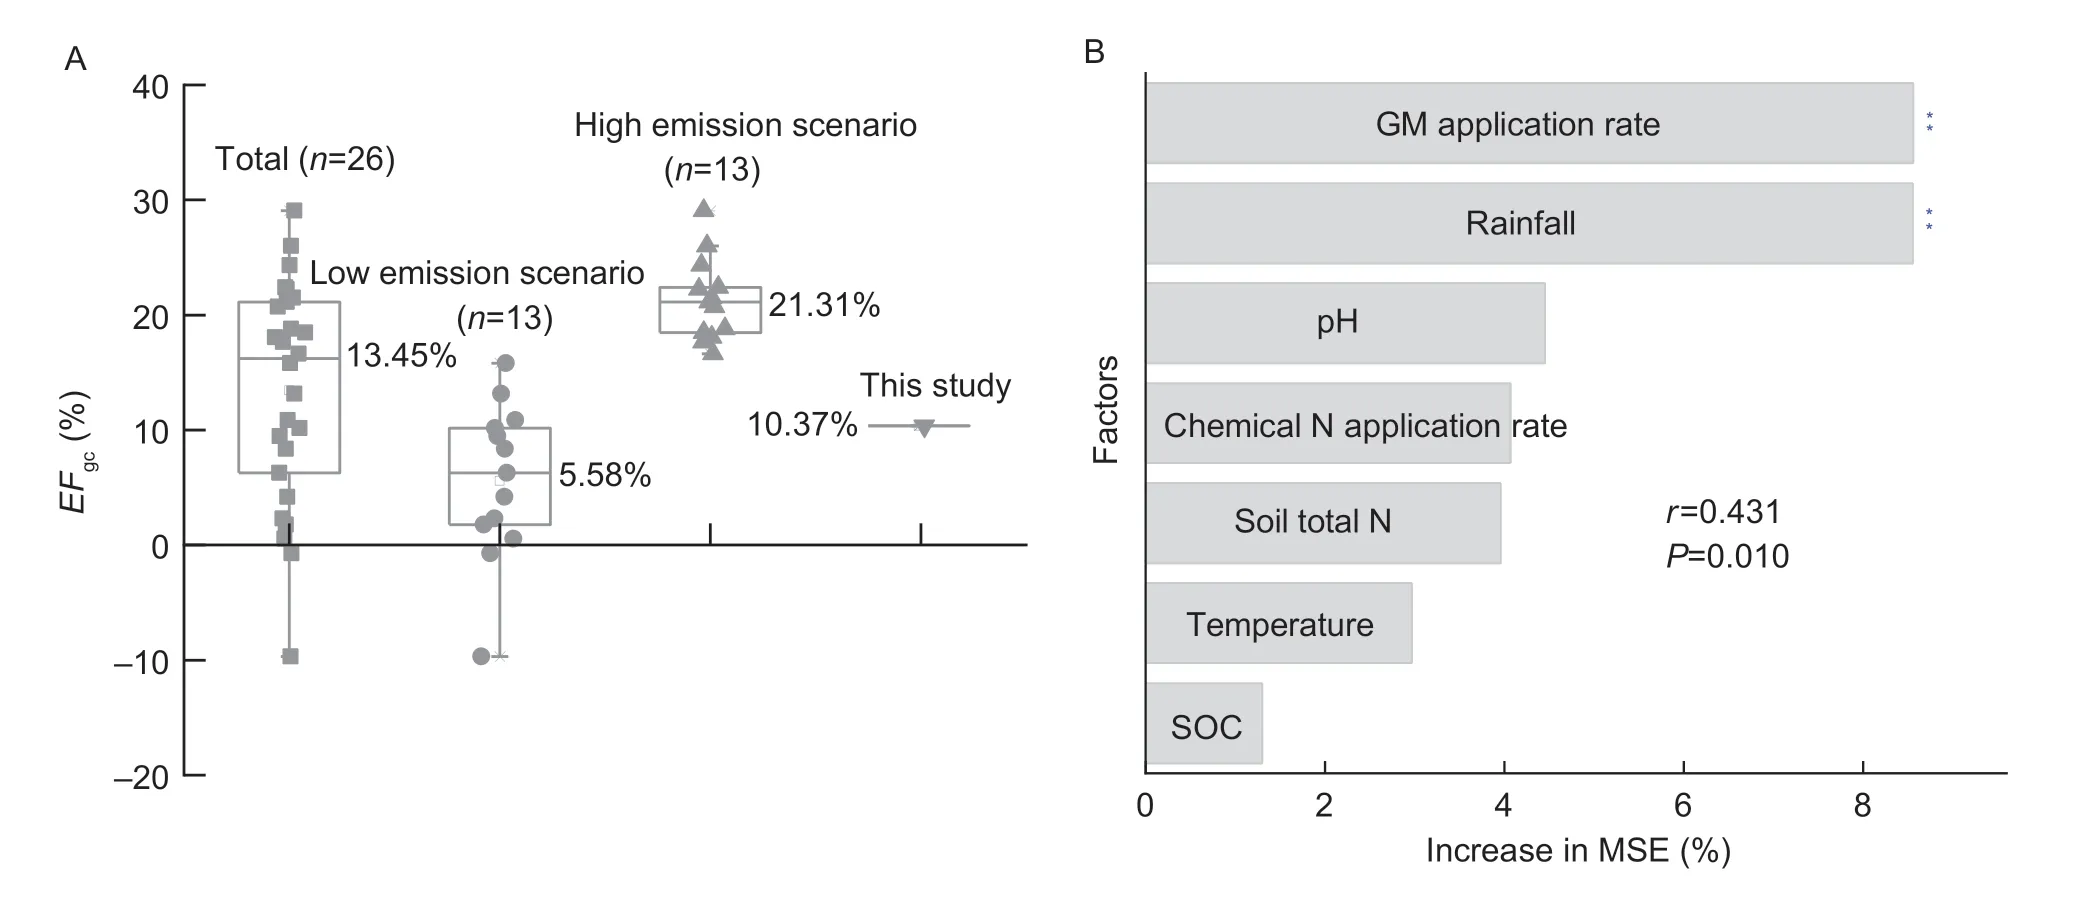
Fig. 4 The CH4 emission factor of green manure (EFgc) in different scenarios (A) and its main influencing factors (B). GM,green manure;SOC,soil organic matter. The figure shows the mean predictor importance (% of increase in mean square error (MSE))of climatic conditions,soil properties,and field management practices for EFgc as determined through Random Forest analysis. **represents significance at P<0.01.
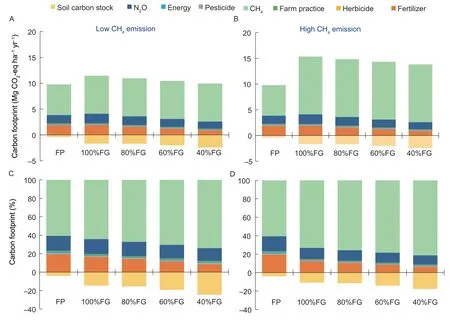
Fig. 5 Contributions of different emission sectors to the total carbon footprint under the different treatments in the low and high CH4 emission scenarios. FP,fallow-rice practice under the farmer’s chemical N application rate (FNR);100%FG,green manure-rice practice with 100% FNR;80%FG,green manure-rice practice with 80% FNR;60%FG,green manure-rice practice with 60% FNR;40%FG,green manure-rice practice with 40% FNR.
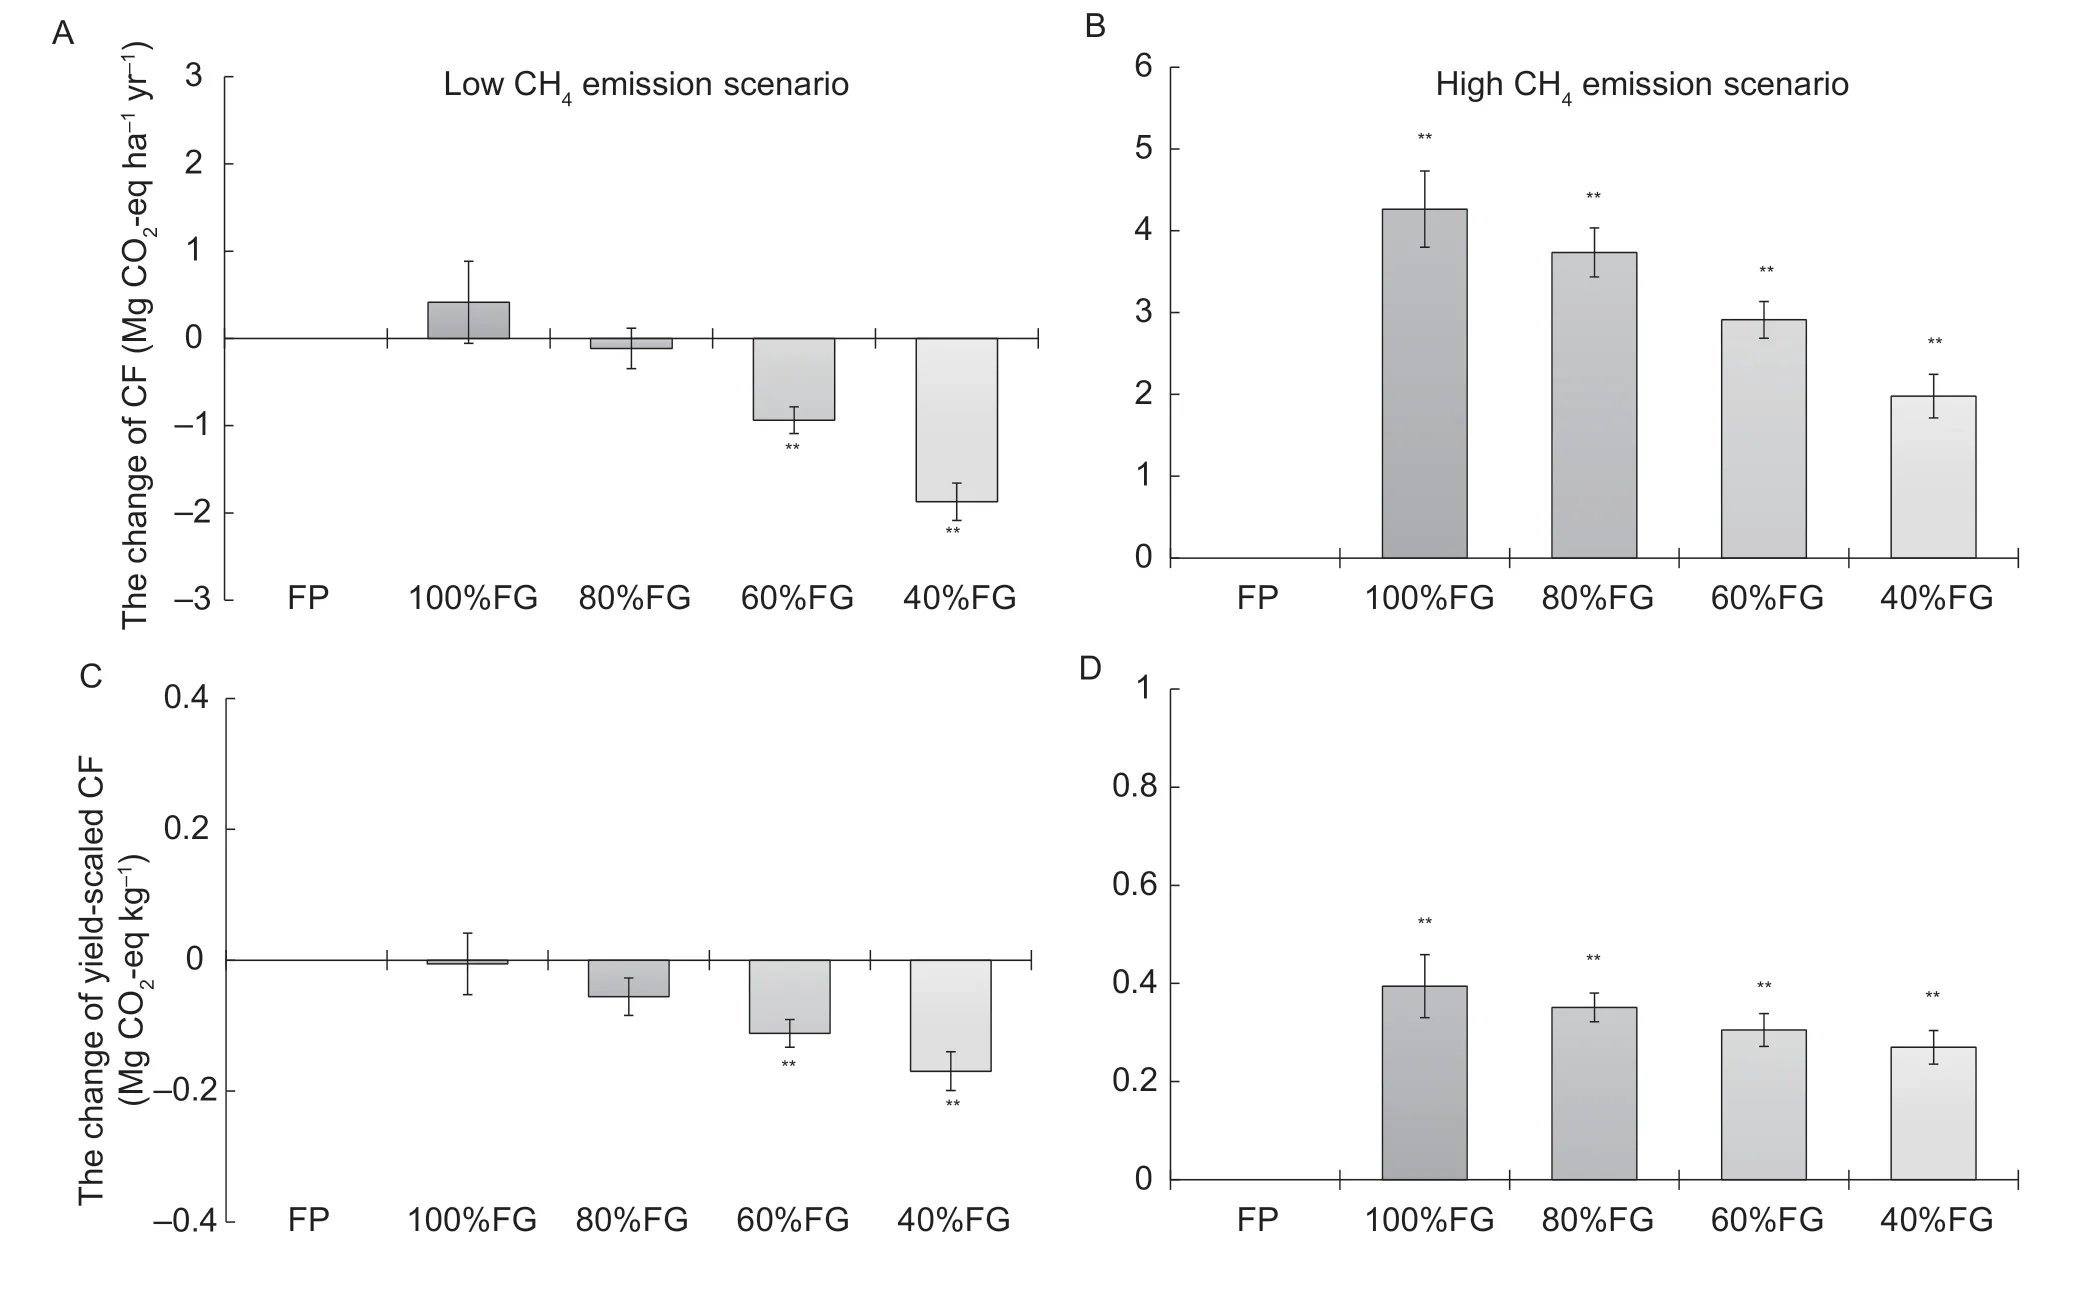
Fig. 7 Changes in carbon footprints (A and B) and yield-scaled carbon footprints (C and D) in the low and high CH4 emission scenarios (calculated on the basis of the difference in GM-rice and fallow-rice practices). FP,fallow-rice practice under the farmer’s chemical N application rate (FNR);100%FG,green manure-rice practice with 100% FNR;80%FG,green manure-rice practice with 80% FNR;60%FG,green manure-rice practice with 60% FNR;40%FG,green manure-rice practice with 40% FNR.Data are mean±SE (n=9). ** indicates that the change in CF was significantly greater than 0 at the significance level of P<0.01.
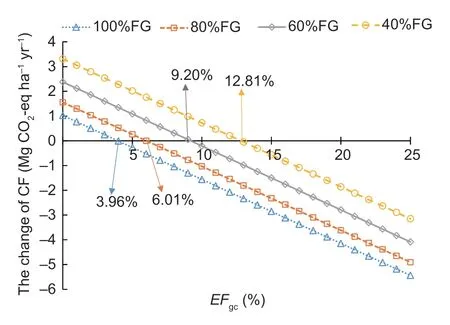
Fig. 8 Relationship between EFgc and changes in the carbon footprint. 100%FG,green manure-rice practice with 100%FNR;80%FG,green manure-rice practice with 80% FNR;60%FG,green manure-rice practice with 60% FNR;40%FG,green manure-rice practice with 40% FNR.
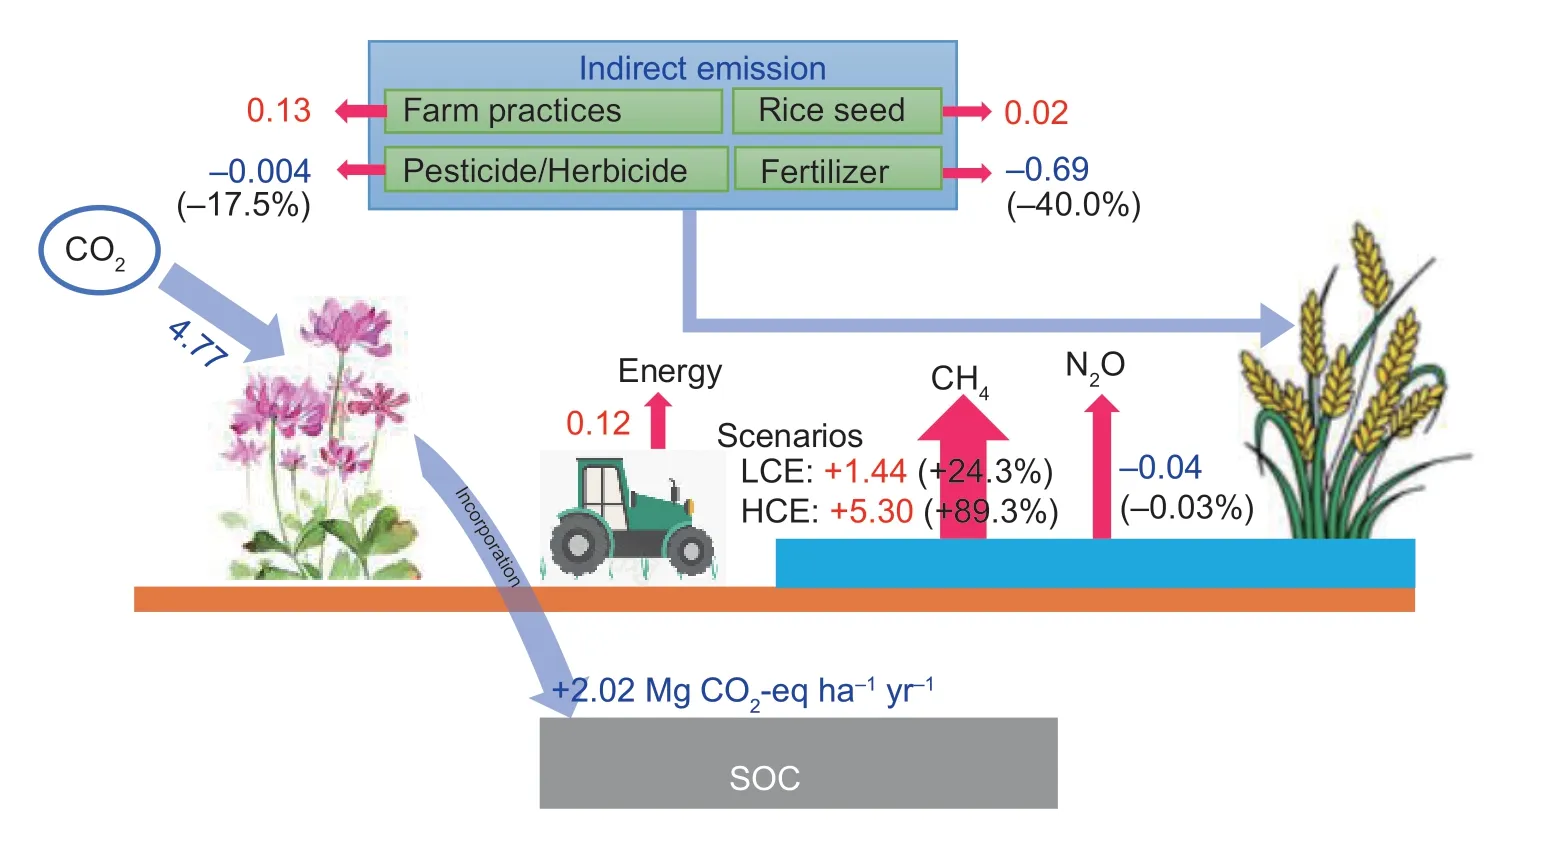
Fig. 9 Comparisons of carbon footprint emission inventories between FP (fallow-rice with the farmer’s N management) and 60%FG(green manure-rice practice with 60% FP chemical N fertilizer). LCE,low CH4 emission scenario;HCE,high CH4 emission scenario.+and -represent increments and decrements in CFs relative to the CF of the fallow-rice practice,respectively;the values in brackets are the percentages of increase or decrease in the CFs compared with the CF of the fallow-rice practice.
2.5.C footprint calculation
The direct emissions of CH4and N2O from the soil and under the different field management practices (tillage,transplanting,and fertilization),the indirect emissions of agricultural material production (fertilizers,pesticide,herbicide,and diesel fuel),and the change in the SOC stock were all included in the CF calculations,which were based on Caiet al.(2018). The total CF was calculated as follows:
whereCFtotalandYCFtotalare the total CF and yield-scaled CFs,respectively (kg CO2-eq ha-1yr-1);CFindirectandCFdirectare the indirect and direct CFs per year,respectively (kg CO2-eq ha-1yr-1);andCFsoilis the CF of the change in SOC stock (kg CO2-eq ha-1yr-1).
whereEFiis the emission factor (EF) of CF for agricultural materiali(kg CO2-eq kg-1),CAMiis the application rate of the agricultural material (kg ha-1yr-1),EFjis the EF for field management practicej(kg CO2-eq per time),andCFMjis the number of applications of field management practicej(times yr-1).
whereCFRis the application rate of chemical N fertilizer(kg N kg-1yr-1);EFcis the N2O EF from chemical N fertilizer (%);EFgnandEFgcare the N2O and CH4EFs of GM,respectively (%);andGgcandGgnare the total C and N amounts of GM,respectively (kg C ha-1or kg N ha-1).
whereΔCsoilis the change in soil C stock (kg CO2-eq ha-1yr-1),andRYis the number of rotation years.
The inventory of the agricultural material inputs and field management practices at the nine experimental sites is listed in Appendix A. The direct EF values of CH4and N2O from GM were estimated on the basis of the dataset from the meta-analysis (Section 2.6) by using the following equation:
whereEFgcandEFgnare the EFs of CH4and N2O from GM,respectively (%);EMgcandEMgnare the amounts of CH4and N2O emissions from the GM-rice practice,respectively (kg C ha-1or kg N ha-1);EMris the amount of CH4and N2O emissions from fallow-rice practices (kg C ha-1or kg N ha-1);andGgcandGgnare the total C and N amounts of GM,respectively (kg C ha-1or kg N ha-1),which were calculated based on the measured total C and N contents of GM at the different sites (Table 2). In this calculation,the GM-rice and rice practices must be under the same chemical N application rates.EFgcandEFgnwere estimated by conducting a meta-analysis,and the detailed information about that analysis is describedin following section. The EF of N2O for the chemical N fertilizers used in the rice practices is available in an article by Gaihreet al.(2020). The other EFs for agricultural material production,transportation,storage,field management practices,and electricity use are listed in Appendix B.
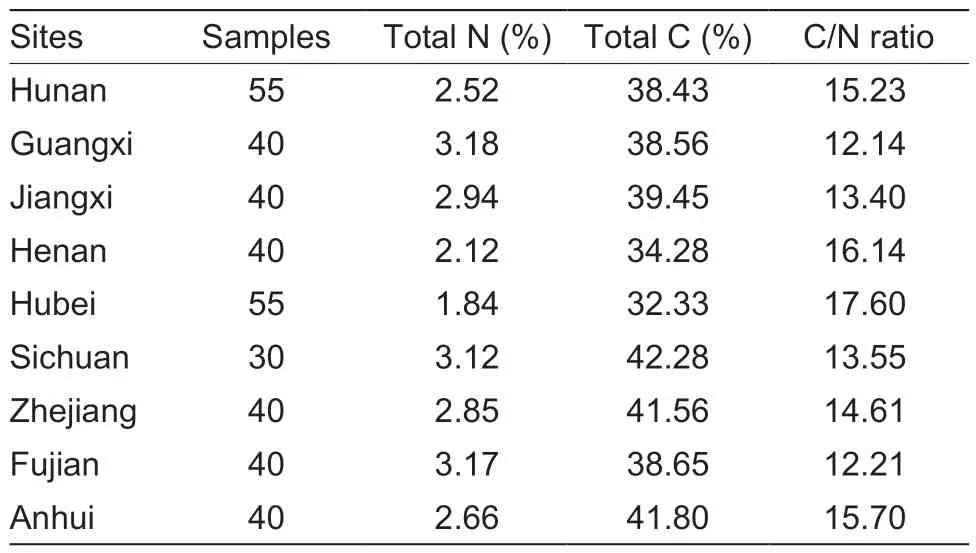
Table 2 Total C and N contents of green manure biomass at the different sites in southern China
2.6.Scenario analysis
The datasets on the CH4and N2O emissions of the fallowrice and GM-rice practices were extracted from published peer-reviewed papers and then used to calculateEFgcandEFgnwith eq.(7). The relevant published papers were identified using the keywords “rice”,“paddy soil”,“green manure”,“milk vetch”,“CH4”,and “N2O” to search ISI WoS (http://www.webofscience.com),ScienceDirect(http://www.sciencedirect.com),and CNKI (http://www.cnki.net). To be included in the analysis,a study must meet the following inclusion criteria: 1) included at least one year (or one season) of CH4(or N2O) emission data with more than three replications from field experiments;2) included fallow-rice and GM-rice practices with detailed information on the C and N inputs;and 3) used the chemical N application rates of the fallow-rice and GM-rice practices for theEFgncalculation. In addition to the CH4and N2O emissions,related information regarding soil properties,climatic conditions,and field management practices was collected to quantify the key factors using a Random Forest analysis (Cutleret al.2007).
A total of 27 values ofEFgcand eight values ofEFgnwere estimated based on the 12 published papers included after the screening (Table 3). Several studies reported that the CH4emission is the largest component of total CF emissions in rice systems,and it greatly exceeds the CF component from N2O emissions and other emission components (Kimet al.2013;Raheemet al.2019). The average value ofEFgnwas adopted in the CF calculation due to its relatively small contribution. The estimatedEFgcwas divided into two groups to analyze the uncertainty of CF in the high GHG emission scenario (EFgcvalues ranked in the top 50%) and the low GHG emission scenario (EFgcvalues ranked in the bottom 50%). The CF values of the different practices were calculated inboth the low CH4emission (LCE) and high CH4emission(HCE) scenarios. To further explore the potential of GM for CF reduction,a tradeoff analysis was conducted by calculating the total CF of GM-rice under extendedEFgcranges (0 to 25%). This analysis was used to identify the maximum thresholdEFgcvalue for reducing the total CF of the GM-rice systems.
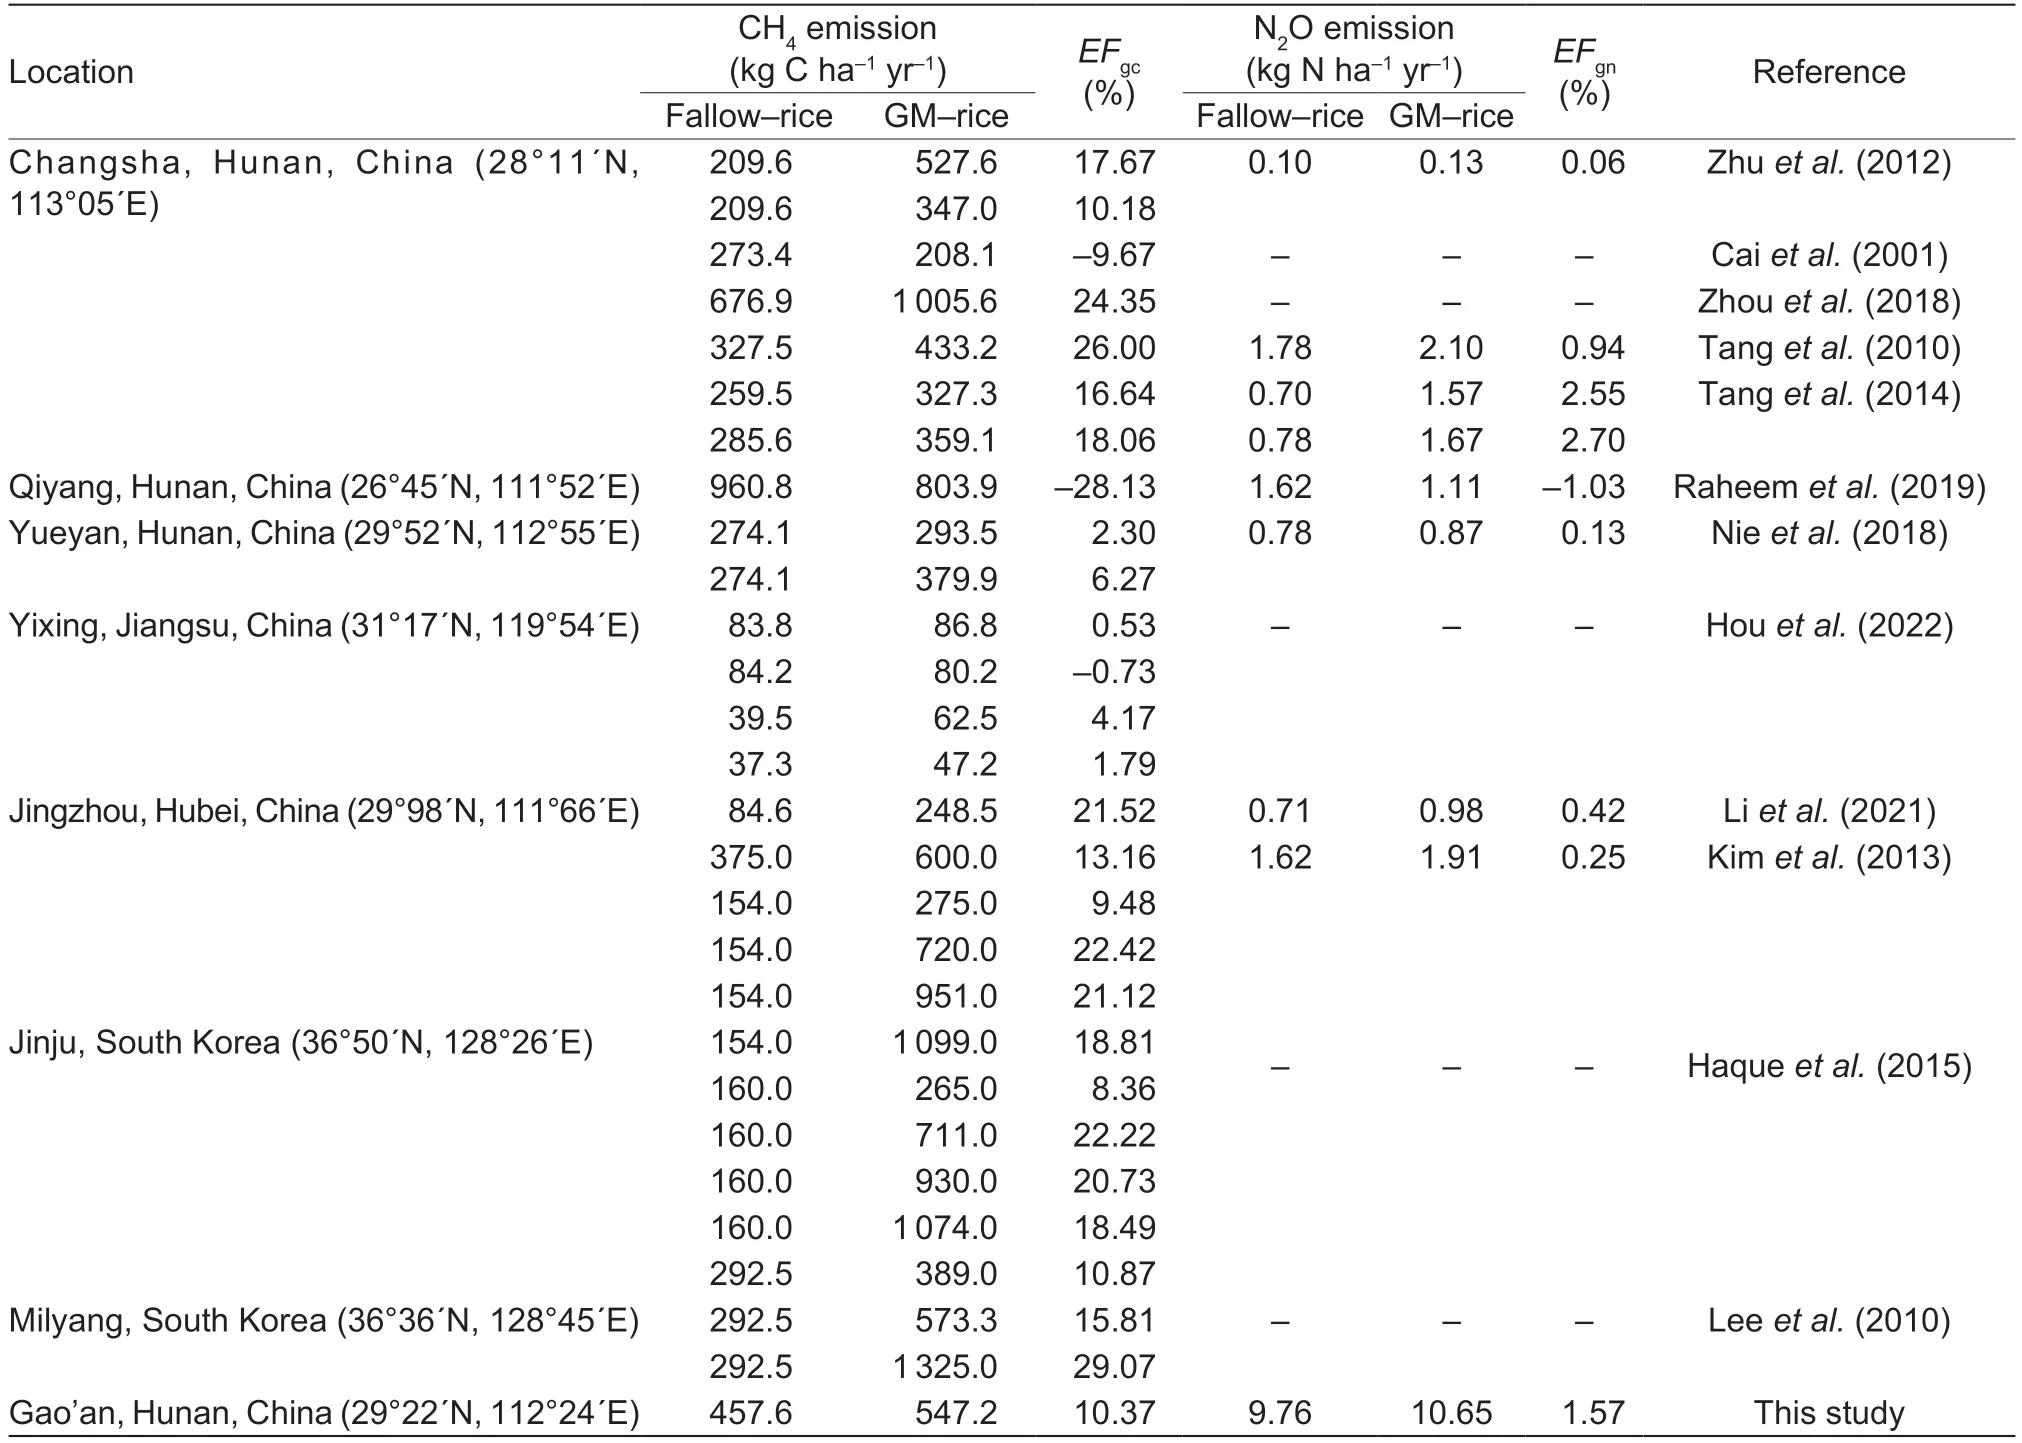
Table 3 Emission factors of green manure (EFgc and EFgn)1)
3.Results
3.1.SOC and yield
The relationships between rotation years and SOC in the fallow-rice and GM-rice practices are illustrated in Fig.2-A and B. The slope of the linear regression equation represents the annual rate of increase in SOC when there is a significant linear correlation. Overall,the SOC in the 0-20 cm soil layer increased with the increase in rotation years at rates of 0.0139 and 0.2211 g kg-1yr-1in the fallow-rice and GM-rice practices,respectively. A significant linear correlation between rotation years and SOC was found only in the GM-rice practices under 13 years of the continuous application of GM (P=0.0087)but not in the fallow-rice practice (P=0.9097). The soil C stock of the GM-rice practice significantly increased by approximately 0.442 Mg C ha-1yr-1and was substantially greater than that of the fallow-rice practice (Fig.2-A and B). The slopes of the linear regression equations for the 100%FG,80%FG,60%FG,and 40%FG treatments are 0.2381,0.1765,0.2077,and 0.2621 g kg-1yr-1,respectively (Appendix C). However,no significance was found between the different treatments,and theirP-values varied from 0.1167 to 0.2572. These results indicated that the chemical N application rate has a limited effect on soil CS in the GM-rice practices.
Rice yields show large variations at the different sites under the different treatments (Fig.2-C). In general,the annual rice yield in double rice systems (12 229 kg ha-1) was higher than that of single rice systems (8 491 kg ha-1). At the different sites,the average yields under the FP,100%FG,80%FG,60%FG,and 40%FG treatments were 9 622,10 202,9 950,9 716,and 9 195 kg ha-1,respectively. Compared with the FP treatment,the rice yield in GM with a 40% reduction in chemical N fertilizer inputs was maintained or increased slightly. A 60%reduction in chemical N fertilizer inputs significantly reduced the yields at the five sites (Fig.2-C). These results demonstrated that in a specific study region,GM can replace nearly 40% of the chemical N fertilizer inputs without compromising rice yield.
3.2.Annual CH4 and N2O fluxes
Fig.3 shows the annual CH4and N2O fluxes of the fallowrice and GM-rice practices at the Hunan site from April 2021 to April 2022. The total annual CH4(or N2O) emission was approximately 457.6 (or 9.76) and 547.2 (or 10.65)kg C (or N) ha-1for the fallow-rice and GM-rice practices,respectively. Most of the GHG emissions occurred during the rice growth period for both fallow-rice and GM-rice practices,accounting for 99.3 and 57.1% of the total annual CH4and N2O emissions,respectively. Compared with the fallow-rice practice,GM shows increases in the CH4and N2O emissions by 64.4 and 15.3% during the early stage of the rice growth period,while there were no significant increases found during the late rice growth period. These results indicated that incorporating the GM leads to high CH4emissions in the GM-rice practice.
3.3.CH4 emissions and governing factors
Under the effects of soil type,climate,and field management,the values ofEFgcshowed large variations in the reviewed studies,and ranged from -9.67 to 26.00%with an overall average of 13.45% (Fig.4-A).EFgcwas considerably higher thanEFgn(from -1.03 to 2.70%),indicating its importance for reducing GHG emissions(Table 3). The averageEFgcvalues were 5.58 and 21.31% in the LCE and HCE scenarios,respectively.These results indicated that 5.58 and 21.31% of the C in GM was released in the form of CH4in the LCE and HCE scenarios,respectively. In this study,the calculatedEFgcis 10.37%,which is within the range of the LCE scenario. The variation inEFgcwas mainly regulated by GM application rates and annual rainfall at the experimental sites. GM application rates and rainfall had mean predictor importance values of 8.55 and 8.56%,respectively (Fig.4-B). Compared with these two items,other factors (including pH,chemical N application rate,soil total N,annual temperature,and SOC) showed lesser importance withP>0.05 (Fig.4-B). These results indicated that CH4emission in the GM-rice practice is mainly governed by GM application rates and rainfall.
3.4.Emission inventories of CF
Emission inventories and their contributions to the total CF are illustrated in Fig.5. In the LCE scenario,the total CFs of the FP,100%FG,80%FG,60%FG,and 40%FG treatments were 9.38,9.80,9.27,8.45,and 7.51 Mg CO2-eq ha-1yr-1,respectively. GM with the reduced chemical N fertilizer inputs (80%FG,60%FG,and 40%FG treatments) showed reduced CFs in the GM-rice practices relative to those in the fallow-rice practice. Compared with those in the LCE scenario,the CFs increased by approximately 39.4,41.7,45.7,and 51.3% under the 100%FG,80%FG,60%FG,and 40%FG treatments in the HCE scenario,respectively,due to the increases in CH4emissions (Fig.5-A and B). In the HCE scenario,the CF of the GM-rice practice (12.61 Mg CO2-eq ha-1yr-1) was considerably higher than that of the fallow-rice practice(9.38 Mg CO2-eq ha-1yr-1).
Direct CH4emission is the largest emission component,accounting for 60.7-81.3% of the total CF in the different scenarios (Fig.5-C and D). GM increased the CH4emissions of the rice systems in the LCE and HCE scenarios by approximately 24.2 and 89.3%,respectively,and thereby increased the CF of the CH4emission.Indirect emission from fertilizers and direct N2O emissions were the other two major emission components in the LCE (or HCE) scenario and accounted for 8.7-19.4% (or 6.3-19.4%) and 13.8-16.1% (or 9.9-16.1%) of the total CF,respectively (Fig.5-C and D). Indirect emissions from fertilizer production,transportation,and storage decreased with the incremental reductions in chemical N application in the GM-rice practices,and it was reduced from 1.90 Mg CO2-eq ha-1yr-1under the FP treatment to 0.87 Mg CO2-eq ha-1yr-1under the 40%FG treatment (Fig.5-A and B). The CFs of direct N2O emissions under the FP,100%FG,80%FG,60%FG,and 40%FG treatments were 1.58,1.85,1.69,1.53,and 1.37 Mg CO2-eq ha-1yr-1,respectively. Therefore,GM with a reduction of 40% in chemical N fertilizer inputs can reduce the CF of direct N2O emissions from rice production systems.Other emission sources,including rice seeds,pesticide/herbicide,diesel fuel/combustion,electricity,and farm practices,only contributed less than 3.8% of the total CF. In contrast to the fallow-rice practice,the GM-rice practices enhanced the soil C stock and thereby reduced the CF (Fig.2-B). In the LCE (or HCE) scenarios,the increments in the soil C stock offset 4.1 (or 4.1),14.6 (or 10.9),15.5 (or 11.5),19.3 (or 14.1),and 24.6% (or 17.7%)of the total CFs under the FP,100%FG,80%FG,60%FG,and 40%FG treatments,respectively (Fig.5-C and D).
3.5.CF and yield-scaled CF
The CF and yield-scaled CF varied across the nine experimental sites (Fig.6). The differences in CF between the GM-rice practices (FG treatments) and the fallow-rice practice (FP) reflected the effects of long-term GM on CF and yield-scaled CF (Fig.7). The CH4emission scenarios and N management practices had great effects on the CF and yield-scaled CF in the rice systems. In the LCE scenario,GM with a 40-60%reduction in chemical N fertilizer inputs significantly decreased CF and yield-scaled CF by 0.94-1.87 Mg CO2-eq ha-1yr-1and 0.11-0.17 Mg CO2-eq kg-1,respectively,compared with the fallow-rice practice. No significant difference was found between the 100%FG and 80%FG treatments (Fig.7-A and C). However,in the HCE scenario,the CF and yield-scaled CF of the GM-rice practices were significantly higher than those of the fallow-rice practice. The changes in CF and yieldscaled CF decreased with the incremental decreases in chemical N application rates,and ranged between 1.98-4.26 Mg CO2-eq ha-1yr-1and 0.27-0.39 Mg CO2-eq kg-1,respectively (Fig.7-C and D). These results suggested that in the rice system,EFgcand chemical N application rates should be reduced to achieve high rice yields with low CF.
3.6.Relationships between EFgc and CF
Based on the differentEFgcvalues,the relationships between theEFgcand the change in CF are shown in Fig.8. The CF decreases linearly with the increasingEFgcvalues,and the intersection with thex-axis represents the threshold point (EFgc_t) for reducing the total CF of the GM-rice system. The values ofEFgc_tincreased with an increase in the chemical N application rate,which ranges from 3.96 to 12.81% under the different GMrice practices. The total CF of the GM-rice system is smaller than that of the fallow-rice practice when the actual emission factor is smaller thanEFgc_t. Therefore,to reduce the total CF while maintaining a high yield,theEFgcvalues should be less than 9.20,6.01,and 3.96% for 60%FG,80%FG,and 100%FG,respectively.
4.Discussion
4.1.Soil C sequestration of the GM-rice practices
On the basis of long-term multisite experiments,we found that replacing winter fallow with GM has great potential for increasing soil CS by the paddy soils in China. In this study,the SOC concentration and stocks increased at rates of 0.221 g kg-1yr-1and 0.442 Mg C ha-1yr-1,respectively (Fig.2). These rates of increase are slightly higher than those reported for upland soil in previous studies based on the global meta-analysis.Poeplau and Don (2015) and Jianet al.(2020) reported SOC stock changes during the first decades of GM,with mean rates of 0.32 and 0.37 Mg C ha-1yr-1(0-20 cm topsoil). Previous studies found that GM increased the physical fractionation of SOC and the C contents in the light fractions of SOC (Dinget al.2006;Nascenteet al.2013). Flooding and anaerobic conditions in paddy systems may reduce the decomposition rate of GM and increase the formation of water-stable aggregate fractions,and thus increase soil CS (Yanget al.2014).Moreover,the application of GM significantly increases soil macroaggregation and thereby enhances intraaggregate SOC sequestration in paddy soils (Kamranet al.2021;Zhanget al.2023). The rate of increase in the GM-rice practice found in this work is similar to the findings obtained under organic farming. For example,Gattingeret al.(2012) documented that soil CS rates under organic farming were approximately 0.45 Mg C ha-1yr-1and significantly higher than those under nonorganic management. These results indicate that GM is important for soil CS in paddy soils.
Leguminous GM not only improves SOC and soil structure but it also supplies N nutrition to the succeeding crops (Maet al.2021). Compared with the fallow-rice practice,the GM-rice practice significantly increased crop yield in the study sites even under a 40% reduction in chemical N fertilizer inputs (Fig.2-C). These findings are also supported by the results of several long-term experiments and meta-analyses (Suginoet al.2013;Maet al.2021). The results of this study further indicated that in rice systems,long-term GM can significantly enhance SOC and maintain crop yield while reducing chemical N fertilizer use by 40%.
4.2.GHG emission of GM-rice practices
CH4emissions account for 89% of the global warming potential (GWP) of lowland rice systems and provide the largest contribution because rice is cultivated under continuous flooding in these systems (Linquistet al.2012;Haqueet al.2015a;Hwanget al.2017). GM incorporation increases SOC,but it also significantly increases GWP by approximately 4.5 times because CH4emission is stimulated in an anaerobic environment(Hwanget al.2017). The contribution of CH4emissions to the total GWP of the fallow-rice practice (34-39%)was found to be significantly lower than that to the total GWP of the GM-rice practice (88-91%) (Haqueet al.2015a). Either no significant difference or relatively small differences compared with CH4emissions were found in N2O emissions between fallow-rice and GMrice practices (Raheemet al.2019;Liet al.2021).Our findings are similar to previously reported results.Specifically,CH4emissions accounted for 60.7-81.3%of the total CF in the different scenarios and were considerably larger than the other sectors in this study.GM increased the CH4emissions of rice systems in the LCE and HCE scenarios by approximately 24.2 and 89.3%,respectively (Fig.5). However,in the GM-rice practices,a slight reduction in N2O was observed under GM due to the reduction in chemical N fertilizer inputs.Hence,exploring the best management practices for lowering CH4emissions is crucial for reducing the total CF of GM-rice practices.
4.3.lmplications for reducing CF
As discussed above,GM with 60% of the farmers’standard N fertilizer application (60%FG treatment)maintained high crop yields with reduced total CF in the LCE scenario. The indirect emissions from pesticide/herbicide and fertilizer inputs under the 60%FG treatment decreased by 17.5 and 40%,respectively,relative to those in the fallow-rice practice (Fig.9). GM improves soil health and performs multiple ecosystem services (Wood and Bowman 2021) that enhance soil microbial diversity and decrease the abundance and diversity of weeds,thereby reducing the use of pesticides and herbicides(Shackelfordet al.2019;Kimet al.2020). The CFs of direct CH4emissions increased by 1.44 Mg CO2-eq ha-1yr-1(24.3%) and by 5.30 Mg CO2-eq ha-1yr-1(89.3%) in the LCE and HCE scenarios,respectively. In the LCE scenario,the increase in soil CS (2.02 Mg CO2-eq ha-1yr-1) can offset the increase in the CF of GM-derived CH4emissions. As a result,the reduced CF from the indirect emissions of agricultural inputs and the increased soil CS cannot easily provide a tradeoff for the increased CF of GM-derived CH4whenEFgcis greater than 9.20% (Fig.8).
After GM incorporation,nearly 5.58 and 21.31% of the C in GM was released in the form of CH4in the LCE and HCE scenarios,respectively,under the main driving factors of GM application rates and rainfall (Fig.4). These results are supported by the findings of other previous studies. For example,Haqueet al.(2013,2015b) found thatEFgcincreased from 9.5 to 18.8% when fresh GM application rates were increased from 9 to 36 t ha-1. A significant concave parabolic relationship was found to exist between GM application rates and CH4emissions,i.e.,CH4emission dramatically increased when the fresh GM application rates exceeded approximately 10 t ha-1(Caiet al.2001). Rainfall or drainage events directly affect field moisture which then regulates CH4emissions in paddy soils (Tariqet al.2017,2018;Leeet al.2020). GM increases soil fertility and rice yields without increasing CH4emissions in some regions under single rice systems because these systems have lower rainfall and better field moisture management conditions than fallow-rice practices (Houet al.2022). Maintaining short-term dry soil conditions after GM incorporation significantly reduces the CH4emissions of paddy soils.In one study,the cumulative CH4emission was reduced by more than 60.5% over 10 days of aerobic conditions(Leeet al.2020). Several studies have also suggested that preplanting and midseason drainage in flooded rice systems can reduce straw-derived CH4emissions by more than 69%,and that the increase in N2O emissions due to drainage has a limited contribution to the total GWP (Tariqet al.2017,2018). The results of this study suggested that the appropriate GM application rate and drainage pattern should be further explored to reduce the GM-derived CH4emissions of GM-rice practices for achieving high rice yields with low CF in China.
5.Conclusion
The use of GM significantly increased the CS rate of paddy soils by 0.442 Mg C ha-1yr-1(or 1.62 Mg CO2-eq ha-1yr-1),and reduced chemical N fertilizer inputs by 40%without compromising the rice yield. The CH4emission accounted for 60.7-81.3% of the total CF. After the GM was incorporated,nearly 5.58 and 21.31% of the C in GM was released in the form of CH4in the LCE and HCE scenarios,respectively. The GM application rates and rainfall are the major factors that affect theEFgcof GM.The increase in soil CS can offset all the increase in CF that is contributed by GM-derived CH4emissions in the LCE scenario. Thus,the reduction in CF that resulted from the indirect agricultural input emissions and the increase in soil CS cannot offset the increase in CF from GM-derived CH4emissions whenEFgcis greater than 9.20%. The results of this study indicated that using the optimal field management pattern is the key to achieving high rice yields with low CF in the HCE scenario.
Acknowledgements
This study was supported by the National Key Research and Development Program of China (2021YFD1700200)and the earmarked fund for China Agriculture Research System (CARS-22). We thank Dr.Nie Jun from Hunan Academy of Agricultural Sciences,Dr.Xu Changxu from Jiangxi Academy of Agricultural Sciences,Dr.Wu Ji from Anhui Academy of Agricultural Sciences,Dr.Liu Chunzeng from Henan Academy of Agricultural Sciences,Dr.Lü Yuhu from Xinyang Institute of Agricultural Science,Dr.Huang Yibin from Fujian Academy of Agricultural Sciences,Dr.Geng Mingjian from Huazhong Agricultural University,Dr.Wang Jianhong from Zhejiang Academy of Agricultural Sciences,Dr.He Tieguang from Guangxi Academy of Agricultural Sciences,and Dr.Han Wenbin from Nanchong Institute of Agricultural Science for their help in field experiment management and sampling.
Declaration of competing interest
The authors declare that they have no conflict of interest.
Appendicesassociated with this paper are available on https://doi.org/10.1016/j.jia.2022.12.005
 Journal of Integrative Agriculture2023年7期
- Journal of Integrative Agriculture的其它文章
- Understanding changes in volatile compounds and fatty acids of Jincheng orange peel oil at different growth stages using GC-MS
- Untargeted UHPLC-Q-Exactive-MS-based metabolomics reveals associations between pre-and post-cooked metabolites and the taste quality of geographical indication rice and regular rice
- A double-layer model for improving the estimation of wheat canopy nitrogen content from unmanned aerial vehicle multispectral imagery
- lmprovement of soil fertility and rice yield after long-term application of cow manure combined with inorganic fertilizers
- A novel short transcript isoform of chicken lRF7 negatively regulates interferon-β production
- Whole genome SNPs among 8 chicken breeds enable identification of genetic signatures that underlie breed features