Identification of key genes underlying clinical features of hepatocellular carcinoma based on weighted gene co-expression network analysis and bioinformatics analysis
ZHANG Kan, LONG Fu-li, LI Yuan, SHU Fa-ming, YAO Fan, WEI Ai-Ling
The First Affiliated Hospital of Guangxi University of Chinese Medicine, Nanning 530023, China
Keywords:
ABSTRACT
1.Introduction
Hepatocellular carcinoma (HCC) is the world's most common and one of the most aggressive malignant tumor [1].The incidence of HCC and its resulting mortality are increasing every year [2].At present, HCC has become one of the three common causes of cancer-related deaths worldwide [3].Viral hepatitis, alcoholic and non-alcoholic fatty liver disease are closely associated with HCC [4].In China, chronic viral hepatitis B and aflatoxin are the most important factors leading to the high incidence of HCC.In developed countries, it is mostly associated with alcoholic and non-alcoholic steatohepatic diseases [5].Early HCC has no obvious clinical symptoms, and 70%-80% of patients are already in the middle and late stages of disease progression when diagnosed [6,7].Therefore, to further study the pathogenesis of HCC and analyze the changes at the molecular level, so as to provide reliable biomarkers for early disease screening is one of the urgent problems to be solved in HCC.
In recent years, the rapid development of high-throughput sequencing technology and bioinformatics research has provided important ideas for human research on various diseases [8,9].Bioinformatics analysis of microarray data of effective and rapid processing of a large number of data sets[10] are made to be able to identify differentially expressed genes (DEGs) of HCC.Bioinformatics analysis has been widely used to explore the potential molecular mechanisms of HCC and reveal the key genes and signaling pathways involved[11-14].Bioinformatics methods can be used to process and analyze massive data, which can more accurately observe the changes of disease gene profile, so as to determine key biomarkers and provide targets for early clinical diagnosis and drug trials[13].Weighted gene co-expression network analysis (WGCNA)can effectively detect the complicated relationship between gene modules and disease characteristics, thus identified is closely related to the clinical features of gene modules (15-17).Based on this,this study used gene expression database (GEO) to analyze HCC differential genes and WGCNA to identify key module genes, and used maximal clique centrality (MCC) algorithm to screen key genes.To provide reference direction for early clinical diagnosis and treatment.
2.Materials and methods
2.1 Data Sources
The chip data of Hepatocellular carcinoma were retrieved in GEO database.After reading and screening one by one, GSE84598 microarray data set was downloaded as HCC differential gene expression data [18].The microarray dataset was analyzed based on the GPL10558 platform file and contained expression data from 22 HCC tissue samples and 22 normal liver tissue samples from the Medical School of the University of Mainz in Germany.
2.2 Screening of DEGs
The expression data were preprocessed by R language, and the HCC group was set as the experimental group and the normal group as the control group.After preprocessing the data using R language further analysis, same to |LogFC|>2 and P<0.05 for screening threshold, the normal group and experimental group of filtered DEGs.At the same time, volcano maps and heat maps were drawn to visualize the results.
2.3 Weighted gene co-expression network analysis
The R language "WGCNA" package was used to construct the gene co-expression network from the standardized gene data, and the optimal soft threshold was determined.The scale-free network was constructed according to the optimal soft threshold, and then the genes were clustered into functional modules with different colors.The dynamic tree cutting algorithm was used for clustering and classification.
2.4 Analysis and identification of key modules
Gene significance (GS) represents the correlation between genes and traits, while module membership (MM) represents the correlation between module feature vectors and gene expression profiles.Combined with indicators GS and MM, Pearson algorithm was used to analyze the correlation between modules and clinical features, and the module with the greatest correlation with HCC clinical features was selected as the key module of this study.
2.5 Enrichment analysis
DEGs obtained in Step 1.2 and core genes of key modules obtained in step 1.4 were intersected as candidate hub genes.GO and KEGG enrichment analysis of candidate hub genes was performed using R language to elucidate key biological functions and signaling pathways of HCC.
2.6 Construction of protein interaction network and screening of hub genes
Candidate hub genes were imported into STRING database for protein interaction analysis, and the results were exported in "TCV"format.Import the TSV file into Cytoscape software and analyze the protein interaction network using the Cytohubba plug-in of the software.According to MCC algorithm, the five genes with the highest scores were selected and defined as hub genes.
2.7 Expression verification of hub genes
Differential gene expression data between HCC tissues and normal liver tissues were retrieved from the cancer genome atlas(TCGA) and the genotype tissue expression (GTEx) databases.The expression of hub genes was compared.
2.8 Prognostic analysis of hub genes
The Kaplan-Meier Plotter online database was used to analyze the prognosis of hub genes in HCC, evaluate whether the expression of hub genes has an impact on the survival of HCC patients, and draw a survival curve.
3.Results
3.1 Screening of DEGs
The data of GSE84598 chip were collated and analyzed by R language, and a total of 6 262 DEGs were obtained, among which 2207 were up-regulated and 4055 were down-regulated.Volcano maps and heat maps were drawn to visualize the data, as shown in Figure 1A-1B.

Fig1 Visualization of DEGs
3.2 WGCNA is used to construct a co-expression module
Using scale-free network and topological overlap, sample clustering tree was constructed based on dynamic mixed cutting (Figure 2A).Based on the scale-free topology criterion, the optimal soft threshold β=11 was determined according to the fitting index and the average degree of network connection (Figure 2B, C).According to the optimal soft threshold, the gene modules were divided, the number of genes in the minimum module was set to 100, and the shear height was set to 25%.A total of 4 modules were obtained, and the module cluster tree was drawn (Figure 2D).
3.3 Analysis and identification of key modules
The correlation between the building modules and clinical features was analyzed, and the heat map was drawn (Figure 3A).As shown in the figure, the turquoise module was most closely associated with HCC (r=0.8, P=6e-11).Taking MM>0.8 and GS>0.5 as thresholds,core genes closely related to HCC were further screened from the cyan module (Figure 3B).
3.4 Enrichment analysis
A total of 120 genes were obtained by extracting genes in the cyan module.Through the online database Venny 2.1, the genes in the cyan module were intersected with DEGs, and a total of 115 overlapping genes were obtained.In this study, these 115 genes were defined as candidate hub causes.Then, GO enrichment analysis and KEGG enrichment analysis were performed for candidate hub genes, and a loop diagram was constructed to visualize the enrichment results (Figure 4A-4B).As can be seen from Figure 4,Candidate hub genes were mainly mitotic nuclear division, nuclear division, organelle fission, chromosome segregation and mitotic sister chromatid segregation and other biological functions, oocyte meiosis, cell cycle, progesterone-mediated oocyte maturation,p53 signaling pathway, human Signalling pathways such as an immunodeficiency virus 1 infection are closely related.
3.5 Construction of protein interaction network and screening of hub genes
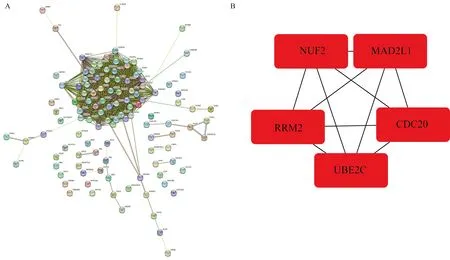
115 candidate hub genes were imported into the STRING database to construct the protein protein interaction network (PPI) (Figure 5A).The top 5 hub genes, namely NUF2, RRM2, UBE2C, CDC20 and MAD2L1, were calculated based on the MCC using the cytoHubba plugin (Figure 5B).

Fig2 Sample clustering and soft threshold screening

Fig3 Key modules and core genes associated with HCC clinical features

Fig4 Enrichment analysis

Fig5 Protein interaction analysis
3.6 Hub gene expression verification
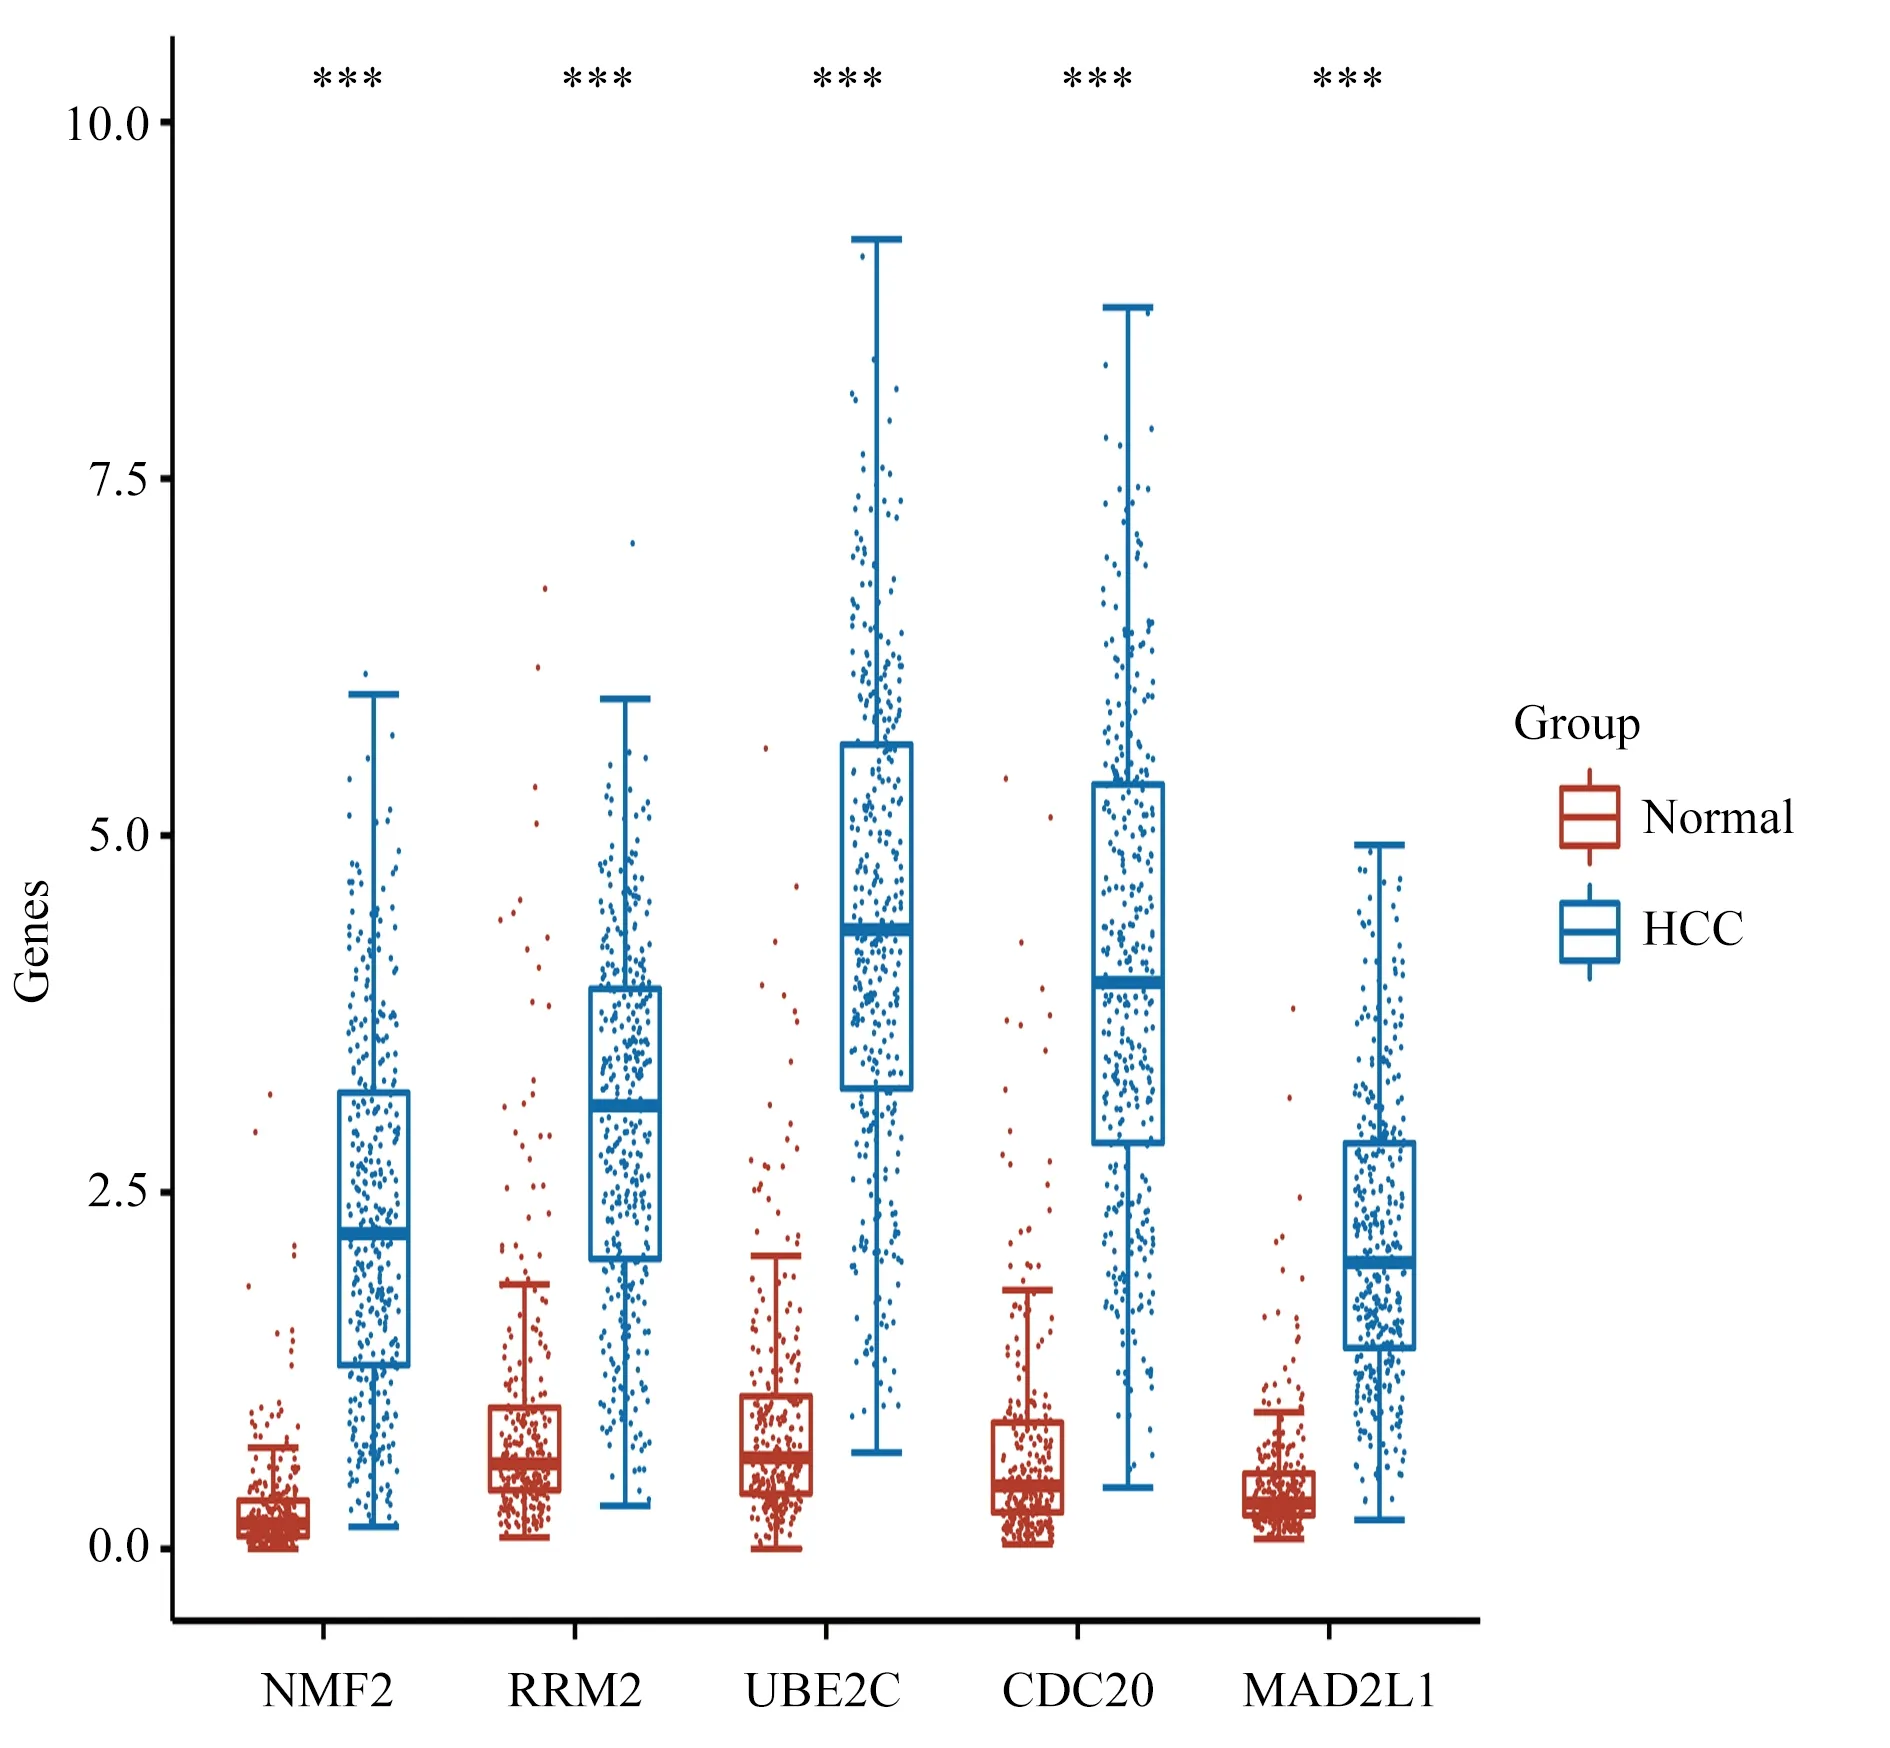
In combination with the TCGA database and GTEx database,371 HCC tissue samples and 276 normal liver tissue samples were collected to construct a boxplot to verify the expression of hub genes(Figure 6).The results showed that compared with normal liver tissues, the five hub genes were significantly upregulated in HCC tissues.
3.7 Prognostic analysis of hub genes
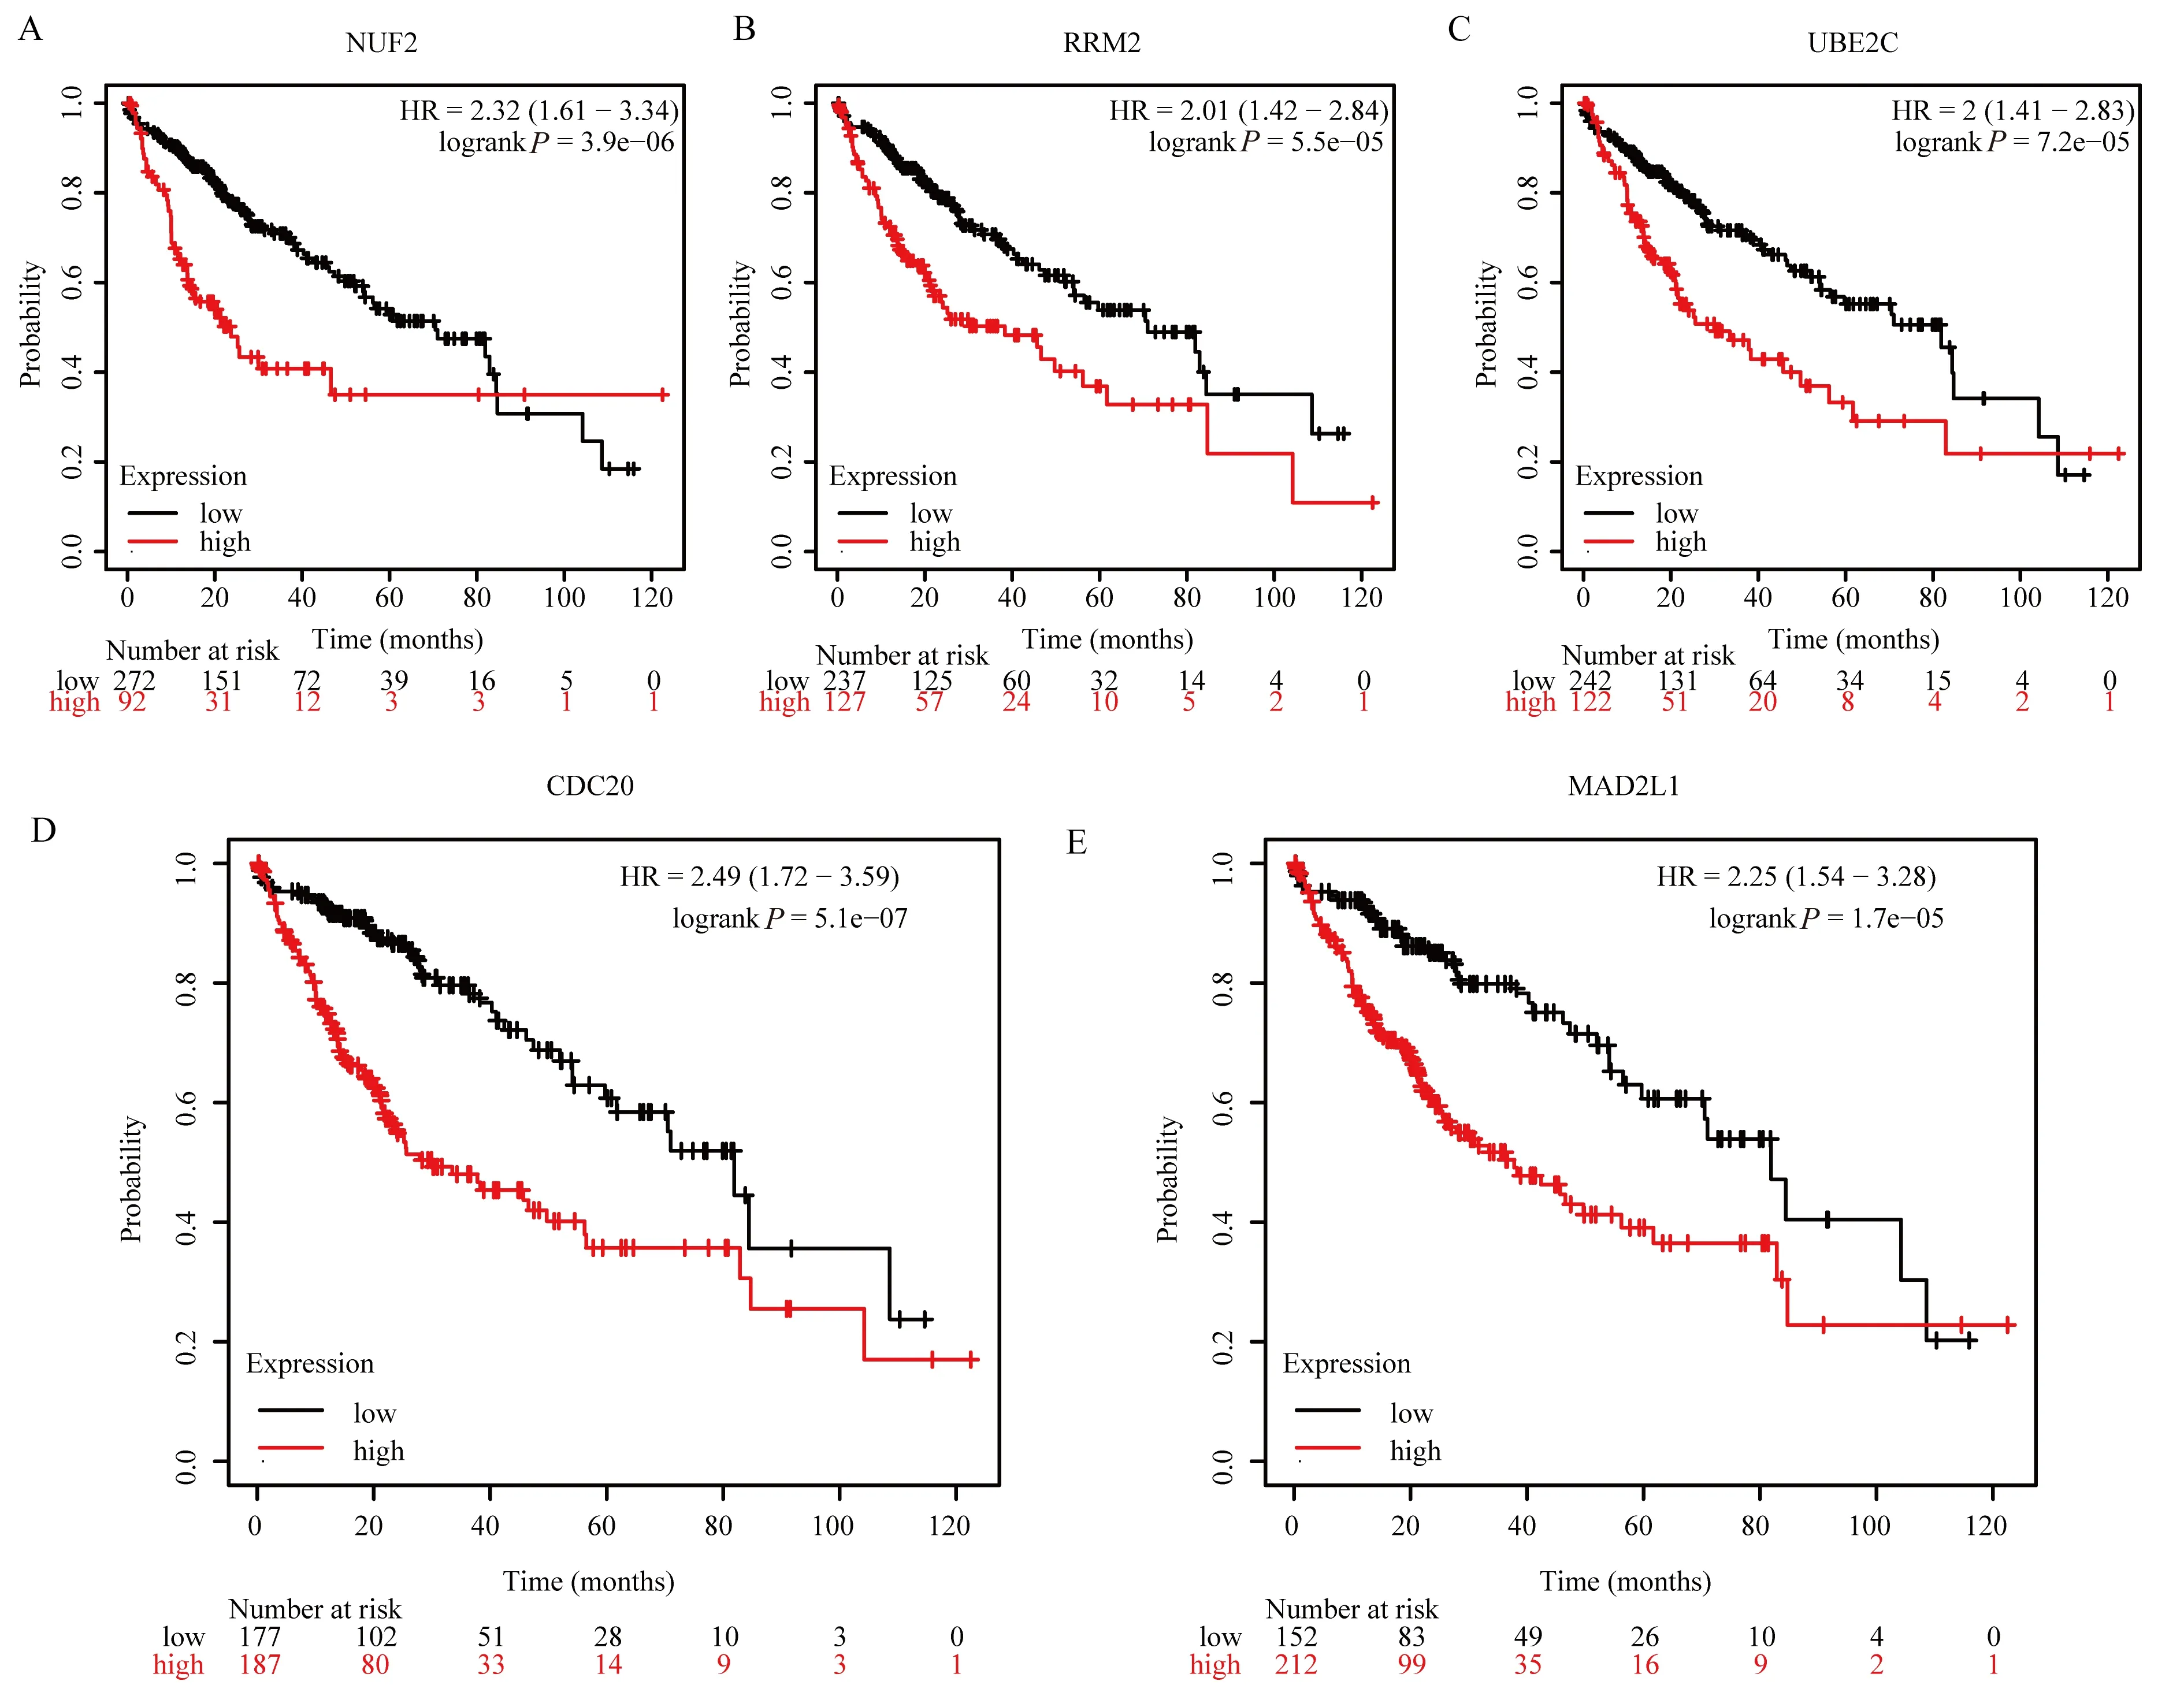
In order to further analyze the clinical significance of hub genes in HCC, survival curves were constructed using Kaplan-MeierPlotter online database to compare the relationship between hub gene expression levels and the prognosis of HCC patients (Figure 7A-E).Meanwhile, the average survival time of the low-expression cohort and the high-expression cohort of hub genes was shown in Table 1.It can also be seen from the table that the average survival months of HCC patients in the cohort with low hub gene expression are all greater than 70, while those in the cohort with high hub gene expression are all less than 40.

Fig6 Boxplot of hub gene expression

Fig7 Survival analysis of hub genes

Tab1 Mean survival time of patients with high or low hub gene cohort (months)
4.Discussion
HCC is one of the common malignant tumors of the digestive system, with a high degree of malignancy, and most patients are in the middle and late stage of disease progression when they seek treatment, resulting in extremely poor prognosis of patients[19,20].If the early diagnosis rate can be improved, radiofrequency ablation, surgical excision and other therapeutic measures provide the possibility of cure for HCC patients [21].Therefore, the study of biomarkers has become one of the breakthroughs in the early diagnosis of HCC.In this study, based on GEO database microarray data set, WGCNA combined with MCC algorithm was used to explore HCC hub genes, and TCGA database was used to verify the expression of hub genes, providing further reference for HCC diagnosis.
In this study, by comparing the gene expression profiles of 22 HCC tissue samples and 22 normal liver tissue samples, a total of 6 262 DEGs were obtained, of which 2 207 were up-regulated and 4 055 were down-regulated.WGCNA was used to identify four modules related to HCC clinical features, among which the cyan module was the most closely related.After the threshold was further set to screen the core genes of the turquoise module, 120 genes were obtained.Notably, there were 115 overlapping genes in the intersection of 120 core genes and DEGs.This study calls it candidate hub gene.The results of enrichment analysis showed that Candidate hub genes are mainly related with mitotic nuclear division, nuclear division,organelle fission, chromosome segregation of biological functions such as segregation, mitotic sister chromatid segregation and oocyte meiosis, cell cycle and progesterone mediated progesterone mediated oocyte maturation, p53 signaling pathway, human immunodeficiency virus 1 infection virus 1 infection and other signals.According to the calculation of PPI network by MCC, five hub genes were obtained,namely NUF2, RRM2, UBE2C, CDC20 and MAD2L1.The expression of these 5 hub genes in HCC tissue samples and normal liver tissue samples was further verified by TCGA data, and the results showed that the 5 hub genes were significantly upregulated in HCC.Furthermore, the survival curve was further drawn to analyze the junction genes and the prognosis of HCC patients, and the results showed that the high expression of the junction genes was closely related to the poor prognosis of patients.
Ndc80 kinetochore complex component(NUF2) is a kind of centromere protein, its combination NDC80 protein to form stable compounds involved in cell division process [22].During the process of cell mitosis, NDC80/NUF2 complex is involved in the binding of centromere-spindle microtubules to induce cell division [22].Genomic instability is characteristic of tumor progression, and abnormal chromosome separation during mitosis is one of the causes of gene instability [23,24].It is worth mentioning that centromeric spindle microtubule binding is a key factor to maintain accurate chromosome separation.As a key protein of kinetosis, NUF2 is crucial for maintaining the stability of kinetosis tension [25].In tumor cells, the silencing of NUF2 gene expression can induce cell cycle stasis in the G0/G1 phase, thus inhibiting the proliferation of tumor cells [26].Similarly, the silencing of NUF2 gene expression can significantly reduce the migration and invasion of HCC HCCLM3 cells [27].Ribonucleotide reductase (RR) RNA in the cell can be nucleoside diphosphate into deoxyribose nucleoside diphosphate,plays a decisive role on the DNA synthesis [28].RRM2 is one of the RR active structure polymers.Under normal conditions, the expression level of RRM2 in the body is low or no expression.However, its abnormal expression is involved in the proliferation,division and differentiation of malignant tumor cells [29,30].It was found that the expression level of RRM2 was up-regulated in gastric cancer [31], bladder cancer [32], colorectal cancer [33] and other malignant tumors to varying degrees.Moreover, the high expression of RRM2 also promoted the invasion and metastasis of tumor cells.Recent studies have found that the transcription of hepatitis B virus activates RRM2 to produce deoxyribonucleoside triphosphate,providing conditions for massive viral secretion and replication, thus maintaining the life cycle of the virus [34].Other studies have shown that reducing the expression level of RRM2 can reverse the resistance of liver cancer cells to 5-FU [29].Ubiquitin-conjugatingconjume2c(UBE2C) is a member of the E2 ubiquitin-conjugatingme2c family and participates in the ubiquitination degradation of proteins [35].UBE2C regulates the ubiquitination degradation of cyclins and participates in the cell cycle process, thus affecting the proliferation of tumor cells [36].Studies have shown that down-regulation of UBE2C expression can induce mitotic arrest of tumor cells to inhibit their infinite proliferation capacity, thus inhibiting the transformation of epithelial cells into stromal cells [37].UBE2C is also involved in the biological behavior of liver cancer [38].Cell division cycle 20 homologue (CDC20) is a regulator of cell cycle checkpoint [39].Studies have shown that CDC20 is highly expressed in HCC and is closely related to tumor length, capsule invasion, vascular invasion,tumor multiple, degree of differentiation and TNM stage [40,41].Mitotic Arrest Defective Protein 2(MAD2L1) was located on Human Chromosome 4 and was an important part of Mitotic Checkpoint Compound Protein [42].Current studies have shown that the abnormal expression of MAD2L1 at mitotic checkpoints can lead to chromosomal instability and further lead to the occurrence of tumors[42].
In conclusion, 115 genes closely related to HCC pathogenesis were identified by GEO database combined with WGCNA analysis, and these genes were involved in biological functions such as cell mitosis in this study.At the same time, five key genes closely related to HCC prognosis were further analyzed and identified, which provided ideas for clinical diagnosis and treatment of HCC.
Author’s contribution:
Zhang Kan: article conception, research design and the writing of the manuscript; Long Fu-li: directed and adjusted the research design; Li Yuan, Shu Fa-Ming and Yao Fan: conducted data analysis and mapping; Wei Ail-ing provided suggestions for the revision of the manuscript and received support from the project fund.
All authors declare no conflict of interest.
 Journal of Hainan Medical College2023年2期
- Journal of Hainan Medical College的其它文章
- Research progress of modern pharmacological effects of Pueraria lobata and its compound clinical application
- A systemaic review and meta-analysis of traditional Chinese medicine in the treatment of chronic cough
- Research progress on sensitive genes related to ferroptosis
- METTL14 upregulates m6A modification of pri-miR-141 inhibiting ZEB1 to promote proliferation and inflammation of lung fibroblasts
- Effect of Cx32 over-expression on cell proliferation, migration, and invasion of hepatocellular carcinoma cell line Huh7 and its mechanism
- Serum anti-blood type IgG/IgM binding and cytotoxicity to pig PBMC and RBC
