
Different genotypes regulate the microbial community structure in the soybean rhizosphere
2023-02-03 04:27:04QUZhengLlYuehanXUWeihuiCHENWenjingHUYunlongWANGZhigang
QU Zheng ,Ll Yue-han ,XU Wei-hui ,CHEN Wen-jing,HU Yun-long,WANG Zhi-gang
1 School of Life Science and Agriculture Forestry,Qiqihar University,Qiqihar 161006,P.R.China
2 Heilongjiang Provincial Technology Innovation Center of Agromicrobial Preparation Industrialization,Qiqihar 161006,P.R.China
Abstract The soybean rhizosphere has a specific microbial community,but the differences in microbial community structure between different soybean genotypes have not been explained.The present study analyzed the structure of the rhizosphere microbial community in three soybean genotypes.Differences in rhizosphere microbial communities between different soybean genotypes were verified using diversity testing and community composition,and each genotype had a specific rhizosphere microbial community composition.Co-occurrence network analysis found that different genotype plant hosts had different rhizosphere microbial networks.The relationship between rhizobia and rhizosphere microorganisms in the network also exhibited significant differences between different genotype plant hosts.The ecological function prediction found that different genotypes of soybean recruited the specific rhizosphere microbial community.These results demonstrated that soybean genotype regulated rhizosphere microbial community structure differences.The study provides a reference and theoretical support for developing soybean microbial inoculum in the future.
Keywords: soybean,rhizosphere,genotype,microbial community,host plants
1.lntroduction
Soybeans (Glycine max(L.) Merr.) are planted worldwide and yield over 300 million tons per year (Sugiyama 2019).Soybean produces seeds containing many proteins and lipids of high economic value (Heet al.2013).Because soybean plants have a symbiotic relationship with rhizobia,they do not need much fertilizer.However,a large amount of fertilizer is used to increase soybean production.Heavy chemical fertilizer use leads to a series of environmental problems (Rayet al.2006).Rhizosphere microorganisms reduce environmental stress and pressure,help maintain or enhance environmental sustainability and improve the environment (Joyneret al.2019;Yanget al.2020).Therefore,the recruitment of rhizosphere microbes is necessary for sustainable soybean production.
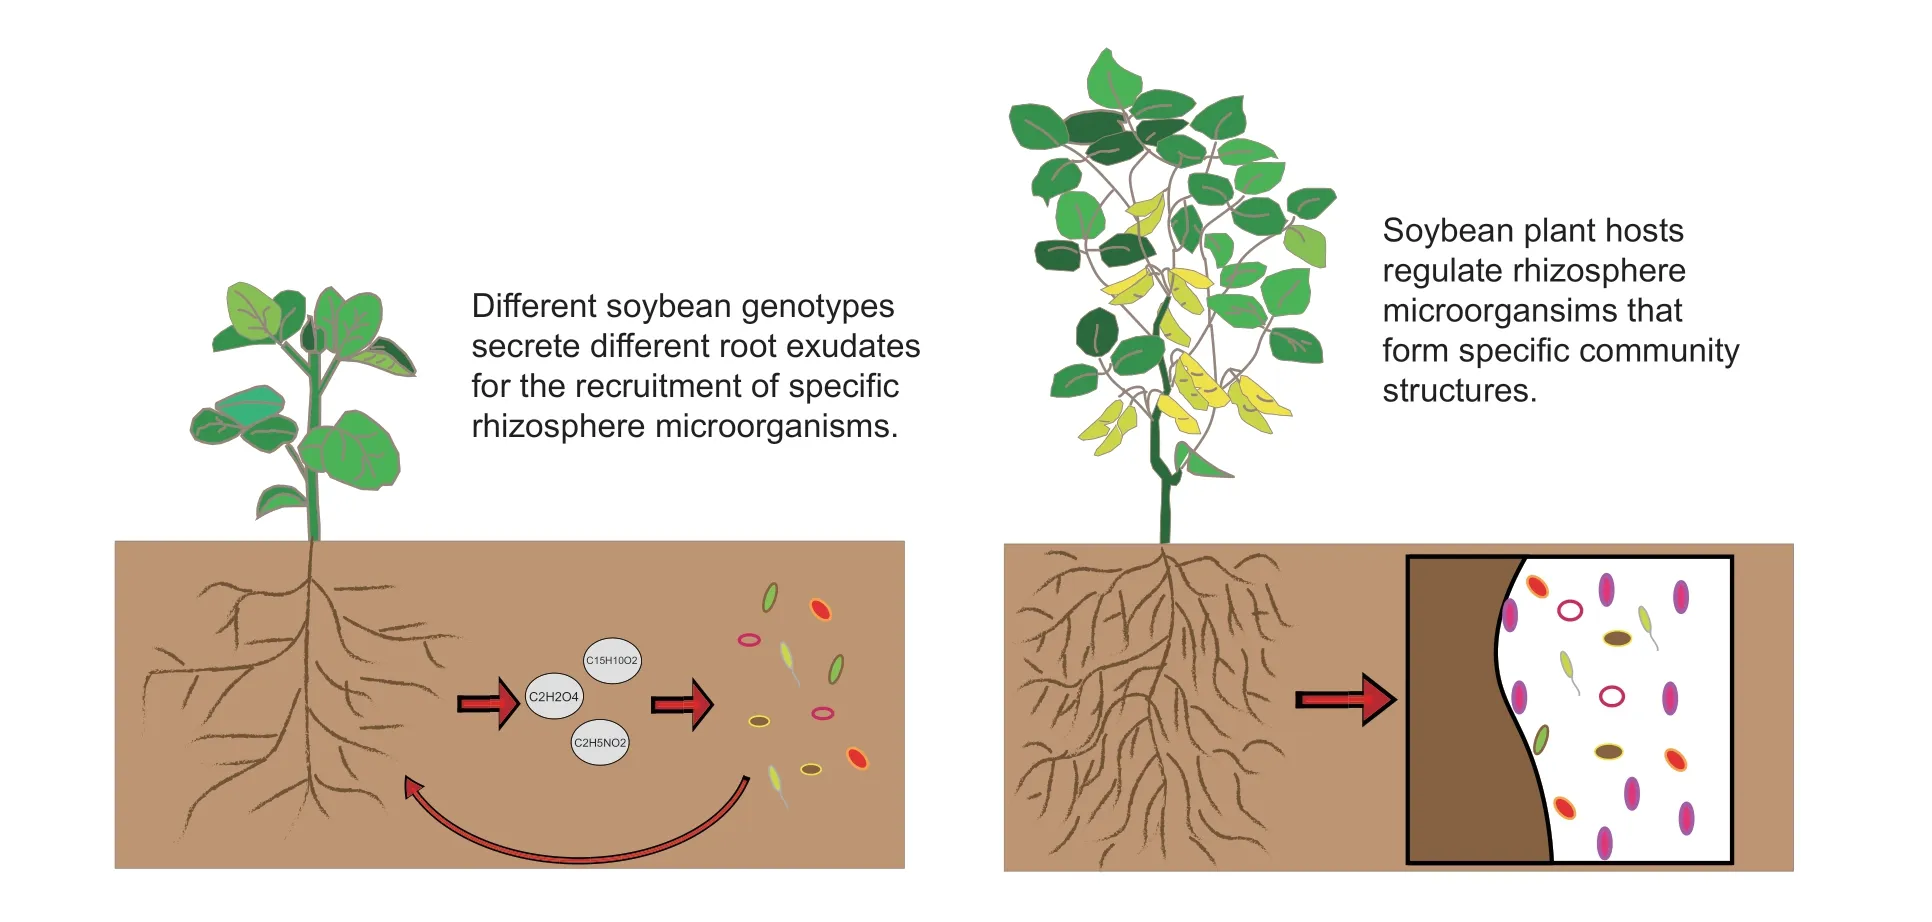
Each legume plant has a specific rhizosphere microbial community structure (Hartmanet al.2017).Therefore,there will be differences in rhizosphere microbial communities between different soybean genotypes Graphical abstract.(Chuet al.2021).Understanding the interaction between microbiota and plants has important agronomic significance,such asBradyrhizobium diazoefficiensUSDA110 predominated in soybean nodules in weakly acidic soil (Buendiaclaveriaet al.1994;Rodriguez-Navarroet al.2003;Albaredaet al.2009).Rhizobia may compete with these microorganisms in the soil or rhizosphere of their prospective host legume to establish a symbiotic relationship (Pooleet al.2018).Leguminous plants,such asLigustrum japonicum,Medicago truncatula,and soybean,play a crucial role in the establishment of bacterial assemblages in the rhizosphere or root,and the symbiosis between rhizosphere microorganisms and rhizobia affects the structure of the microbiota (Ikedaet al.2008;Mendeset al.2014;Xiaoet al.2017;Garrido-Oteret al.2018;Sugiyama 2019).Host plants establish close relationships with different microorganisms and form complex communities.Rhizosphere microorganisms affect plant growth and cause diseases (Kemen 2014;Hacquardet al.2015;Berendsenet al.2018),and plants and rhizosphere microorganisms select each other (Berg and Smalla 2009;Berendsenet al.2012;Philippotet al.2013).
The present study hypothesized that the plant host regulated the rhizosphere microbial community structure of different soybean genotypes.
2.Materials and methods
2.1.Experimental site and crop varieties
The experimental site was set in the black soil area of Qiqihar,Heilongjiang Province,China (123°76′90.67′′N,47°40′43.17′′E) in 2020.The average annual precipitation in this area is 670.8 mm,and the soil in the study site was acidic black soil.The experimental plot design is shown in Appendix A.Blank soil physical and chemical properties are given in Appendix B.
Three genotypes of soybean,Dongsheng 1 (high protein,GDB),Kenjiandou 29 (high grease,GY),and Xihai 1 (high protein and high grease,SG),were used in the study.CK was the blank control soil,and CK S and CK M were the control soils at the seedling stage and mature stage,respectively.The properties of the three genotypes of soybean are shown in Appendix C.
2.2.Soil sampling
The rhizosphere soils were collected in two stages,the seedling stage (S) and maturity stage (M).The plant root systems were gently separated from the bulk soil,and the soil adhering to the roots was regarded as rhizosphere soil.All impurities were removed from the soil using tweezers,immediately placed in a soil bag,and stored in a refrigerator at 4°C (Barillotet al.2013).The soil collection method and test field planting method are shown in Appendix A.
2.3.Preparation,sequencing,and analysis of soil gene samples
This experiment used a total of 120 samples from two stages for sequencing (Appendix D).Microbial community genomic DNA was extracted from soybean rhizosphere soil samples using the E.Z.N.A.?soil DNA Kit (Omega Bio-Tek,Norcross,GA,USA) according to the manufacturer’s instructions.All samples from the two stages were used for sequencing (Appendix E).Distinct regions of bacterial 16S rRNA and fungal ITS genes were amplified using primers.The hypervariable region V3-V4 of the bacterial 16S rRNA gene was amplified using the primer pairs 338F (5′-ACTCCTACGGGAGGCAGCAG-3′)and 806R (5′-GGACTACHVGGGTWTCTAAT-3′).The ITS gene was amplified using the primer pairs ITS1F (5′-CTTGGTCATTTAGAGGAAGTAA-3′) and ITS2R (5′-GCTGCGTTCTTCATCGATGC-3′) in an ABI GeneAmp?9700 PCR thermocycler (ABI,CA,USA).The PCR product was extracted from a 2% agarose gel,purified using the AxyPrep DNA Gel Extraction Kit(Axygen Biosciences,Union City,CA,USA) according to the manufacturer’s instructions,and quantified using a Quantus? Fluorometer (Promega,USA).
Purified amplicons were pooled in equimolar amounts and paired-end sequenced on an Illumina MiSeq PE300 platform (Illumina,San Diego,USA) according to the standard protocols of Majorbio Bio-Pharm Technology Co.Ltd.(Shanghai,China).The raw reads were deposited into the NCBI Sequence Read Archive (SRA) database(Accession number: PRJNA774498).
The raw 16S rRNA gene sequencing reads were demultiplexed,quality-filtered by fastp version 0.20.0(Chenet al.2018),and merged using FLASH version 1.2.7 (Magoc and Salzberg,2011).Operational taxonomic units (OTUs) with a 97% similarity cut-off (Edgar 2013;Chatellieret al.2014) were clustered using UPARSE version 7.1 (Wanget al.2007),and chimeric sequences were identified and removed.The taxonomy of each OTU representative sequence was analyzed by RDP Classifier version 2.2 against the 16S rRNA database using a confidence threshold of 0.7.
2.4.Statistical analysis
Graphical representations were generated using GraphPad Prism 5 (GraphPad Software,Inc.,La Jolla,CA,USA).The means and standard deviations of the data were calculated.The Kruskal-Wallis H test was used to identify taxa that were significantly different between soil types at the phylum or family level.A paired Wilcoxon rank-sum test was performed to compare the alpha diversity of different soil types.Permutational multivariate analysis of variance (PERMANOVA) was performed to measure effect sizes and significant differences in beta diversity.Analysis of variance (ANOVA) and Tukey’s method were performed using SPSS 16.0 (SPSS Inc.,Chicago,IL,USA) to estimate the differences in bacterial community composition (P<0.05).Multiple bacterial OTUs were compared between each genotype treatment using pairwise tests in STAMP.Non-metric multidimensional scaling (NMDS) was performed to assess the variation in the phylogenetic β-diversity along the soybeans using R(ver.3.2.5).We generated an individual co-occurrence network of the rhizosphere microbial community of soybeans of each genotype.Non-random co-occurrence analysis was performed using Cytoscape (Smootet al.2011) (version 3.6.1).The characteristic parameters of microbial networks reflect the systematic characteristics of microbial communities in an ecosystem.The study determines the network modules according to the greedy modularity optimization method.The network is modular only when the modularity index is greater than 0.4.The nodes in each module are highly connected and have the same ecological function.Some key nodes play an important role in network stability.Therefore,the key role of node I is represented by the intra-module connectivity(Zi) and inter-module connectivity (Pi).The difference between Zi and Pi was used to divide the network nodes into module hubs (Zi>2.5,Pi≤0.62),which were highly connected to the nodes in the module.Connectors(Zi≤2.5,Pi>0.62) were connecting modules and the network hub (Zi>2.5,Pi>0.62),with the function of connector and module hub.The relative abundance (RA)matrix and OTU annotation file in the formats instructed by the pipeline were prepared.The correlations were calculated using the RA matrix for network construction.The networks were explored and visualized using the Gephi interactive platform (Smootet al.2011).The ecological function prediction of the rhizosphere microbial communities was an artificially constructed database by FAPROTAX,which maps prokaryotic taxa to metabolic or other ecologically related functions,such as nitrification and denitrification,at the genus level.
3.Results
3.1.Differences in the diversity of the soybean rhizosphere between the three genotypes
The OTU dilution curve is shown in Appendix F.The α-diversity analysis (Shannon and Chao indexes)showed significant differences in the level of fungal genera between different soybean genotypes in maturity and seedling stages.The significant differences in rhizosphere microorganisms between Dongsheng 1(high protein,GDB),Kenjiandou 29 (high grease,GY),Xihai 1 (high protein and high grease,SG) and the CK group were found at the bacterial genus level (Fig.1-AD and G-J).The non-metric multidimensional scaling(NMDS) (β-diversity) from the Bray-Curtis distance showed that the rhizosphere microbes (identified by different colors) of the three genotypes of soybean showed significant segregation (Fig.1-E,F,K,L).These results indicated that significant differences existed in the microbial diversity of the rhizosphere between soybean genotypes.
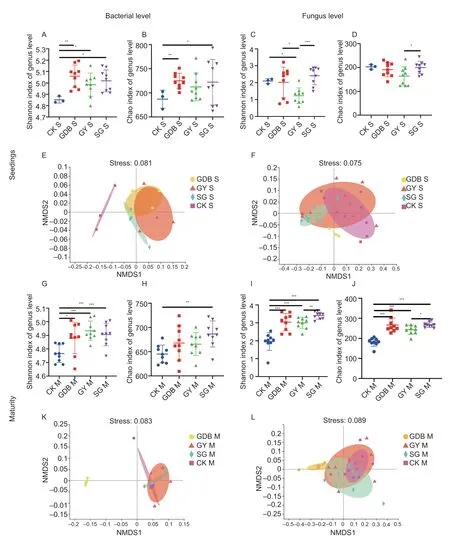
Fig.1 The diversity of rhizosphere microbial communities between the three soybean genotypes.A,Shannon index of bacterial level in the seedling stage.B,Chao index of bacterial level in the seedling stage.C,Shannon index of fungal level in the seedling stage.D,Chao index of fungal level in the seedling stage.E,non-metric multidimensional scaling (NMDS) analysis diagram of bacterial level in the seedling stage.F,NMDS analysis diagram of fungal level in the seedling stage.G,Shannon index of bacterial level in the maturity stage.H,Chao index of bacterial level in the maturity stage.I,Shannon index of fungal level in the maturity stage.J,Chao index of fungal level in the maturity stage.K,NMDS analysis diagram of bacterial level in the maturity stage.L,NMDS analysis diagram of fungal level in the maturity stage.GDB,Dongsheng 1 (high protein);GY,Kenjiandou 29 (high grease);SG,Xihai 1 (high protein and high grease);CK,control.S,seedlings;M,maturity.*,P<0.1;**,P<0.05;***,P<0.01.
3.2.Analysis of the rhizosphere microbial community composition of three soybean genotypes
To identify specific differences in rhizosphere microbial communities between the three soybean genotypes,we analyzed the microbial community structures at the phylum level (Fig.2) and genus level (Fig.3).At the bacterial phylum level,the relative abundances ofFirmicutes,Bacteroidota,andGemmatimonadotaincreased with CK in the seedling stage (Fig.2-A and C).The relative abundances ofFirmicutes,Bacteroidota,Gemmatimonadota,Actinobacillustrate,Chloroflexi,andAcidobacteriotaalso showed significant differences from CK in the maturity stage (Fig.2-B and D).At the fungal phylum level,significant differences were found inBasidiomycotaandAscomycotabetween GDB,SG,and GY,and significant differences were found inMortierellomycotabetween GY and SG in the seedling stage (Fig.2-E and G).The rhizosphere fungal communities of the three soybean genotypes tended to be consistent in the maturity stage (Fig.2-F and H).

Fig.2 Community structure analysis at the phylum level.A,bar diagram of the relative abundance of the bacterial community at the phylum level in the seedling stage.B,bar diagram of the relative abundance of the bacterial community at the phylum level in the maturity stage.C,column diagram of the abundance of the bacterial community at the phylum level in the seedling stage.D,column diagram of the abundance of the bacterial community at the phylum level in the maturity stage.E,bar diagram of relative abundance of fungal community in phylum level in the seedling stage.F,bar diagram of the relative abundance of the fungal community at the phylum level in the maturity stage.G,column diagram of the abundance of the fungal community at the phylum level in the seedling stage.H,column diagram of the abundance of the fungal community at the phylum level in the maturity stage.Other in the bar diagram included microbes with a relative abundance<0.01.CK,control;GDB,Dongsheng 1 (high protein);GY,Kenjiandou 29 (high grease);SG,Xihai 1 (high protein and high grease).S,seedlings;M,maturity.Bars mean SD (n=5).Means with different lowercase letters in the column diagram are significantly different (P<0.05) from one another;ns,no significant difference.
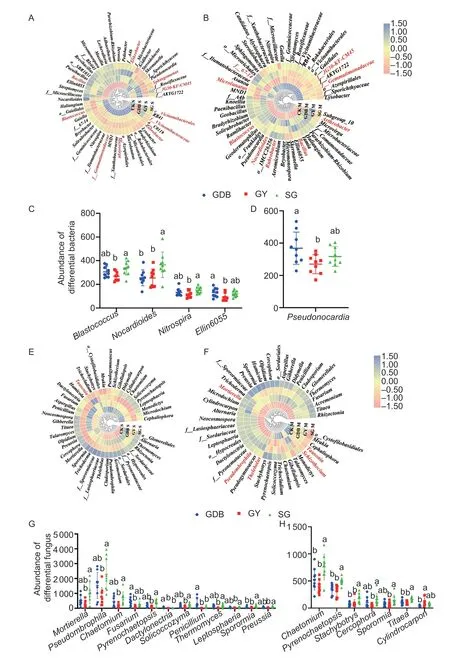
Fig.3 Community structure analysis at the genus level.A,heatmap of bacterial genera in the seedling stage.B,heatmap of bacterial genera in the maturity stage.C,scatter diagram of different bacterial genera in the seedling stage.D,scatter diagram of different bacterial genera in the maturity stage.E,heatmap of fungal genera in the seedling stage.F,heatmap of fungal genera in the maturity stage.G,scatter diagram of differential fungal genera in the seedling stage.H,scatter diagram of differential fungal genera in the maturity stage;f__ and o__ indicate that the genera were not classified at the genus level.GDB,Dongsheng 1 (high protein);GY,Kenjiandou 29 (high grease);SG,Xihai 1 (high protein and high grease).Bars mean SD (n=5).The different small letters in the column diagram indicate a significant difference (P<0.05) from one another.
The three soybean genotypes had specific differential microorganisms at the bacterial level (Appendix G).The differential microorganisms in GY and SG were more abundant than GDB at the maturity stage (Appendix H).At the fungal level,SG had the most significantly different microbial genera(Appendix G).The differential genera were decreased in the maturity stage,and SG still had the most differential genera (Appendix H).Bacterial genera in the top 60 most abundant were selected for analysis (Fig.3).The results showed that the genus-level composition of microbial communities in both maturity and seedling stages of fungal and bacteria were significantly different from CK(Fig.3-A,B,E,F).The dominant strain is marked with red in the heatmap.The study defined the microbial genus with an abundance greater than 1% as the dominant genus.Among the dominant microbial genera,there were few significantly different microbial genera (Appendix I).At the top 60 most abundant bacterial genera,Blastococcus,Nocardioides,Nitrospira,andEllin6055showed differences between GY,GDB,and SG in the seedling stage (Fig.3-C).The abundance of Pseudomonas was different between GY,GDB,and SG (Fig.3-D).At the fungal level,the abundances ofMortierella,Pseudombrophila,Chaetomium,Fusarium,Pyrenochaetopsis,Dactylonectria,Solicoccozyma,Penicillium,Thermomyces,Leptosphaeria,Sporormia,andPreussiashowed differences between GY,GDB,and SG in the seedling stage (Fig.3-G).The abundances ofChaetomium,Pyrenochaetopsis,Stachybotrys,Cercophora,Sporormia,Titaea,andCylindrocarponwere significantly different between SG,GY,and GDB in the seedling stage(Fig.3-H).
3.3.Co-occurrences networks of rhizosphere microbes in different soybean genotypes
Analysis of the co-occurrences network found significant differences between the different soybean genotypes,and differences were reflected in different stages (Fig.4).The detailed differences are reflected in Appendix J.Within the same genotype,the networks also changed significantly between the two stages,and the networks in the maturity stage became more unstable than the seedling stage.During the two stages,the complexity of the GY network was the lowest.The edges were the highest in the seedling stage of GDB,and the key nodes were the highest in SG.This result occurred because the different soybean genotypes recruited different rhizosphere microorganisms.
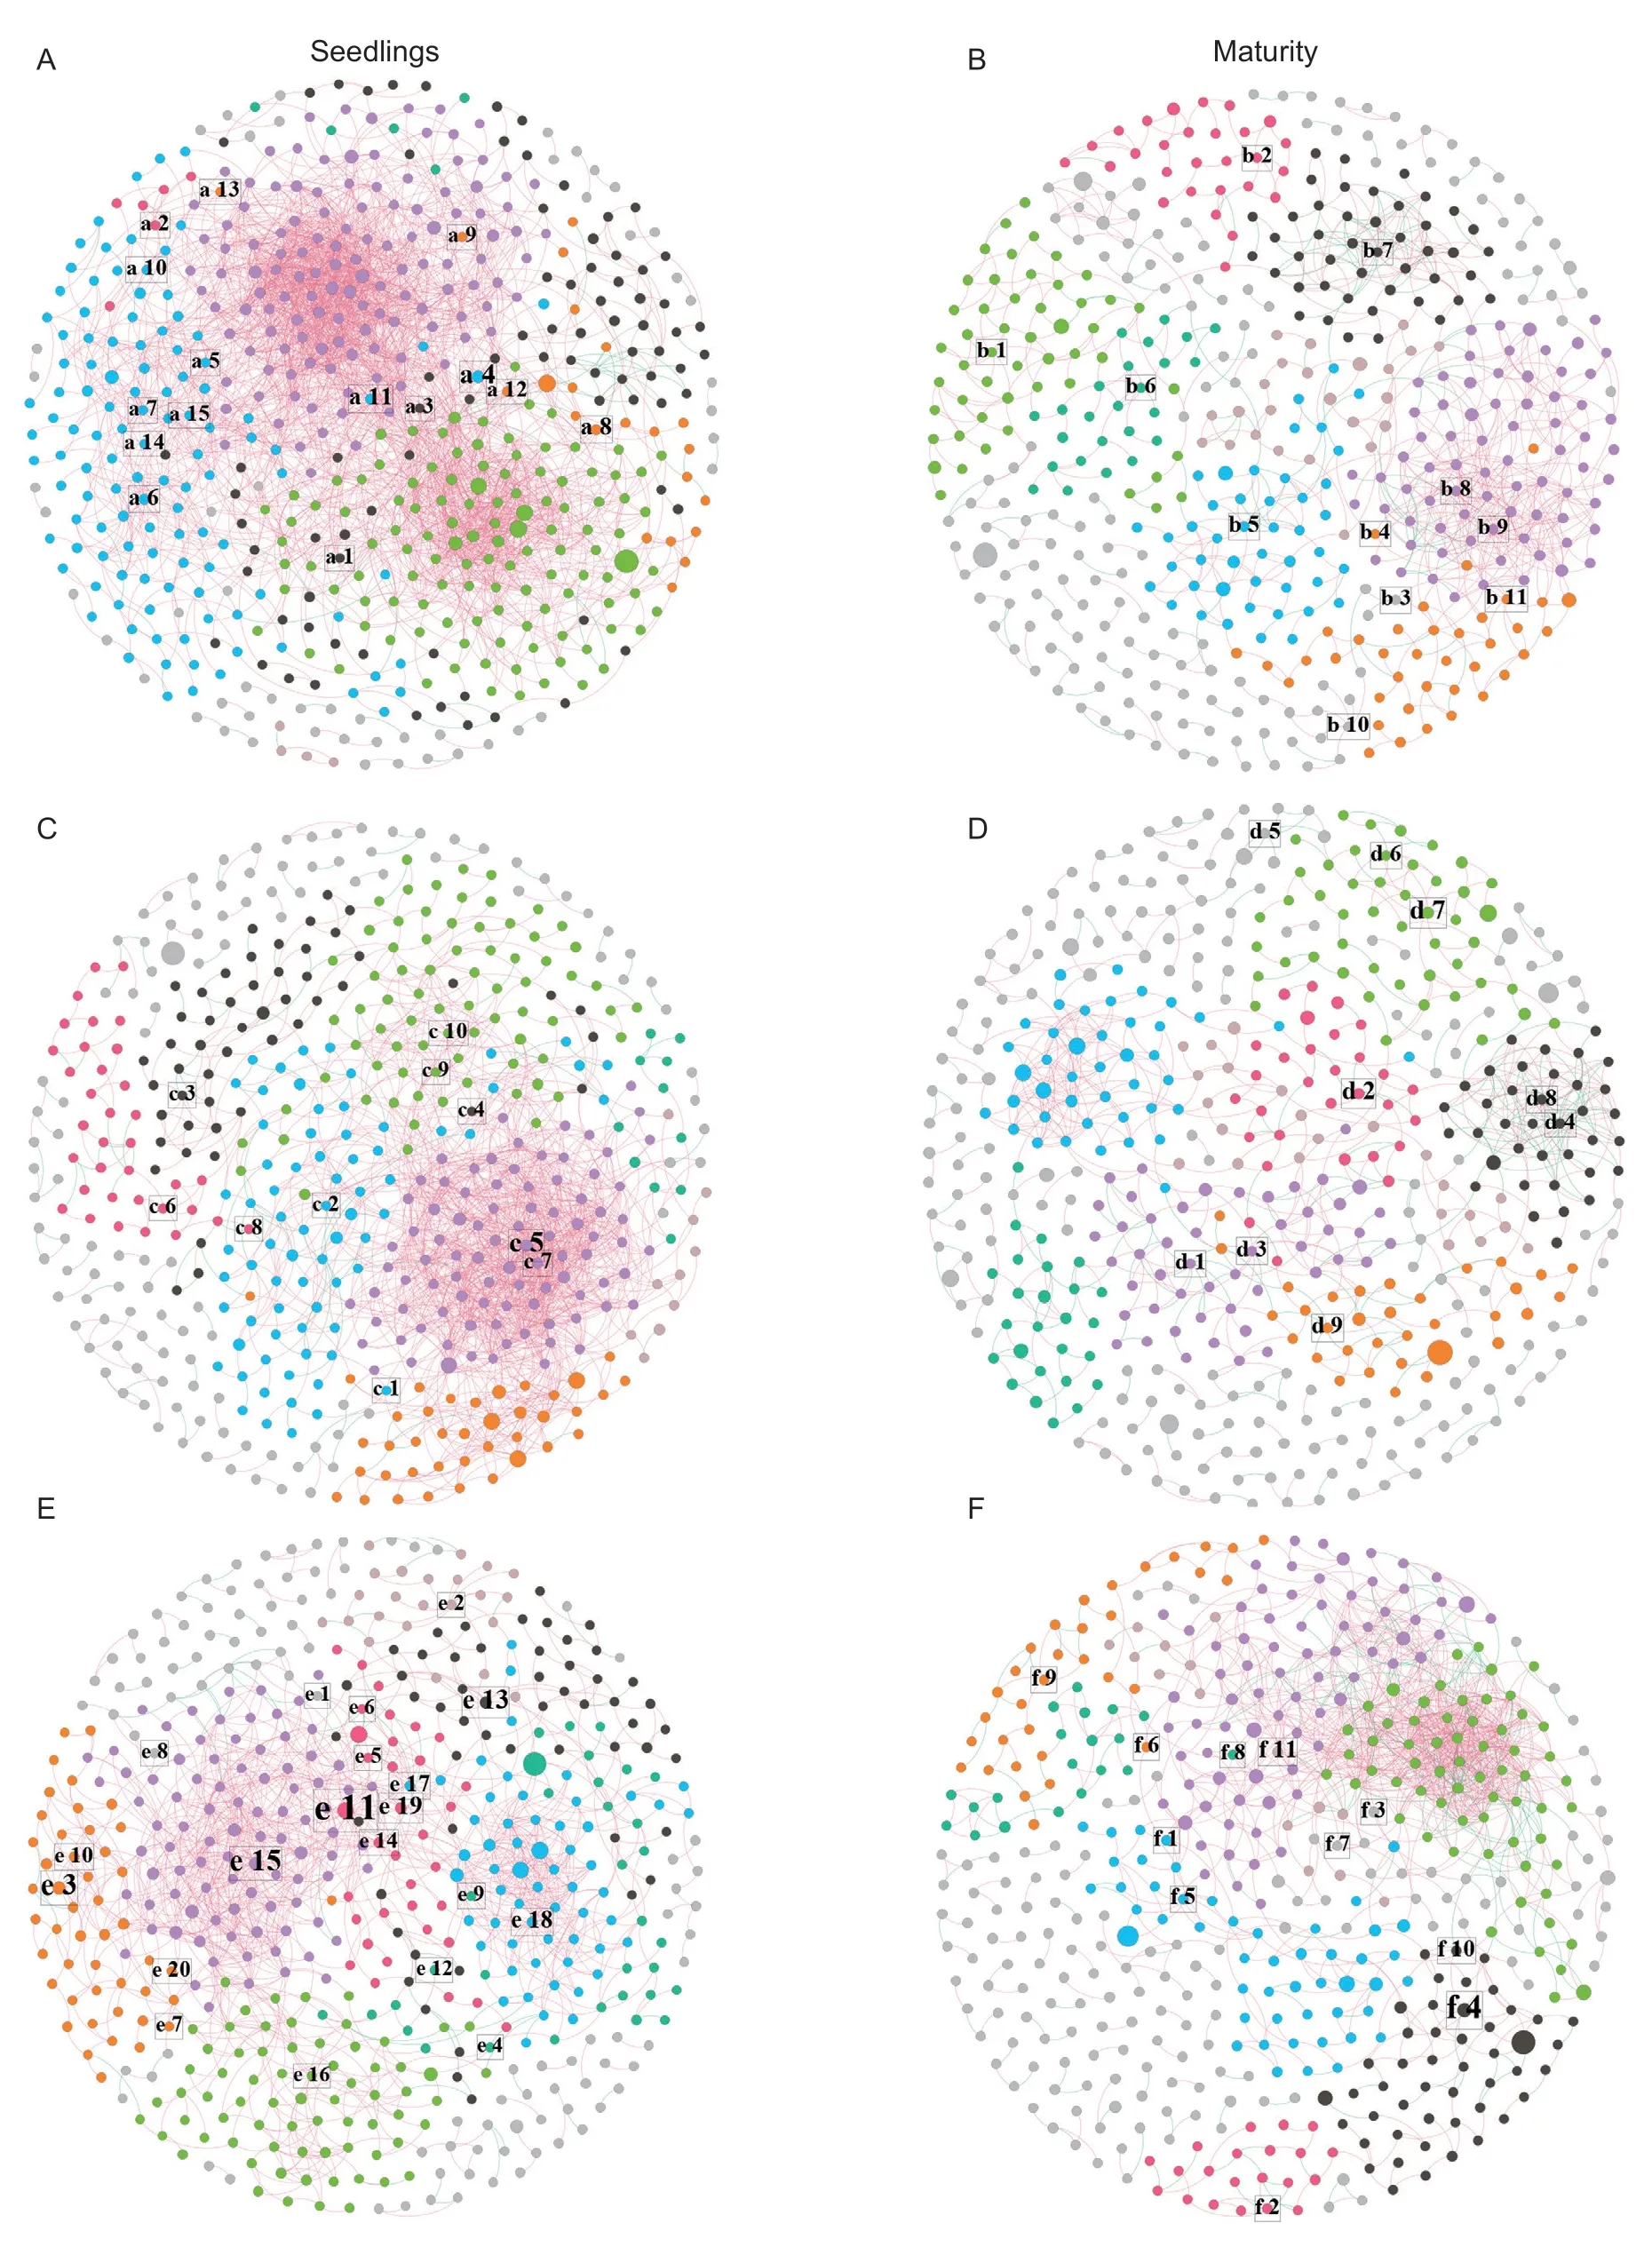
Fig.4 Co-occurrences network of rhizosphere microbial community structure in different soybean genotypes.A,the seedling stage network of high protein (GDB).B,the maturity stage network of GDB.C,the seedling stage network of high grease (GY).D,the maturity stage network of GY.E,the seedling stage network of high protein and high grease (SG).F,the maturity stage network of SG.The nodes with different colors in the co-occurrences network represent operational taxonomic units (OTUs) classified into different modules;the node size represents the abundance of the out in the co-occurrences network;the edge between nodes indicates a correlation between the OTUs;the color of the edge represents a positive correlation (red) and a negative correlation(blue).
3.4.Rhizosphere microbial co-occurrences network associated with rhizobia with different soybean genotypes
Allorhizobium,Mesorhizobium,andBradyrhizobiumwere found in terms of rhizobia (Appendix K).The abundance of the three rhizobium genera was different between the three soybeans genotypes in the rhizosphere (Appendix K).Bradyrhizobiumshowed the highest abundance in nodules,and significant differences inBradyrhizobiumexisted between the GDB,GY,and SG during the maturity stage (Appendix K).The rhizosphere microbial cooccurrences network associated with rhizobia in soybean was different between the three soybean genotypes(Fig.5).The co-occurrences networks were significantly different between the three soybean genotypes in the connection of rhizobia and rhizosphere microorganisms.Especially in the co-occurrences network of GDB,rhizobiarelated rhizosphere microorganisms were the most abundant.These results indicated that the connections and components between soybean rhizosphere microorganisms and rhizobia were very complex,and the rhizosphere microorganisms associated with rhizobia in the three genotypes of soybean were quite different.
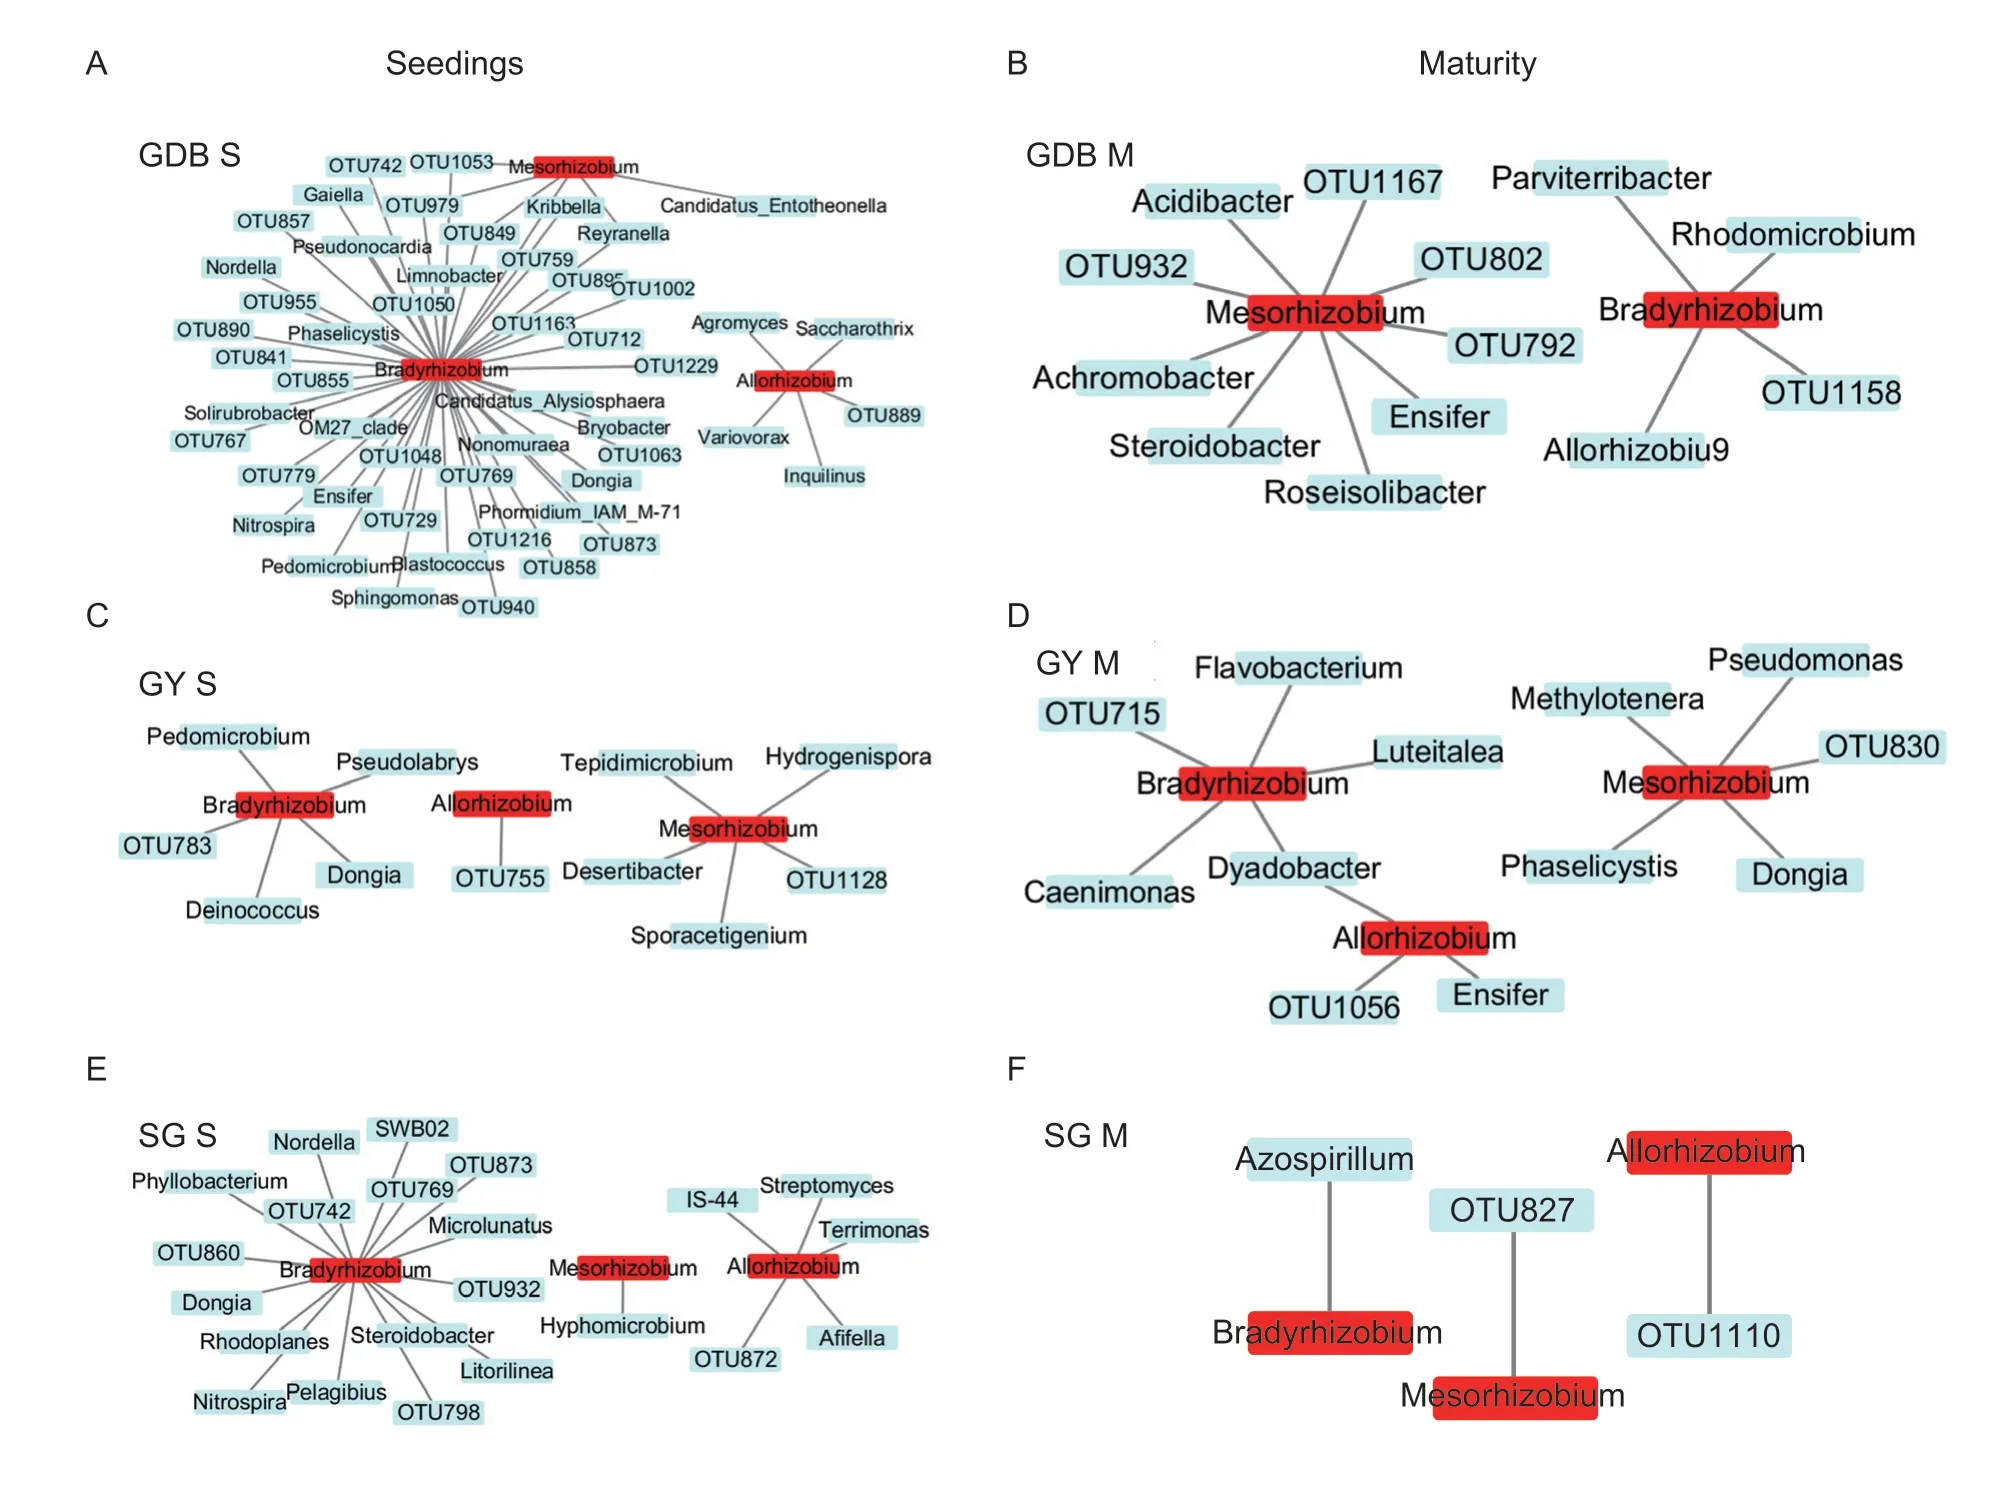
Fig.5 The co-occurrences network of rhizosphere microorganisms associated with rhizobia.A,genera of bacteria associated with rhizobia in the seedling stage of high protein (GDB).B,genera of bacteria associated with rhizobia in the maturity stage of GDB.C,genera of bacteria associated with rhizobia in the seedling stage of high grease (GY).D,genera of bacteria associated with rhizobia in the maturity stage of GY.E,genera of bacteria associated with rhizobia in the seedling stage of high protein and high grease (SG).F,genera of bacteria associated with rhizobia in the maturity stage of SG.S,seedlings;M,maturity.OTU indicates that the genus was unclassified at the genus level.The different colors represent the rhizobia (red) and rhizosphere microorganisms (blue).The edge represents the correlation of the rhizobia and rhizosphere microorganisms.
3.5.Functional prediction of the rhizosphere microorganisms
Bacterial sequences were assigned to 93 functional groups using the FAPROTAX database.The OTUs with abundances below 0.015% were removed,and the remaining OTUs were assigned to 20 groups related to the C and N cycles.Most functional groups were represented by more than one genus (Appendix L).Chemoheterotrophy was the largest functional group and was associated with 243 bacterial genera.The differences were significant between GY,GDB,and SG(Fig.6).The abundances of ureolysis,methylotrophy,aromatic hydrocarbon degradation,and nitrogen-fixation in GDB were higher than SG in the seedling stage,and the abundance of chitinolysis was the highest in GY(Fig.6-A and B).The abundances of aromatic compound degradation and ligninolysis were the highest in GDB in the maturity stage (Fig.6-C and D).The abundance of functional prediction in the maturity stage was lower than the seedling stage.
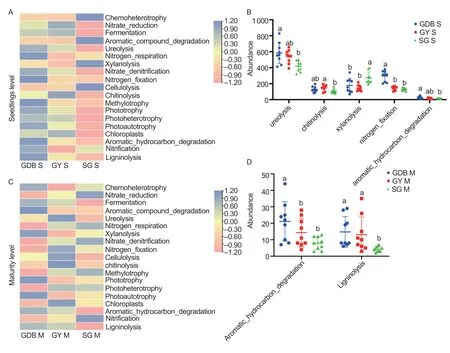
Fig.6 Functional prediction of FAPROTAX in the three soybean genotypes in two stages.A,heatmap of functional prediction in three soybean genotypes in the seedling stage.B,FAPROTAX functional groups that were significantly different between high protein (GDB),high protein and high grease (SG) and high grease (GY) in the seedling stage.C,heatmap of functional prediction in three soybean genotypes in the maturity stage.D,FAPROTAX functional groups that were significantly different between GDB,SG,and GY in the maturity stage.S,seedlings;M,maturity.Bars mean SD (n=5).Letters mean significant differences (P<0.05)based on Tukey’s test.
At the fungal level,the functional differences were not significant between the three soybean genotypes from the four nutritional patterns (Appendix M).The FUNGuild analysis was used for categorization (Appendix N).Differences were found between the three soybean genotypes and the two stages.
4.Discussion
Different legumes recruit specific rhizosphere microbes(Jain and Nainawatee 2002;Miranda-Sanchezet al.2016;Hartmanet al.2017;Xiaoet al.2017).The present study found that these differences in rhizosphere microbial communities were also expressed between different soybean genotypes,which was clearly shown by the α and β diversities.The difference was due to different soybean genotypes,which was consistent with Miranda-Sanchezet al.(2016).The analysis showed that changes in the rhizosphere microbial community of the different genotypes also changed with stage,which is consistent with the results of Sohnet al.(2021).The present study showed that the three soybean genotypes formed specific rhizosphere microbial communities from the seedling stage to the maturity stage.This finding indicated that the different genotypes of the soybean hosts regulated the rhizosphere microbial community structure.
The microbial genus determines the function of the bacterium (Wanget al.2016;Luet al.2019),which is the primary reason for plant host recruitment of rhizosphere microorganisms (Berg and Smalla 2009;Berendsenet al.2012;Philippotet al.2013;Fernandez-Gonzalezet al.2020).The composition of the rhizosphere microbial community at the genus level at two stages showed significant differences in the three soybean genotypes in the present study.For example,Sphingamonsashowed significant differences between SG,GY,and GDB in the seedling stage,and this genus is primarily related to nitrogen transformation (Zhouet al.2016).Blastococcus,Nocandioides,Nirospira,andEllin6055in SG and GDB were higher than in GY in the maturity stage,and these genera are primarily related to degradation and nitrite oxidation (Xuet al.2018;Jianget al.2020;Siebielecet al.2020).Pseudonocardiain GDB was the most abundant of the three soybean genotypes in the maturity stage,and this genus is primarily related to synthetic antibiotics (Calderaet al.2019).This result may occur because GDB requires more N for plant host growth and development and recruits more N-related genera.The main reason why this characteristic was formed may be due to the plant host’s recruitment of specific rhizosphere microbes according to its own needs.At the fungal level,the dominant genera at the seedling stage were less than the maturity stage.Tausoniain GY was the highest among GY,SG,and GDB.Chaetomiumwas also higher in SG and GDB than in GY,and this genus is related to the C and N cycles (Challacombeet al.2019).These results showed that the three soybean genotypes of rhizosphere microbes formed specific communities,which resulted from differences in the composition and abundance of these genera.These recruited rhizosphere microbial communities possess functions required by plant hosts for growth and development.The results also suggested that different soybean genotypes recruited specific rhizosphere microbial communities for growth and development.
Co-occurrence networks intuitively present differences between microbial communities of the plant host (Fanet al.2017).The networks showed that the key nodes of the three genotypes of soybean were different,and these key nodes were key to communicating the whole cooccurrences network.These key nodes also showed the function of key microbial genera required for the soybean genotype.For example,most key nodes of rhizosphere microorganisms from the three genotypes were generally related to nutrient transformation in soils in the seedling stage (Fidaet al.2014;Skouri-Panetet al.2018;Baoet al.2019;Abenaet al.2020;Siebielecet al.2020).The plant host recruitment in this stage is for growth and development by absorbing nutrients,and these strains may be important for soybean nutrient absorption.For example,SG had the most complex network structure,andStreptomycesandAKYG587in key nodes are related to the promotion of plant growth and disease resistance (Gohet al.2020).The SG co-occurrences network of the seedling stage revealed thatRubrobacterwas the network hub,which is the thermophilus stressresistant strain (Ferreiraet al.1999;Kourilovaet al.2021).Microbial networks reflect the interactions between microorganisms,and plants regulate microbial communitiesviasecretions (Linget al.2016).However,the key nodes of the rhizosphere microbial communities were different between the three soybean genotypes in the two stages.Therefore,the functions of the key nodes were different,which may be due to the regulation of the plant host.
Previous studies showed that nodules were the existing organ of rhizobia,and symbiotic nitrogen fixation occurs in leguminous plants (Parveenet al.2019).The composition of rhizobia primarily depends on the physical and chemical properties of the soil,andBardyrizobiumis generally dominant in acidic soil,which is consistent with our study (Hanet al.2020).However,the cooccurrences networks showed that rhizobia-associated rhizosphere microbes were different in different soybean genotypes,which was little reported.The complexity of the nodule network of GDB in the two stages was the highest among GY,SG,and GDB.Some bacterial genera,such asDongiaandNonomuiaea,were associated withBardyrizobiumin the nodule network of GDB.These genera are associated with nitrogen fixation(Zhaoet al.2020),but these genera were not found in the nodule networks of GY or SG.Therefore,GDB may be more inclined to recruit rhizosphere microorganisms associated with nodule nitrogen fixation (Sunet al.2020),which may be because the GDB needs to absorb more N to achieve a higher protein content.The differences between the rhizosphere microbial communities of different genotypes may be caused by requirements from the host plant,which is similar to the results (Wanget al.2014).
The genera related to the C and N cycles were found using FAPROTAX.The abundance of genera related to the N cycle in GDB was the highest compared to GY and SG.SG recruited more microorganisms related to the C cycle in the seedling stage,and the abundance was the highest of the three soybean genotypes.At the fungal level,the functional prediction of FUNGuild was primarily divided into four categories.The abundance of the fungal species in GY was the highest,and the abundance of pathogenic fungi in GDB was the highest.Prediction by ecological function showed that the plant host of each soybean genotype preferred corresponding to ecological function,and this preference recruited specific rhizosphere microbes.These results are consistent with our previous speculation and provide guidance and suggestions for fertilization disease prevention in soybean planting.
5.Conclusion
The present study suggested that the rhizosphere microbial community structure of different soybean genotypes was regulated by the plant host and was primarily due to the different functions required by the plant host.Therefore,future agricultural production and bacterial fertilizer development should consider that different soybean genotypes need different microbial bacterial fertilizers,and bacterial fertilizer and nutrient contents should use different standards in the fertilization process.These findings provide new insights for soybean planting and fertilization and a new approach for developing soybean microbial inoculum.
Acknowledgements
This research was funded by the Key Research and Development Projects of Heilongjiang Province,China(GA21B007 and GZ20210014) and the Basic Research Fees of Universities in Heilongjiang Province,China(135409103).
Declaration of competing interest
The authors declare that they have no conflict of interest.
Appendicesassociated with this paper are available on http://www.ChinaAgriSci.com/V2/En/appendix.htm
 Journal of Integrative Agriculture2023年2期
- Journal of Integrative Agriculture的其它文章
- A 314-bp SlNE insertion in the ZNF2 promoter region may act as a repressor related to regulation of fat deposition in pigs
- An optimized protocol using Steedman’s wax for high-sensitivity RNA in situ hybridization in shoot apical meristems and flower buds of cucumber
- Characterization of subunits encoded by SnRK1 and dissection of combinations among these subunits in sorghum (Sorghum bicolor L.)
- The role of time preferences in contract breach: Evidence from Chinese poultry farmers participating in contract farming
- Optimal design of culling compensation policy under the African swine fever — Based on simulations of typical pig farms in China
- Drip fertigation and plant hedgerows significantly reduce nitrogen and phosphorus losses and maintain high fruit yields in intensive orchards