
Evaluation of the early defoliation trait and identification of resistance genes through a comprehensive transcriptome analysis in pears
2023-01-06 10:57:38SHANYanfeiLlMengyanWANGRunzeLlXiaogangLlNJingLlJiamingZHAOKejiaoWUJun
SHAN Yan-fei ,Ll Meng-yan ,WANG Run-ze ,Ll Xiao-gang ,LlN Jing ,Ll Jia-ming ,ZHAO Ke-jiao,WU Jun
1 College of Horticulture/State Key Laboratory of Crop Genetics and Germplasm Enhancement,Nanjing Agricultural University,Nanjing 210095,P.R.China
2 Institute of Horticulture,Jiangsu Academy of Agricultural Sciences/Jiangsu Key Laboratory for Horticultural Crop Genetic Improvement,Nanjing 210095,P.R.China
Abstract Early defoliation,which usually occurs during summer in pear trees,is gradually becoming a major problem that poses a serious threat to the pear industry in southern China.However,there is no system for evaluating the responses of different cultivars to early defoliation,and our knowledge of the potential molecular regulation of the genes underlying this phenomenon is still limited.In this study,we conducted field investigations of 155 pear accessions to assess their resistance or susceptibility to early defoliation.A total of 126 accessions were found to be susceptible to early defoliation,and only 29 accessions were resistant.Among them,19 resistant accessions belong to the sand pear species (Pyrus pyrifolia).To identify the resistance genes related to early defoliation, the healthy and diseased samples of two sand pear accessions,namely,the resistant early defoliation accession ‘Whasan’ and the susceptible early defoliation accession ‘Cuiguan’,were used to perform RNA sequencing.Compared with ‘Cuiguan’,a total of 444 genes were uniquely differentially expressed in‘Whasan’.Combined with GO and KEGG enrichment analyses,we found that early defoliation was closely related to the stress response.Furthermore,a weighted gene co-expression network analysis revealed a high correlation of WRKY and ethylene responsive factor (ERF) transcription factors with early defoliation resistance.This study provides useful resistant germplasm resources and new insights into potentially essential genes that respond to early defoliation in pears,which may facilitate a better understanding of the resistance mechanism and molecular breeding of resistant pear cultivars.
Keywords: pear,early defoliation,resistance and susceptibility evaluation,RNA-seq,WRKY,ERF
1.lntroduction
Pear is a globally cultivated fruit that belongs to thePyrusgenus of the Amygdaloideae subfamily in the Rosaceae family (Wuet al.2013).The annual pear production and harvested area have reached 23.1 million tons and 1.3 million ha,respectively.China ranks first in pear production worldwide,with an annual pear production of 16.1 million tons (FAO 2020).Pears have been cultivated in East Asia,North America,and Europe for over 3 000 years (Baudryet al.1993).The breeding of preferred pear accessions usually takes around 13 to 15 years and requires a large population volume,labor force,acreage,and financial investment.Therefore,the long-term and high investment characteristics of pear cultivation underscore the importance of optimizing pear quality and yield.
The genusPyrusis susceptible to various diseases and pests,which reduce pear production and fruit quality.Common diseases include pear scab,pear rust,black spot disease,and fire blight.Pear scab,caused byVenturia pirina(Aderh.),is the most significant pear disease,and it severely reduces pear yield and fruit quality (Jamaret al.2017).Pear rust is a foliar pathogen of fruiting trees that is induced by the fungusGymnosporangium sabinae(Dicks).It causes yellow to bright orange leaf spots on pear tree leaves and mummifies the young fruit,resulting in complete defoliation and crop loss (Kaliszet al.2015).Black spot disease,caused byAlternaria alternata(Fries),is one of the most harmful diseases in Japanese pear cultivation.It causes severe bitterness in mature fruit,as well as complete defoliation (Tanahashiet al.2016).Fire blight,caused by the bacteriumErwinia amylovora,is widespread throughout Europe and Asia.This disease is devastating to various pomaceous trees and can induce the death of plants and loss of fruit production (Mertogluet al.2020),as well as partial defoliation in midsummer(Reighardet al.2005).A major pest in European pear production areas is the pear psylla (Psylla pyriL.).The nymphs and adults of psylla feed on sap from young leaves,shoots,and buds,causing direct damage to plants in summer (Erler 2004).During feeding,the honeydew produced by psylla adults and nymphs accumulates on the surfaces of leaves and fruit,leading to russeting disease(Pehlevan and Kovanci 2018).In total,this pest causes a decline in fruit quality and the deterioration of pear plantations (Li and Tian 2020).
In recent years,early defoliation has increasingly threatened the sustainable development of the pear industry in South China.Early defoliation usually happens during mid-June to late-August,so it occurs approximately three months earlier than the natural fall (Baudryet al.1993).Some results have shown that early defoliation is related to ascendant trends in disease severity (Challiolet al.2006;Bogoet al.2018).Entomosporiumis a widespread plant disease(Goncalveset al.2013) that rapidly develops during plant growth.It was shown to cause early defoliation,eventually leading to a pear yield reduction in Brazil (Bogoet al.2018).Pear leaf spot is a severe disease occurring in many areas of the world where pears are cultivated under warm and humid conditions,and it causes the early defoliation of pear trees in mid-summer (Bell and van der Zwet 2005).In addition,the diseases caused byAlternaria alternata,Colletotrichum acutatum,andColletotrichum fructicolaalso cause severe early defoliation of young leaves during summer (Fukaya 2004;Tanahashiet al.2004;Zhanget al.2015).Aside from disease infection,the honeydew excretion ofPseudococcus comstocki(an invasive pest) and development of sooty mold can also result in early defoliation (Pellizzariet al.2012).In addition to biotic stimuli,abiotic stresses also induce early defoliation (Linet al.2018;Gortariet al.2021).The long-term use of chemical fertilizers aggravates the occurrence of early defoliation in pear cultivation areas in southern China (Kanget al.2021).The high contents of NO3-N and NH4-N in soil can cause leaf blackening,and early defoliation occurs in‘Niitaka’ pear (Song 2002).Furthermore,the characteristics of pear accessions determine their resistance to early defoliation (Matsumotoet al.2008).The occurrence of early defoliation will induce flower and bud necrosis (Yimet al.2005;Wennekeret al.2011),as well as the deterioration of vegetative-reproductive variables and the soluble solid content in pears (Hudina and Stampar 1999;Cheolet al.2015).Early defoliation has resulted in pear production losses in most areas,especially in southern China (Huanget al.2010) and southern Brazil (Bogoet al.2018).It is a major concern among many fruit farmers due to its negative effects on pear tree vigor,fruit quality,and sustained high yield.However,there is no system for evaluating the resistance and susceptibility of different accessions to early defoliation,although this is the important information for both cultivation protection and future breeding in pear.In addition to pears,this unfavorable phenomenon is also widespread in poplar(van den Berget al.2007;Gortariet al.2018),kiwifruit vines(Cruz-Castilloet al.2010;Kwacket al.2014),and rubber trees (Linet al.2018).
Significant efforts have been made to identify the genes that are potentially related to disease defense and stress responses in pears.The scab resistance geneRvp1,identified in European pear ‘Navara’,causes resistance to the fungusV.pirina(Bouvieret al.2012).PbrATG8c,an autophagy marker in other species,could respond to a variety of tested stressors inPyrus bretschneideriRehd.such as dehydration,salt,and pathogen infection (Sunet al.2021).In the scab-inoculated leaves of Japanese pear,the activity of phenylalanine ammonia lyase (PAL)was enhanced.Salicylic acid (SA) also accumulated,which indicated that PAL might be related to SA and play a role in enhancing resistance (Faizeet al.2004;Shiet al.2021).High-throughput sequencing has gradually become the mainstream method for determining candidate stress-response genes (Liu Det al.2020;Wang Y Fet al.2020;Yuanet al.2020;Zhanget al.2020;Zhuet al.2020).RNA-seq was conducted on sand pear leaves that were inoculated or mock-inoculated with pear black spot disease,and four genes were subsequently selected as candidates for resistance to pear black spot disease in sand pears(Yanget al.2015).The results of RNA-seq in Nakai (Pyrus pyrifolia) showed that the pear responded to the infection ofPenicillium expansumby signal transduction,including a reactive oxygen species burst,plant hormone signal transduction,and transaction factor regulation (Xuet al.2021).Many studies on pears have demonstrated that transcription factors (TFs),including NAC,MYB,bHLH,WRKY,and AP2/ERF,play key roles in the regulation of biotic and abiotic stresses (Huanget al.2015;Liet al.2015,2018;Gonget al.2019;Gaoet al.2020;Wang Z Yet al.2020;Donget al.2021;Wang Y Set al.2021).These TFs systematically regulate the expression of target genes by binding tocis-acting elements in the gene promoters.Although a massive amount of research has been conducted to reveal the genes related to certain diseases and stress in pears,research related to early defoliation in pear has rarely been conducted.
In this study,field investigations were performed to evaluate the resistance or susceptibility to early defoliation among a total of 155 pear accessions,which will facilitate identifying the resistant pear accessions.To further identify the candidate genes that respond to early defoliation,two sand pear accessions,the resistant accession ‘Whasan’and the susceptible one ‘Cuiguan’,were selected for further transcriptome analysis.RNA-seq analysis and weighted gene co-expression network analysis (WGCNA) were conducted,and the differentially expressed genes related to early defoliation resistance were finally selected.This study provides selected resistant pear accessions and new insights into the potential genes underlying the early defoliation phenomenon in pears,which will provide resistant accessions and genetic resources for the breeding of new resistant cultivars.
2.Materials and methods
2.1.Field investigations and plant material collection
The field investigations of 155 accessions were conducted at the pear germplasm resource nursery of Jiangsu Academy of Agricultural Sciences on September 2nd,2020.For each accession,a total of three to five perennial branches from two or three trees were assessed using the disease index.The proportion of diseased areas (S) on leaves was evaluated firstly by Image J Software (Zhouet al.2020).The disease severity response to early defoliation was classified into five levels according to the S value: level 0: S=0;level 1:0<S≤0.1;level 3: 0.1<S≤0.25;level 5: 0.25<S≤0.4;level 7:0.4<S≤0.65;and level 9: 0.65<S≤1,and some examples of leaves belonging to the different levels are shown in Fig.1.Then,the disease index (DI) was calculated according to the following formula (Niu and Huo 2015):
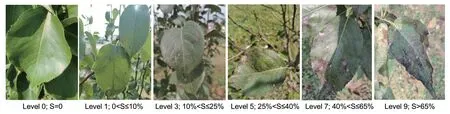
Fig.1 The status of leaves assigned to the different levels of disease severity.S,the proportion of diseased areas on leaves.
According to the calculated DI values,the pear accessions were classified as follows: disease-resistant:0<DI≤40%;and disease-susceptible: 40%<DI≤100% (Liet al.2017).
Based on the evaluation results,resistant and susceptible leaves were collected from ‘Whasan’ (P. pyrifolia) and‘Cuiguan’ (P. pyrifolia),respectively.For each accession,eight spotted (diseased) leaves and eight spot-free (healthy)leaves were collected for comparisons and photographic documentation.Then,the leaves and the basal portions of the petioles were separately collected and stored at -80°C.
2.2.RNA isolation and sequencing
Total RNA was extracted from four samples of ‘Cuiguan’(i.e.,diseased leaves: ‘CG_DL’;diseased basal: ‘CG_DB’;healthy leaves: ‘CG_HL’;healthy basal: ‘CG_HB’)and four samples of ‘Whasan’ (i.e.,diseased leaves:‘WS_DL’;diseased basal: ‘WS_DB’;healthy leaves:‘WS_HL’;healthy basal: ‘WS_HB’).The RNA integrity number (RIN) was determined using 1% agarose gels and an Agilent 2100 bioanalyzer (Agilent Technologies,California,USA).The purity of RNA was determined using a NanoPhotometer spectrophotometer (Thermo Fisher Scientific,Massachusetts,USA).The eight samples described above were sequenced,and separate libraries for ‘CG_DB’,‘CG_DL’,‘WS_DB’,‘WS_DL’,‘CG_HB’,‘CG_HL’,‘WS_HB’,and ‘WS_HL’ were prepared using the NEBNext?UltraTM RNA Library Prep Kit (New England Biolabs,USA).The first four libraries were set as the controls.Three replications were performed for each library.Fragmented mRNA and oligonucleotides were used for the synthesis of first-strand cDNA.Then,secondstrand cDNA synthesis was completed using dNTPs and DNA polymerase I.The 3′ ends of the purified cDNA were adenylated,and polyA was added and connected to the sequencing connector.After screening out 250–300 bp cDNA by using AMPure XP beads (Beckman Coulter,Beverly,USA),PCR amplification was performed.The product of the PCR procedure was subsequently purified,and the libraries were obtained.Library quality was assessed by a Qubit2.0 Fluorometer (Thermo Fisher Scientific,Massachusetts,USA).Then,the insert size of the libraries was determined,and qRT-PCR was performed to ensure library quality.Sequencing was conducted on the Illumina HiSeq 2500 according to the efficient concentrations and target data volume.
2.3.Sequencing data analysis and differentially expressed gene (DEG) identification
The quality of sequencing reads was evaluated using FastQC v0.11.9 (https://www.bioinformatics.babraham.ac.uk/projects/fastqc/).Raw data were filtered using Trimmomatic software v0.39 (Bolgeret al.2014) to remove the read adapters and other low-quality reads.High-quality data were assembled and mapped to the reference genome of pear (Wuet al.2013) using HISAT2 v2.0.1 (Kimet al.2015).For expression quantification,FeatureCounts Software v2.0.0 was used to count the mapped reads in each gene (Liaoet al.2014),and the values of reads per kilobase per million (RPKM) mapped reads were calculated by an in-house Python script.Using “DESeq2 v1.26.0” in R,the DEGs were defined by |log2FoldChange|≥1 and aP-value of ≤0.01 (Mortazaviet al.2008;Dobinet al.2013).
2.4.Gene Ontology (GO) and Kyoto Encyclopedia of Genes and Genomes (KEGG) enrichment analyses
PlantRegMap (http://planttfdb.cbi.pku.edu.cn/) was used for GO enrichment analysis of the DEGs,and the KEGG pathway enrichment of the DEGs was analyzed using KOBAS v3.0 (http://kobas.cbi.pku.edu.cn/ kobas3/genelist/).The results of the GO enrichment analysis were plotted as bar charts in Microsoft Excel 2016,and the results of the KEGG enrichment analysis were plotted as bubble charts using “ggplot2 v3.3.5” in R.
2.5.ldentification of TFs and plant disease resistance genes related to disease and stress
To predict the TFs,the protein sequences of the DEGs in the comparison groups were obtained from the pear protein database using TBtools v1.0 (Chenet al.2020),and subsequently submitted to the plant TF database(PlantTFDB v5.0;http://planttfdb.gao-lab.org/prediction.php).Eventually,the classified TF groups with an E-value of≤1e–10were obtained.To predict the putative plant disease resistance genes,we submitted the protein sequences of the DEGs to the Pathogen Receptor Genes database (PRGdb)v4.0 (http://prgdb.org/prgdb4/) (Calle Garciaet al.2021).Plant disease resistance genes were screened out with an E-value of ≥1e–6using the blast function.Moreover,the domains and classes of these genes were analyzed using DRAGO3 tools in PRGdb v4.0.
2.6.Weighted gene co-expression network analysis(WGCNA)
WGCNA was performed according to our previous study(Wang R Zet al.2021).First,we merged the gene expression matrices of all 24 samples.Then,we calculated the adjacencies in WGCNA with a best soft power of 19,and minimized the effects of noise and spurious associations using the Topological Overlap Matrix (TOM)(Yip and Horvath 2007).Subsequently,the co-expression relationships between the DEGs were obtained from TOM with a weight threshold of 0.02.Moreover,the coexpression relationships containing TFs and plant disease resistance genes,as well as stress-related genes,were extracted and visualized using Cytoscape v3.6.0 (Shannonet al.2003).
2.7.Validation of gene expression by quantitative real-time PCR (qRT-PCR)
The total RNA was extracted from the eight samples described above using a Plant Total RNA Isolation Kit(FORGENE,Chengdu,China),strictly following the manufacturer’s instructions.The concentrations were tested using Nanodrop and Agilent 2100.qRT-PCR was performed to verify the expression results of the transcriptome sequencing.The specific primers used to amplify the DEGs were designed using the Primer-Blast function in the National Center for Biotechnology Information (NCBI) Search database (https://www.ncbi.nlm.nih.gov/) and were procured from Tsingke Biotechnology Co.,Ltd.(Beijing,China).The primer sequences are shown in Appendix A.RNA samples were used to synthesize cDNA using TransScript?One-Step gDNA Removal and cDNA Synthesis SuperMix (TransGen Biotech,Beijing,China).qRT-PCR amplification was completed using Genious 2X SYBR Green Fast qPCR Mix (ABclonal Technology,Wuhan,China) on LightCycler 480 (Roche,Basel,Switzerland).The PCR procedure was as follows: pre-incubation at 95°C for 5 min;amplification with 45 cycles of 95°C for 3 s,60°C for 10 s,and 72°C for 3 s;and final cooling at 40°C for 30 s.Three biological samples and three technical repeats were evaluated to confirm the reliability of the results.PbrGADPHwas used as a reference gene.The relative expression level of each gene was calculated using the 2–ΔΔCtmethod (Livak and Schmittgen 2001).
2.8.Data analyses
Data processing was performed using the R package and Microsoft Excel 2016.The stacked bar diagram,Venn diagrams,and heatmaps were drawn using Origin 2019,Venn diagram in the R package,and TBtools v1.0,respectively.The visualized charts of RPKM values and relative expression levels were drawn using GraphPad Prism v6.01,and the correlation coefficient between them was analyzed using the CORREL function in Microsoft Excel 2016.
3.Results
3.1.Evaluation of the resistance and susceptibility to early defoliation in the different pear accessions
Based on the standards of disease severity evaluation and the DI calculation,126 of the 155 accessions were found to be susceptible to early defoliation,and only 29 accessions were resistant based on the field investigations.The distribution of DI approximated a normal distribution,the values varied from 18.34 to 97.86%,and were mainly distributed between 40 and 80%,which indicated that most of the pear accessions were disease-susceptible(Fig.2-A;Appendix B).For the disease severity evaluation,the different accessions showed varied resistance levels.Among the five levels,19.35% pear accessions had leaves in level 0,56.77% had leaves in level 1,85.16% had leaves in level 3;and all of the pear accessions included leaves of level 5 (Table 1).Further statistical analysis revealed that pear accessions showed resistance when their leaves ranked as level 0 to level 3,accounting for more than 60%of the total leaves evaluated (Appendix B).
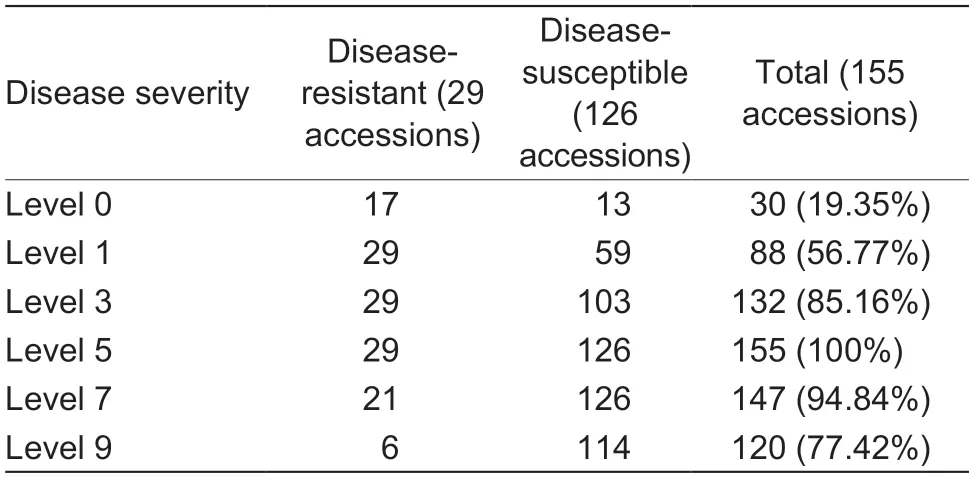
Table 1 The number of accessions distributed among the different levels of disease severity
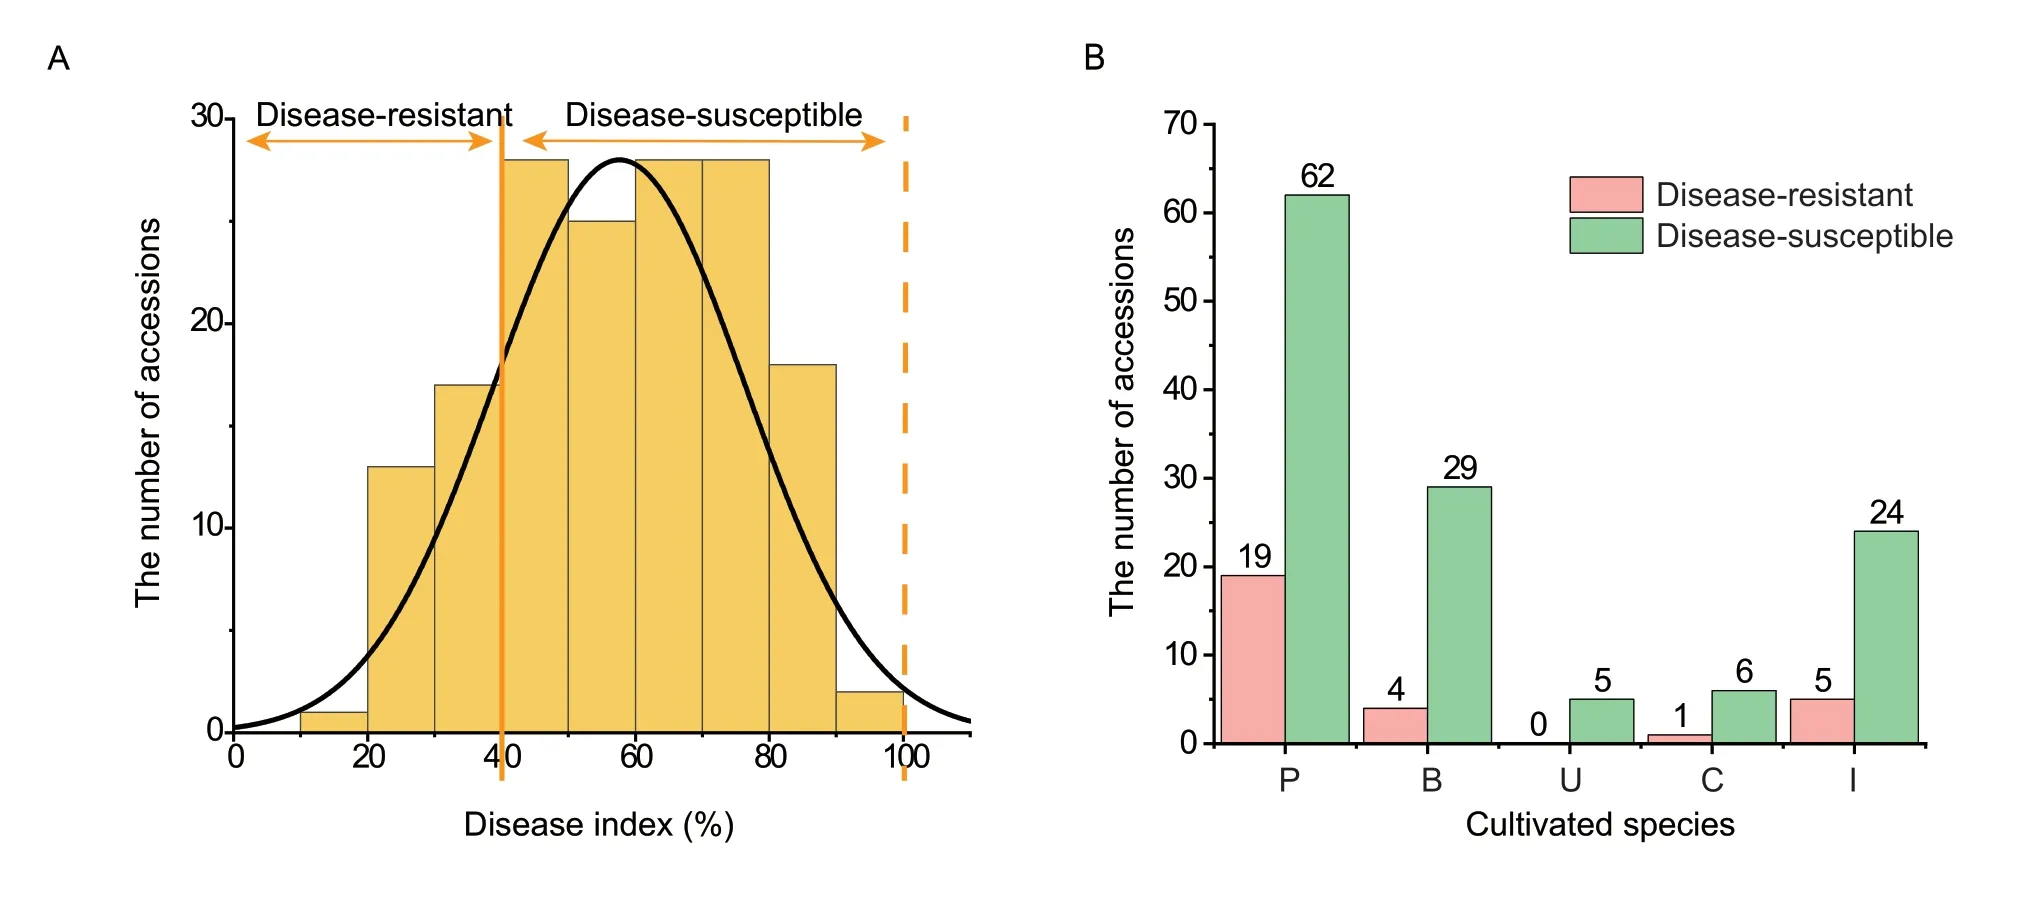
Fig.2 The disease index investigations of 155 accessions genus (Pyrus L.).A,frequency distribution of disease index values of the 155 accessions.B,the number of disease-resistant (pink) and disease-susceptible (green) accessions in the different cultivated species.P,P.pyrifolia;B,P.brestschneideri;U,P.ussuriensis;C,P.communis;and I,interspecific hybrid.
Furthermore,the 155 accessions were classified into five cultivated species.There were clearly more diseasesusceptible accessions than disease-resistant accessions in each pear species (Fig.2-B).Among the 29 resistant accessions,19 accessions ofP. pyrifoliawere resistant to the disease,accounting for 65.52% of all resistant accessions.In addition,four resistant accessions (‘Xueli’,‘Huangxiang’,‘Jinhua’,and ‘Yali’) belong toP.brestschneideri,and five resistant accessions (‘Jimi’,‘Eli No.2’,‘Zhongai No.2’,‘Eli No.1’,and ‘Tienong No.25’) are interspecific hybrids.Only one resistant accession (‘Gaolici’) belongs toP.communis.Furthermore,the most resistant accession was ‘Atago’(P. pyrifolia),while ‘Pugua’,‘Whasan’,‘Gaoyou-1’,‘Long No.10’,‘Jinshui No.3’,‘Gaoyou-2’,and ‘Songdao’,which all belong toP. pyrifolia,were the top ten resistant accessions(Appendix B).All of these resistant accessions could be recommended as parents in future breeding projects.In addition,some of the mainly cultivated sand pear cultivars,such as ‘Cuiguan’,‘Wonhwang’,‘Nijisserki’,and ‘Housui’,exhibited extremely high disease index values,which indicated their high susceptibility to early defoliation and unsuitability for resistance breeding.
To explore the underlying mechanism of the resistance differences,the disease-resistant accession ‘Whasan’(DI=21.37%) and disease-susceptible accession ‘Cuiguan’(DI=86.11%) were selected as representatives for further analysis (Appendix B).The status evaluations of whole trees showed that many more leaves remained on ‘Whasan’than on ‘Cuiguan’ (Fig.3-A).Heathy leaves of ‘Whasan’and ‘Cuiguan’,on which no disease spots were found,were selected as the controls.Comparing the diseased leaves of these two accessions,it was obvious that the diseased area of ‘Cuiguan’ was much higher than that of ‘Whasan’.In addition,the lesion areas showed symptoms of black spots and yellowing (Fig.3-B).The results above indicated significant differences between the resistant accession‘Whasan’ and the susceptible accession ‘Cuiguan’.
Fig.3 The phenotypes of leaves from ‘Cuiguan’ and ‘Whasan’.A,the conditions of whole trees.B,the symptoms of leaves.
3.2.RNA-seq of two pear accessions with contrasting disease resistance
The diseased leaves (DLs),the basal petioles of diseased leaves (DB),the healthy leaves (HLs),and the basal petioles of healthy leaves (HB) of ‘Cuiguan’ (CG) and ‘Whasan’(WS) were collected for sequencing.After RNA-seq,the quality of eight libraries from the 24 samples (three biological replicates were collected for each tissue in the two accessions) was assessed (Appendix C).The number of raw reads for these libraries ranged from 40.7 to 52.9 million.After trimming the reads,a total of 39.1 to 51.4 million high-quality reads and 58.7 to 77.2 billion bases per library were obtained.The average Q20 (sequencing base calls with an error rate of <4%) was more than 98%,and the average GC content (proportion of guanine (G) and cytosine(C) in the nucleotide sequence) was 46.82% (Appendix C).The amount of RNA sequencing data produced for each sample was at least six giga base pairs (Gbps).A total of 34 624 genes were obtained,excluding the genes with RPKM values of 0 in all samples (Appendix D).These results indicated that the sequencing quality was high enough for further analysis.
To investigate the relationships between gene expression and resistance differences,the DEGs in ‘Whasan’ and‘Cuiguan’ were analyzed.The number of DEGs in ‘WS_DL’vs.‘WS_HL’ was the highest (6 262 DEGs).A total of 3 316 DEGs were up-regulated,and 2 946 DEGs were downregulated in this comparison group (Fig.4-A).In contrast,the number of DEGs was the least in ‘CG_DB’vs.‘CG_HB’(441 DEGs).Compared with the healthy basal group,114 and 327 genes were up-regulated and down-regulated,respectively,in the diseased basal sample of ‘Cuiguan’.To further identify the candidate DEGs related to early defoliation,an overlapping analysis was conducted.We speculated that DEGs related to resistance mainly existed in the comparison groups ‘WS_DBvs.WS_HB’ and ‘WS_DLvs.WS_HL’.Finally,444 DEGs were shared in ‘WS_DBvs.WS_HB’ and ‘WS_DLvs.WS_HL’ but not in ‘CG_DBvs.CG_HB’ or ‘CG_DLvs.CG_HL’ (Fig.4-B).To identify the expression patterns of the DEGs,a further cluster analysis was conducted.The expression patterns of DEGs between ‘WS_DB’ and ‘WS_HB’ and between ‘WS_DL’and ‘WS_HL’ showed significantly opposite expression trends (Fig.4-C),indicating the different expression profiles between the healthy and diseased tissues.In addition,most DEGs showed different expression trends between basal petioles and leaves,which suggests that these may be tissue-specific DEGs.Meanwhile,the statistical data showed that 126 DEGs with the highest expression level were centralized in ‘WS_HB’,while only 91 DEGs with the highest expression level were distributed in ‘WS_DB’(Appendix E).
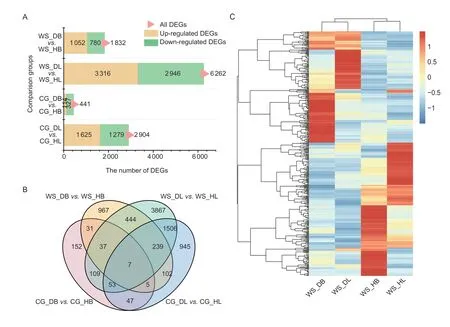
Fig.4 Characteristics of differentially expressed genes (DEGs) related to early defoliation.A,stacked bar diagram showing the number of DEGs among the four comparison groups.Four samples from ‘Cuiguan’ (diseased leaves: ‘CG_DL’;diseased basal:‘CG_DB’;healthy leaves: ‘CG_HL’;healthy basal: ‘CG_HB’) and ‘Whasan’ (diseased leaves: ‘WS_DL’;diseased basal: ‘WS_DB’;healthy leaves: ‘WS_HL’;healthy basal: ‘WS_HB’).All DEGs (pink),up-regulated DEGs (yellow) and down-regulated DEGs (green)are quantified.B,Venn diagram showing the overlap of DEGs among the comparison groups (‘diseased leaves/basal petiole’vs.‘healthy leaves/basal petiole’ for both ‘Cuiguan’ and ‘Whasan’).C,hierarchical clustering of 444 DEGs uniquely expressed in ‘Whasan’ (‘WS_DL’ vs.‘WS_HL’ and ‘WS_DB’ vs.‘WS_HB’).Red represents high expression levels of each gene in certain tissues,and blue represents low expression levels.
3.3.GO enrichment analysis of DEGs in response to early defoliation
The potential functions of the DEGs were further categorized into three groups and 45 enriched terms using GO enrichment analysis (Fig.5-A;Appendix F).In the biological processes,terms related to secondary metabolic,biosynthetic,and regulation processes,such as phenylpropanoid biosynthetic process and chalcone biosynthetic and metabolic process,were mainly enriched (Fig.5-A).Genes related to the reproductive processes (23 genes) and the multi-organism processes (22 genes) were mostly enriched.In contrast,the number of genes associated with chalcone metabolic and biosynthetic processes,regulation of anthocyanin biosynthetic processes,proanthocyanidin biosynthetic processes,and regulation of flavonoid biosynthetic processes was the lowest (two genes) (Appendix F).Moreover,genes related to the regulation of hormone level,response to wounding,and biotic stimulus were also significantly enriched (Fig.5-A),and these are all related to abiotic stress and disease incubation in leaves (Cheonget al.2002;Xuet al.2015).Only a few genes were enriched in protein ubiquitination and protein modification.For the molecular function,the catalytic activity,naringeninchalcone synthase activity,and transferase activity were minor categories.For cellular components,the cell wall,external encapsulating structure,cell periphery,membrane,and exocyst were significantly enriched terms (Fig.5-A).
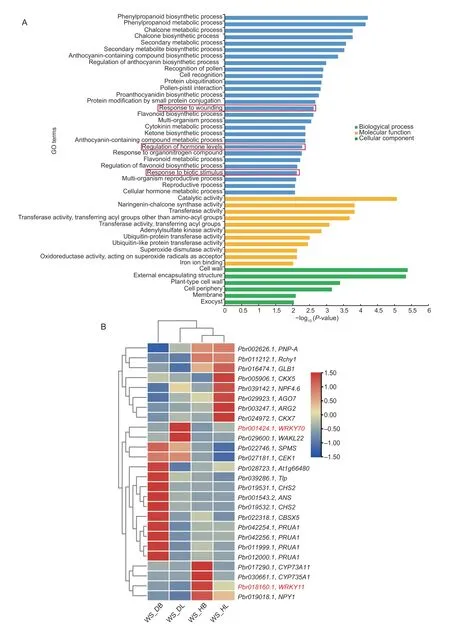
Fig.5 Gene Ontology (GO) functional enrichment analysis of 444 differentially expressed genes (DEGs) uniquely expressed in‘Whasan’.A,GO enrichment of DEGs.Terms marked by red boxes are further analyzed.B,expression profiles of DEGs selected from the red boxes in Fig.5-A.Hierarchical clustering was performed to classify DEGs with similar expression patterns based on normalized reads per kilobase per million (RPKM) values of the DEGs.The blue to red represents the expression levels from low to high.The genes marked in red are the focus.Four samples from ‘Whasan’ (diseased leaves: ‘WS_DL’;diseased basal:‘WS_DB’;healthy leaves: ‘WS_HL’;healthy basal: ‘WS_HB’).
We also analyzed the expression levels of the genes involved in the regulation of hormone level,response to wounding,and biotic stimulus.It was obvious that half of these DEGs (12 DEGs) showed their highest expression levels in the diseased basal petiole of ‘Whasan’,which included DEGs related to spermine synthase,choline/ethanolamine kinase,chalcone synthase,and thaumatinlike protein,among others.In addition,genes encoding cytokinin dehydrogenase showed higher expression levels in healthy ‘Whasan’ leaves.Furthermore,two WRKY TFs,WRKY11 and WRKY22 (Pbr018160.1andPbr032698.1),were highly up-regulated in healthy basal petioles and leaves,respectively (Fig.5-B;Table 2),and they are widelyknown to be related to disease resistance and abiotic stress responses (Meiret al.2010;Aliet al.2018).
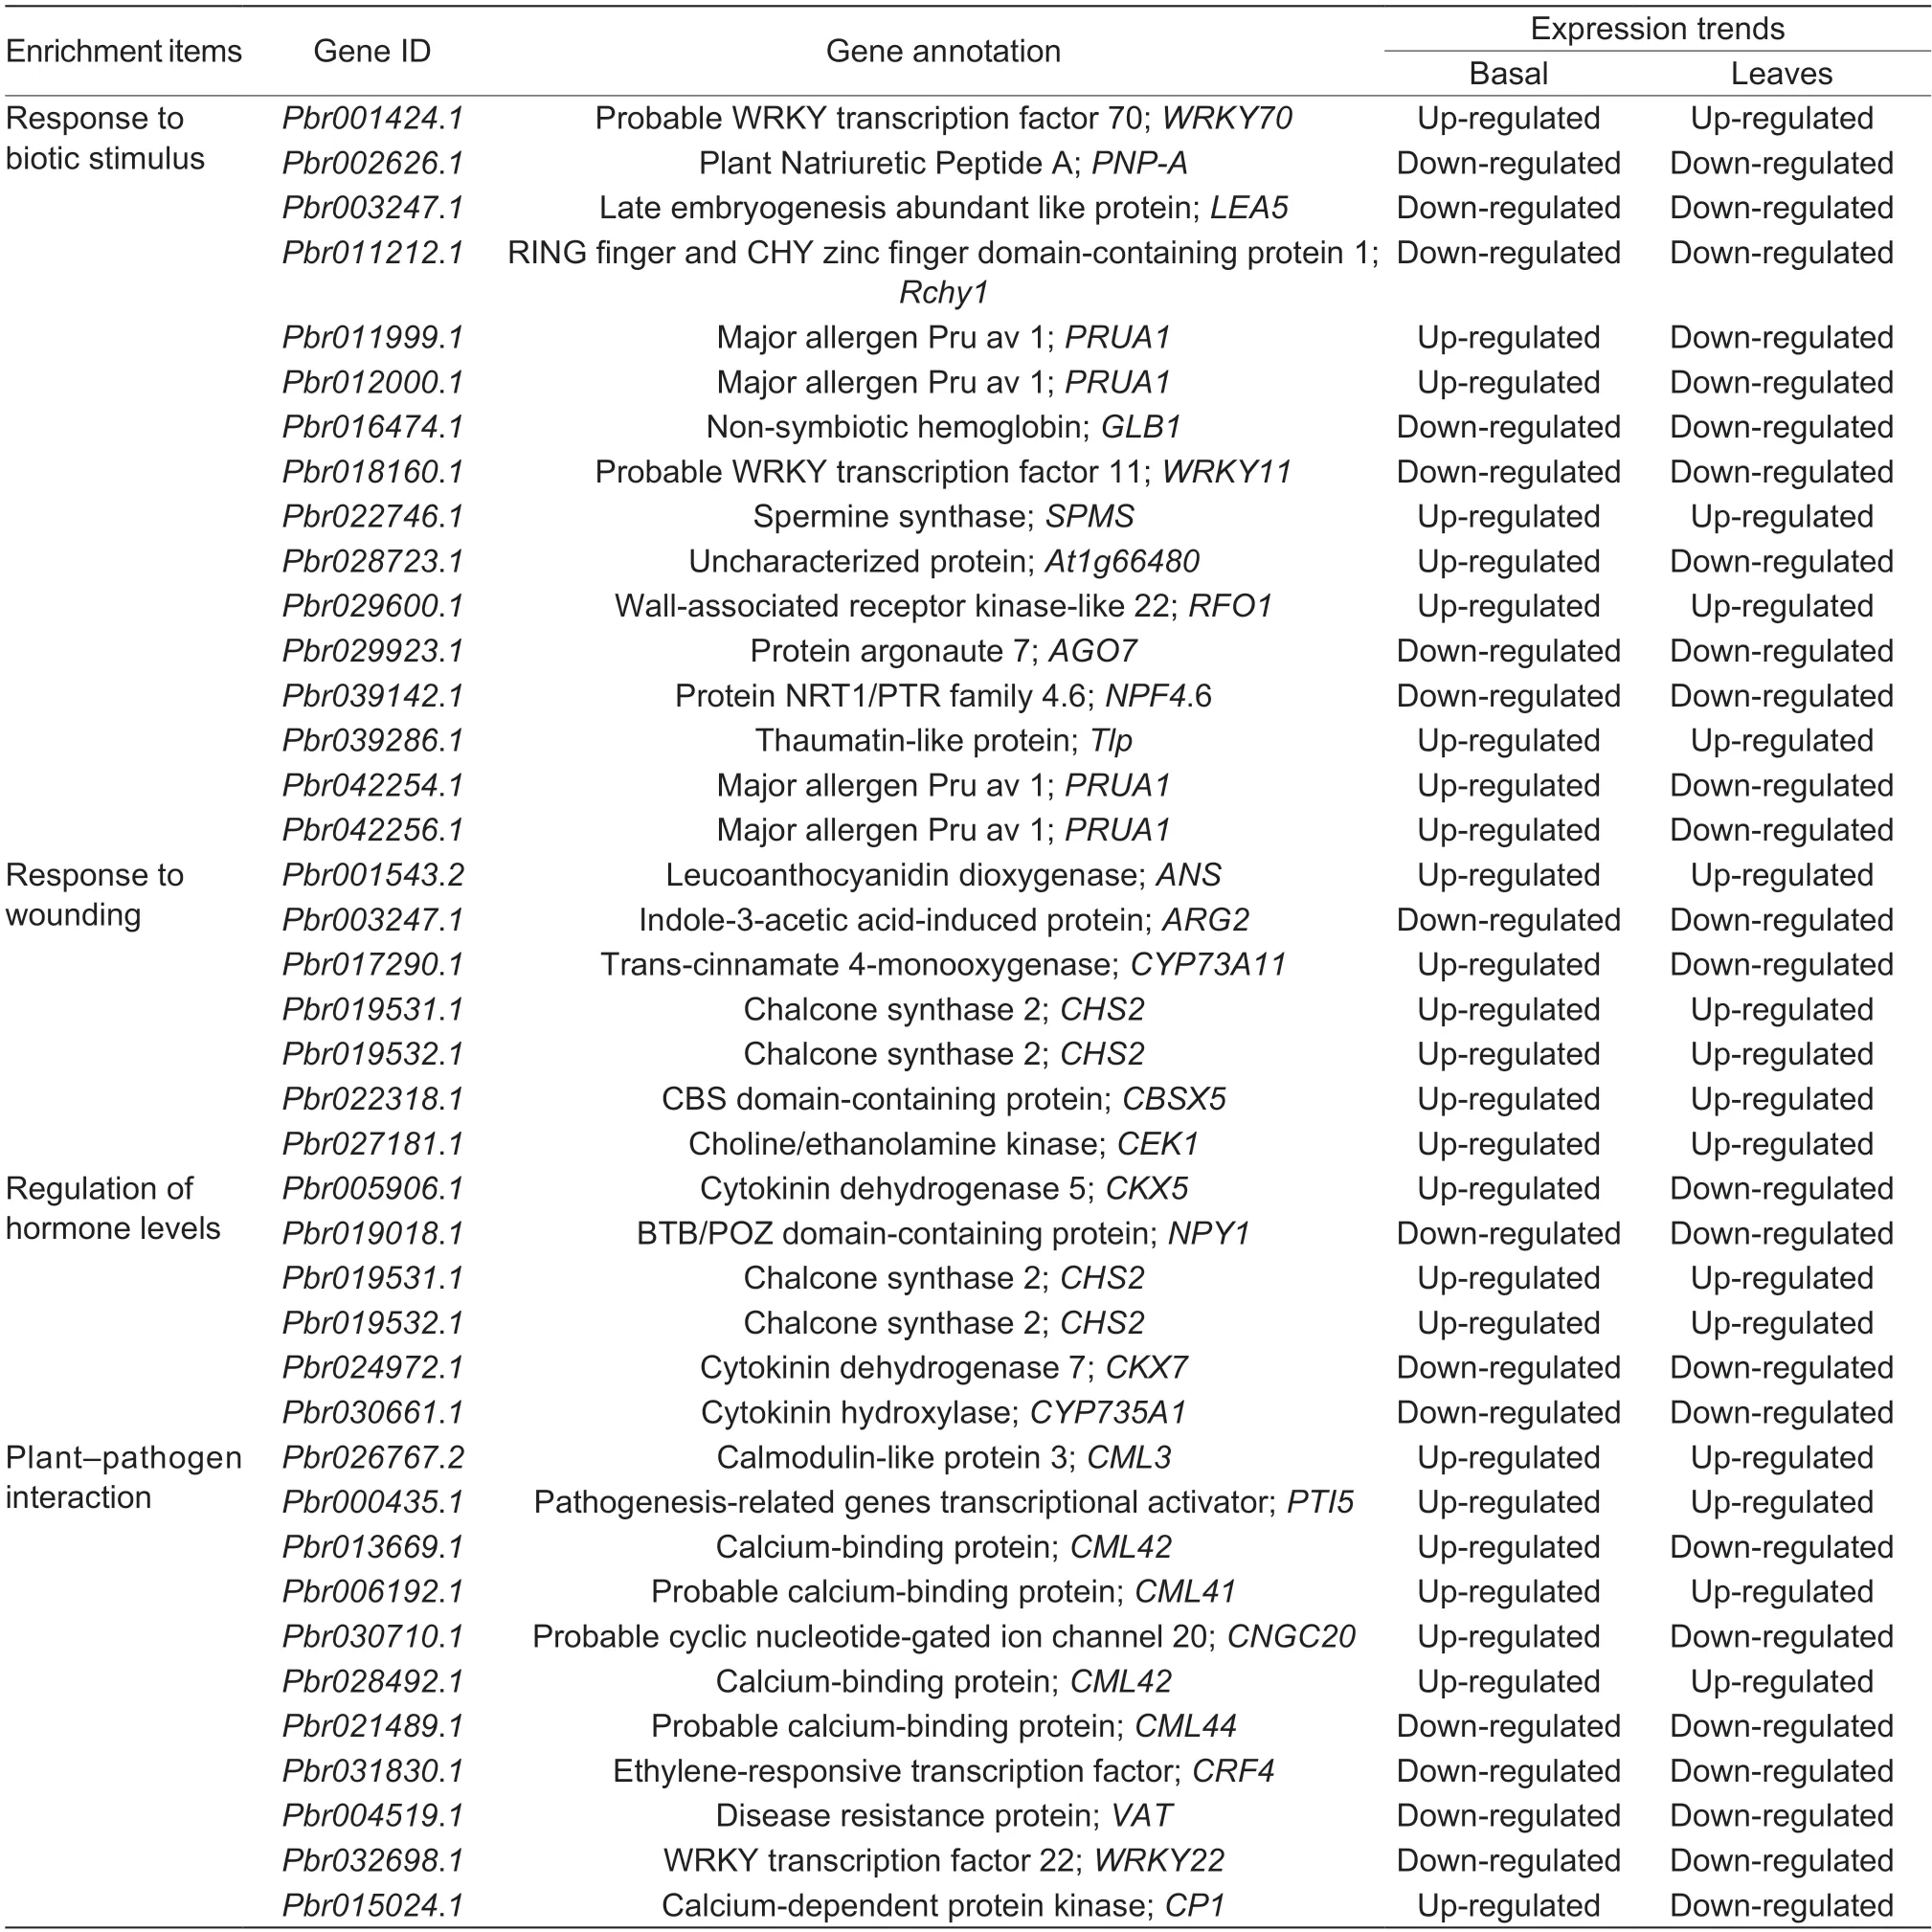
Table 2 The basic information for the 37 candidate differentially expressed genes
3.4.KEGG enrichment analysis of DEGs in response to early defoliation
Subsequently,the KEGG enrichment analysis showed that 69 pathways were enriched.Among them,13 pathways were apparently enriched,with aP-value of ≤0.05 as the threshold (Fig.6).It is significant that flavonoid biosynthesis,the biosynthesis of secondary metabolites,and plant–pathogen interaction were the most abundant.Genes related to metabolic pathways were mostly enriched in 57 genes.Terms annotated as plant–pathogen interactions were significantly enriched in response to stress (Kahlon and Stam 2021).In addition,other pathways,including metabolic pathways,phenylpropanoid biosynthesis,circadian rhythmplant,zeatin biosynthesis,glutathione metabolism,sulfur metabolism,MAPK signaling pathway-plant,pentose and glucuronate interconversions,and other glycan degradation,were enriched,and circadian rhythm-plant was also enriched(Fig.6-A;Appendix G).
To further clarify the cause of early defoliation,we focused on the significantly enriched pathway ‘plant–pathogen interaction’.In this enriched term,genes encoding calmodulin-like proteins (CMLs) were the most common(five genes),and they have been reported to have functions in stress response (Vadasseryet al.2012).Among them,the expression levels ofCML3(Pbr026767.2),CML41(Pbr006192.1),andCML42(Pbr028492.1) increased in the diseased leaves of ‘Whasan’.In contrast,the expression levels of two otherCMLgenes (Pbr021489.1andPbr013669.1) were higher in the healthy leaves of‘Whasan’.In addition,two stress-related TFs (Hsuet al.2013;Jeonet al.2016;Hussainet al.2018),ethyleneresponsive TF (Pbr031830.1) and WRKY TF (Pbr032698.1),were up-regulated in the healthy leaves and basal petioles,respectively (Fig.6-B).
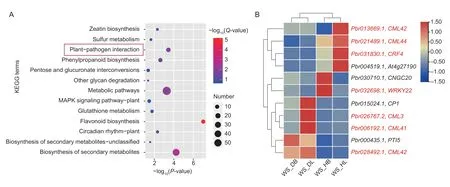
Fig.6 Kyoto Encyclopedia of Genes and Genomes (KEGG) enrichment analysis of 444 differentially expressed genes (DEGs)uniquely expressed in ‘Whasan’.A,KEGG pathway enrichment of DEGs.Red represents a higher significance and blue represents a lower significance.The size of the bubbles indicates the number of genes enriched in each pathway. Terms marked by a red box are further analyzed.B,expression profiles of DEGs selected from the red box in Fig.6-A.Hierarchical clustering was performed to classify the DEGs with similar expression patterns based on normalized reads per kilobase per million (RPKM) values of the DEGs.The blue to red represents the expression levels from low to high.The genes marked in red are on the focus.Four samples from ‘Whasan’ (diseased leaves: ‘WS_DL’;diseased basal: ‘WS_DB’;healthy leaves: ‘WS_HL’;healthy basal: ‘WS_HB’).
3.5.ldentification of DEGs functioning in defense responses and construction of a co-expression network
To comprehensively screen out TFs associated with early defoliation,DEGs from the GO and KEGG analyses were further submitted to PlantTFDB v5.0.The results showed that the genesPbr001424.1,Pbr018160.1,andPbr032698.1were identified as WRKY TFs,whilePbr031830.1was identified as an ERF TF,which was identical with the annotation (Table 2).Interestingly,WRKY and ERF TFs were previously reported to respond to several stressors through an intricate regulatory network in plants (Merajet al.2020).Therefore,to further understand the regulatory mechanism related to the stress responses in early defoliation,a coexpression network was then constructed centering on these four TFs,with the 444 DEGs as the background.Among the 444 DEGs,plant disease resistance genes were identified using PRGdb v4.0.Filtering out the DEGs with a low co-expression weight threshold of 0.02,266 mutual coexpression relationships were identified (Fig.7;Appendix I).A total of 175 DEGs were co-expressed with these four TFs (purple nodes),and 19 plant disease resistance genes (pink nodes) and 40 stress-related genes (orange nodes) were identified among them.It was observed that the node sizes ofWRKY11(Pbr018160.1) andWRKY22(Pbr032698.1) were the largest,indicating that they had the most connections with other DEGs.Most of the DEGs thatWRKY11andWRKY22correlated with were stress related (22 DEGs),and several DEGs were plant disease resistance genes (six DEGs).There was also a strong connection betweenWRKY11andWRKY22(red curved line) (weight value=0.34).Another WRKY TF,WRKY70(Pbr001424.1),was mostly correlated with plant disease resistance genes (13 DEGs) and several stress-related genes (two DEGs).Furthermore,an ERF family memberCRF4was mostly correlated with stress-related genes(20 DEGs).These results suggest that these four TFs are closely related to plant disease defense and stress responses and may play important roles in the response to early defoliation.In addition,53 plant disease resistance genes were predicted in the resistant accession ‘Whasan’(Appendix H),representing 11.94% of the unique ‘Whasan’DEGs.These resistance genes shared seven domains.Most of the genes (19 DEGs) contained transmembrane domains,and only one DEG belonged to the coiled-coil domain.Furthermore,the leucine-rich repeat domain (10DEGs),lectin-like motifs (seven DEGs),nucleotide-binding site (four DEGs) and kinase domain (three DEGs) were also identified (Table 3).According to their various domains,the DEGs were mainly divided into four classes,including the RLP (15 DEGs),KIN (eight DEGs),LECRK (seven DEGs),and RLK (seven DEGs) classes (Table 4).
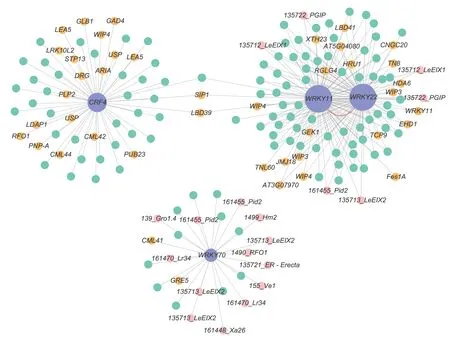
Fig.7 Co-expression network of differentially expressed genes centralized on the WRKY and ERF transcription factors.Cytoscape representation of the co-expressed genes with edge weights of >0.02.Purple nodes indicate transcription factors,pink nodes indicate plant disease resistance genes and orange nodes indicate stress-related genes.Transcription factors and plant diseased resistance genes,as well as stress-related genes,are connected via undirected lines.The red curved line indicates the interaction between WRKY11 and WRKY22.
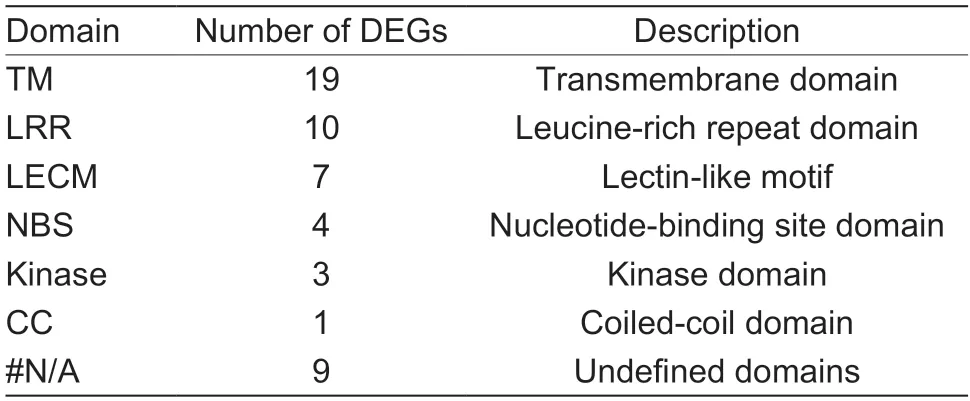
Table 3 Summary of predicted pear resistance genes

Table 4 Summary of predicted resistance differentially expressed genes (DEGs)
3.6.Validation of RNA-seq data by qRT-PCR
As discussed above,our analyses identified some critical genes,including TFs,such as WRKY and ERF TFs,CMLs,and plant disease resistance genes.The expression levels of these genes were verified by qRTPCR.TFs play essential roles in regulating stress-related genes.The expression level ofWRKY70in ‘Cuiguan’was higher than that in ‘Whasan’,whileCRF4showed higher expression levels in ‘Whasan’.Additionally,in‘Whasan’,the expression level ofWRKY22in healthy leaves was higher than that in diseased leaves.CMLs are reported to be related to stress responses.In the present study,the expression levels ofCML44andCML42were higher in ‘Whasan’ compared to ‘Cuiguan’.In addition,compared with healthy leaves,CML3andCML41were up-regulated in the diseased leaves in ‘Whasan’.The expression levels of plant disease resistance genes were also verified.In ‘Whasan’,LeEIX2andRFO1were significantly up-regulated in the diseased leaves compared with the healthy leaves.Various expression levels of the abovementioned genes in different disease-resistance accessions and tissues verified the importance of those genes in regulating the response to stress,which was related to early defoliation.Moreover,we compared the results of qRT-PCR with the RPKM values of these genes.The correlation coefficient between them was calculated by applying the correlation function,and the value was defined as “r”.The results show a high correlation between the transcriptome data and qRT-PCR (average “r”=0.71),indicating the reliability of the transcriptome data (Fig.8).
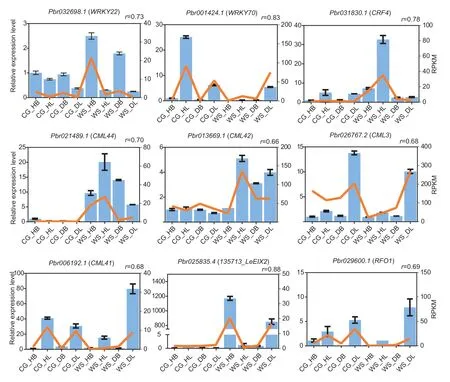
Fig.8 qRT-PCR validation of the nine selected differentially expressed genes from Gene Ontology (GO) and Kyoto Encyclopedia of Genes and Genomes (KEGG) analysis.The blue bars represent relative expression level corresponding to the left Y-axis.The orange lines represent reads per kilobase per million (RPKM) values from RNA-Seq data.“r” represents the correlation coefficient between RPKM and relative expression data.Four samples are from ‘Cuiguan’ (diseased leaves: ‘CG_DL’;diseased basal:‘CG_DB’;healthy leaves: ‘CG_HL’;healthy basal: ‘CG_HB’) and ‘Whasan’ (diseased leaves: ‘WS_DL’;diseased basal: ‘WS_DB’;healthy leaves: ‘WS_HL’;healthy basal: ‘WS_HB’).The error bars represent the standard deviations (n=3).
4.Discussion
4.1.The assessment of resistance and susceptibility to early defoliation in pear accessions
In the present study,we performed field investigations on 155 pear accessions,and the DI was calculated to evaluate the resistance of these accessions to early defoliation(Appendix B).The results clearly show that the diseasesusceptible pear accessions (126 accessions) outnumbered the disease-resistant accessions (29 accessions) (Fig.2).Among the resistant accessions,19 belonged toP.pyrifolia,which indicated that sand pear accessions might be more resistant to early defoliation,which was similar to previous research (Liet al.2017).Accession ‘Whasan’ exhibited strong resistance to early defoliation (Appendix B;Fig.3).Similarly,a previous study reported that the symptom of early defoliation in ‘Whasan’ was only mild even during the rainy season (Wanget al.2016).Notably,sand pear‘Atago’ showed the strongest resistance among the 155 accessions (Appendix B).Previous reports indicated that‘Atago’ showed high resistance to diseases such as black spot and pear leaf spot (Chen 2008;Denget al.2008),which are the common diseases causing early defoliation (Bell and van der Zwet 2005;Tanahashiet al.2016).Furthermore,several accessions were found to show tolerance to early defoliation (Appendix B),such as ‘Pugua’,‘Gaoyou-1’ and‘Jinshui No.3’.Interestingly,the female parent of ‘Kousui’is ‘Kikusui’,and the disease index values of these two accessions are similar (Appendix B).Previous studies indicated that the resistance is an inheritable trait in pears(Bueset al.2000;Ohet al.2021).Therefore,we speculate that the resistance of ‘Kikusui’ could be passed on to the progeny.For the other resistant accessions evaluatedviathis field investigation,we can use their parents for mining more resistant germplasm resources,and all of the 29 identified resistant accessions can provide useful breeding resources for early defoliation resistance.
Among the disease-susceptible accessions,‘Cuiguan’was one of leading cultivars in South China (Gaoet al.2021),and the occurrence of early defoliation was widespread after exposure to stress (Liuet al.2011;Huanget al.2018;Yanget al.2018).Consistent with those findings,‘Cuiguan’ was also evaluated as a disease-susceptible accession in our study.Another sand pear accession,‘Wonhwang’,showed susceptibility to early defoliation,which was consistent with previous research (Wanget al.2016).Other accessions,such as ‘Housui’,‘Nijisserki’,and ‘Niitaka’ (Appendix B),which have not been reported as resistant to early defoliation,were also evaluated as susceptible accessions in this study.Therefore,we propose that these disease-susceptible accessions should not be recommended as parents for resistance breeding,and effective measures must be taken to alleviate early defoliation in these susceptible accessions.Recently,bioorganic fertilizer treatment (BIO,2%,w/w)or BIO combined with humic acid (HA) was reported to be effective for alleviating the early defoliation in pear(Kanget al.2021).In addition,the fact that the proportion of resistant accessions,i.e.,those with disease severity evaluated as levels 0,1 and 3,was more than 60% will be instructive for evaluating resistant or susceptible accessions more directly during field investigations.
4.2.Stress response-related TFs were induced by early defoliation
The GO and KEGG enrichment analyses and WGCNA revealed a correlation between TFs and the DEGs enriched in stress response,indicating that the occurrence of early defoliation might be closely related to the stress response.It is well known that differential responses to many stressors in plants are carried out by an intricate regulatory network of transcription repressors and activators,including the common TFs AP2/ERF,WRKY,bHLH,bZIP,MYB,and NAC(Merajet al.2020).Early defoliation is induced by complex stimuli,and plants will have corresponding reactions through their regulatory circuits.The roles of WRKY TFs in plant defense have been reported,and they occupy a central position mediating fast,positive,and negative regulation of disease resistance (Meiret al.2010) and play a profound role in abiotic stresses (Aliet al.2018).Notably,WRKY TFs were identified by GO and KEGG enrichment analyses and WGCNA in the present study,which indicated that they might play a role in the pear tree response to early defoliation.WRKY22is known to positively regulate resistance to pathogens inArabidopsisand pepper,and the loss of function ofWRKY22enhances susceptibility to disease in these two plants (Hsuet al.2013;Hussainet al.2018).Similarly,WRKY11positively enhances the salt and drought stress tolerance of tobacco and rice (Xuet al.2014;Leeet al.2018).It was also demonstrated thatMsWRKY22directly binds to the W-box (elements in the promoter region ofMsWRKY11,[(T)(T)TGAC(T/C)]) and activatesMsWRKY11expression in alfalfa (Wenet al.2021).In the present study,the expression patterns ofWRKY11andWRKY22were similar,and they showed higher expression levels in healthy tissues (Table 2).Additionally,a strong correlation was found betweenWRKY11andWRKY22(weight value=0.34) (Fig.7;Appendix I) in the co-expression network.We also found that a W-box (TTGACC) exists in the promoter ofWRKY11(Appendix J) (PlantCARE,http://bioinformatics.psb.ugent.be/webtools/ plantcare/html/),which was similar to previous findings (Wenet al.2021).Thus,we speculate thatWRKY22might activateWRKY11by binding to the W-box,thereby enhancing plant resistance to stress,and leading to less early defoliation.AnotherWRKYmember,WRKY70,was found to have a higher expression level in diseased tissues.This result was also found in the shoot tissues of susceptible chickpea,whereCaWRKY70was significantly accumulated under Foc1 (Fusarium oxysporum) infection (Chakrabortyet al.2020).The different expression patterns in the present study indicated that WRKY TFs might function redundantly in plant defense.
As plant-specific TFs,AP2/ERF TFs are widely involved in various biological processes,especially in abiotic stimuli tolerance (Liu X Met al.2020).Cytokinin response factors(CRFs) are a subfamily of AP2/ERF that are involved in stress responses,including oxidative stress,drought stress,and disease defense (Guet al.2002;Shiet al.2014;Hugheset al.2021).AtCRF2,a homologous gene ofCRF4inArabidopsis,positively regulates plant immunity and has a strong correlation with the cold response (Jeonet al.2016).The overexpression ofCRF4leads to a stronger tolerance to freezing upon exposure to freezing temperatures,while mutants lackingCRF4expression are more sensitive to freezing (Zwacket al.2016).In the present study,CRF4showed a higher expression level in ‘Whasan’,which might be the reason why that accession showed stress resistance,contributing to its tolerance to early defoliation.In addition,WGCNA showed thatCRF4was co-expressed with stressrelated genes,indicating its possible role in causing leaf resistance.
4.3.Resistance genes of pears in response to early defoliation
Recent studies have shown that the signaling pathway regulates defoliation (Xuet al.2019;Liet al.2020).It is widely known that Ca2+is a mediator that plays an important role in plant signaling in response to biotic and abiotic stresses (Kudlaet al.2010).CMLs are major Ca2+sensors controlling various cellular functions (Chevalet al.2013),and they play a wide array of roles in stress perception.In the present study,CML44(Pbr021489.1) andCML42(Pbr013669.1) exhibited up-regulated trends in healthy leaves,which were consistent with those inArabidopsis(Chiassonet al.2005).AnotherCML42(Pbr028492.1)showed the opposite expression trends,and was highly expressed in diseased leaves.This difference could be explained by multiple functions under different stimuli,as was shown in a previous study in whichCML42was reported to function as a negative regulator in herbivory defense and as a positive regulator in the defense against UV-B stress(Vadasseryet al.2012).In addition,the co-expressed network showed various relationships betweenCMLs and TFs,including CRF4,WRKY70,and other TFs (Fig.7;Appendix I),which might lead to differentCMLfunctions for plant defense.A previous study showed that WRKY TFs were predicted asCMLtarget genes (Navarroet al.2004).Thus,it can be presumed that probable regulation or interaction relationships might exist between these two TF types and severalCMLs,resulting in different roles for theCMLs and subsequently influencing the disease resistance of plants.However,the specific correlations between other TFs andCMLs are unclear.Additionally,the direct connection between early defoliation and the Ca2+signaling pathways remains complex,and these issues are worthy of further exploration.
Plants are usually attacked by a variety of pathogens,such as fungi,viruses,and bacteria.In this study,the “plant–pathogen interaction” term was significantly enrichedviaKEGG enrichment analysis,implying that early defoliation might be related to plant pathogens.In our study,53 plant disease resistance genes were uniquely identified in the resistant accession ‘Whasan’ using PRGdb v4.0 (Appendix H),which may be related to the greater resistance of ‘Whasan’.Resistance genes were developed during the long battle between plants and pathogens,and they present the plant with specific receptors and defense mechanisms (Andolfo and Ercolano 2015).These genes share some conserved domains and are categorized into various classes according to the arrangements of their domains (Calle Garciaet al.2021) (Tables 3 and 4).Leucine-rich repeats (LRRs),the major domain found in most classes of resistance genes,are essential for recognition specificity and resistance.For example,the polygalacturonase-inhibiting proteins (PGIPs)contain an LRR domain,which limits the growth of plant pathogens and induces the defense responses in plants (Diet al.2006).LeEix proteins belong to RLP (containing an LRR and a transmembrane domain),and initiate a defense response upon induction by ethylene-inducing xylanase(EIX) of non-pathogenicTrichodermain tomato (Kruijtet al.2005).However,there are receptors that contain domains other than LRRs.RFO1 is a receptor-like kinase with no extracellular LRR domain,and it encodes a new type of disease-resistance protein that imparts resistance to a broad spectrum ofFusariuminArabidopsis thaliana(Diener and Ausubel 2005).Pid2belongs to a new resistance class,LECRK,that contains lectin-like motifs instead of the LRR domain,and it elicits resistance to blast fungi in rice (Wanget al.2015).A previous study showed thatWRKYcould be involved in the process of plant defense by regulating resistance genes (Renet al.2021).In our study,these resistance genes were co-expressed with WRKY TFs(Fig.7).We predicted that the higher resistance of ‘Whasan’was not merely due to the existence of resistance genes but also due to the potential interactions between WRKY TFs and resistance genes.
5.Conclusion
In this study,we performed field investigations and assessed the early defoliation resistance of 155 pear accessions.A total of 126 accessions were susceptible to early defoliation and 29 accessions were resistant.Among them,we selected two sand pears (P. pyrifolia),a disease-resistant accession‘Whasan’ and a disease-susceptible accession ‘Cuiguan’,for a subsequent RNA-seq analysis.A total of 444 genes were uniquely differentially expressed in the resistant accession‘Whasan’,compared with the susceptible accession‘Cuiguan’.Further functional enrichment analysis of these DEGs confirmed that early defoliation was related to plant–pathogen interaction,wounding,biotic stimuli response,and hormone level regulation.Combined with WGCNA and enrichment analysis,some WRKY and ERF TFs were identified as potentially essential TFs in response to early defoliation.Meanwhile,the different expression levels of these genes,which were verified by qRT-PCR,indicated their importance in early defoliation.These results provide new insights into the potentially essential genes that respond to early defoliation in pear and lay a foundation for future research on the molecular breeding of resistant accessions.
Acknowledgements
This work was supported by the earmarked fund for Jiangsu Agricultural Industry Technology System,China (JATS[2021]453),the National Key Research and Development Program of China (2021YFD1200200),and the earmarked fund for China Agriculture Research System (CARS-28).We thank the State Key Laboratory of Crop Genetics and Germplasm Enhancement,Centre of Pear Engineering Technology Research,and the Bioinformatics Center of Nanjing Agricultural University,China for supporting this project.
Declaration of competing interest
The authors declare that they have no conflict of interest.
Appendicesassociated with this paper are available on http://www.ChinaAgriSci.com/V2/En/appendix.htm
 Journal of Integrative Agriculture2023年1期
- Journal of Integrative Agriculture的其它文章
- Less hairy leaf 1,an RNaseH-like protein,regulates trichome formation in rice through auxin
- Characterization of a blaCTX-M-3,blaKPC-2 and blaTEM-1B co-producing lncN plasmid in Escherichia coli of chicken origin
- Consumers’ experiences and preferences for plant-based meat food: Evidence from a choice experiment in four cities of China
- Farmers’ precision pesticide technology adoption and its influencing factors: Evidence from apple production areas in China
- Visual learning graph convolution for multi-grained orange quality grading
- lnfluence of two-stage harvesting on the properties of cold-pressed rapeseed (Brassica napus L.) oils