
Advanced magnetic resonance imaging findings in salivary gland tumors
2022-09-01 05:39:20ErkanMuratBeyhan
World Journal of Radiology 2022年8期
INTRODUCTION
Salivary gland tumors (SGTs) account for approximately 3%-5% of all head and neck tumors[1-3]. The majority of SGTs occur in the parotid glands, followed by those arising from the submandibular glands, minor salivary glands, and sublingual glands[3-6]. While the majority of those developing from the parotid glands are benign, the incidence of malignancy increases in tumors in other glands. In SGTs for which operation is planned, it is essential to determine the preoperative characterization of the tumor, its number, location (localization in the superficial or deep lobe for the parotid gland), extension to the surrounding tissues and lymphatic involvement[7]. The most effective radiological method in operative planning is magnetic resonance imaging (MRI). Conventional sequences may be insufficient to characterize SGTs. For this reason, in recent years, it has been tried to characterize tumors with advanced MRI applications [diffusion-weighted imaging (DWI) MRI, dynamic contrast-enhanced (semi-quantitative) MRI, perfusion (quantitative) MRI, diffusion tensor imaging (DTI), MR spectroscopy (MRS)
][1-5]. In this review, it is aimed to evaluate the imaging findings detected in advanced MRI applications of SGTs.
DWI
DWI is an imaging method that detects the motion of water molecules and allows calculation with the apparent diffusion coefficient (ADC). DWI, which can determine the cellularity and microstructural properties of tissues, can contribute to the differentiation of tumors[8-11]. When the studies on SGT were reviewed, some studies stated that the ADC values of malignant and benign tumors (BTs) were significantly different[12-16], while in some studies no significant difference was found[17,18], but in most of these studies, it was reported that ADC values were more effective in separating subgroups [pleomorphic adenomas (PMAs), Warthin’s tumors (WTs) and lymphoma]. In the literature, mean ADC values of malignant SGTs are (0.8-1.53) × 10
mm
/s that of benign SGTs is (1.04-1.72) × 10
mm
/s reported in the range[16-21]. Although ADC values overlap in some SGTs due to the nature of the components they contain, we can generalize the mean ADC values of SGTs as malignant lymphomas < WTs < carcinomatous malignant tumors (MTs) < PMAs.
One night, the girl caught ill. In moment of fluster9() , instead of calling her parents, she dialed the new boy s cell phone. The boy was already asleep but his cell phone was still on.
SEMI-QUANTITATIVE DYNAMIC CONTRAST-ENHANCED MRI
Dynamic contrast-enhanced (DCE) MRI in tumoral lesions is the acquisition of multiple T1-weighted images (T1WI) within a few minutes following contrast material administration to monitor contrast agent uptake and wash-out. On DCE MRI, the time intensity curve (TIC) is obtained in connection with the signal changes that occur with the passage of the contrast material through the tissues and the washout processes from the tissues. Slope, signal intensity (SI) peak, time to peak (Tpeak), enhancement ratio and wash-out ratio (WR) values can be obtained semi-quantitatively from the TIC curve. In the literature, different TIC patterns have been defined based on the Tpeak and wash-out values of SGTs[14,22-27]. The most preferred TIC patterns were those described by Yabuuchi
[24]. Tumor cellularity and vascularity are correlated with TIC patterns. Tpeak is related to the microvessel number and tends to be short when the microvessel count is high. Wash-out is dependent on the cellularity and stromal grade, with cellular tumors being wash-out more rapidly[3,24]. When we evaluate the TIC patterns of SGTs, in general, PMAs tend to demonstrate progressive enhancement due to low microvessel content and cellularity-stromal grade. WTs and lymphomas show rapid enhancement and wash-out because of their high microvessel content and cellularity-stromal grade. MTs show rapid enhancement and washout due to high microvessel count and lower cellularity-stromal grade, but they tend to have a lower and slower wash-out compared to WTs[3]. TIC analysis can reveal physiological characterizations of different tissues using the blood flow properties of SGTs[26,28]. Despite overlapping TIC patterns in some SGTs, semi-quantitative DCE MRI is an imaging modality that can help differentiate subtypes of SGTs.
King Cloverleaf and Queen Frivola had but one child, and this Princess had from her very babyhood been so beautiful, that by the time she was four years old the Queen was desperately2 jealous of her, and so fearful that when she was grown up she would be more admired than herself, that she resolved to keep her hidden away out of sight
QUANTITATIVE DCE PERFUSION MRI
On DCE MRI, in addition to semi-quantitative examination with TIC parameters, quantitative perfusion MRI can be performed. In the literature, perfusion parameters such as Ktrans [volume transfer constant between blood plasma and extracellular extravascular space (EES)], Kep (flux rate constant between the EES and plasma), and Ve (EES fractional volume) have been studied in SGTs on quantitative DCE perfusion MRI[29]. In the literature, the Ktrans values of PMAs were found to be lower than the Ktrans values of other SGTs. However, while some studies stated that the Ktrans values of PMAs differ significantly from those of other SGTs[29,30], some studies could not detect a significant difference[31]. In studies in the literature, Kep values were found to be lowest in PMAs and highest in WTs. In some studies[29,31], the Kep values of PMAs, WTs and MTs differed significantly, while in some studies only the Kep values of WTs differed significantly from the other SGTs[30]. In the literature, it was found that mean Ve values of WTs were significantly lower than the Ve values of other SGTs[29-31].
DYNAMIC SUSCEPTIBILITY CONTRAST PERFUSION-WEIGHTED MRI
Dynamic susceptibility contrast (DSC) perfusion-weighted MRI measures signal loss during passage of a non-invasive contrast bolus through a tumor and can be performed using the bolus tracking technique that follows the first passage of contrast material through a capillary bed. DSC perfusion-weighted MRI is increasingly used as a diagnostic and research tool and to assess the extent of capillaries and microvasculature, mostly in central nervous system tumors. DSC perfusion-weighted MRI contributes to the assessment of tumor angiogenesis as the degree of signal loss depends on the volume of the intravascular space within a tumor and the concentration of injected contrast material in the blood[32]. There is a limited number of studies in the literature that have performed DSC perfusion-weighted MRI for SGTs and differing results have been obtained. In the study of Abdel Razek and Mukherji[33] on parotid tumors, it was reported that the mean DSC % values of both MTs and all BTs as well as PMAs, WTs and MTs were significantly different. Park
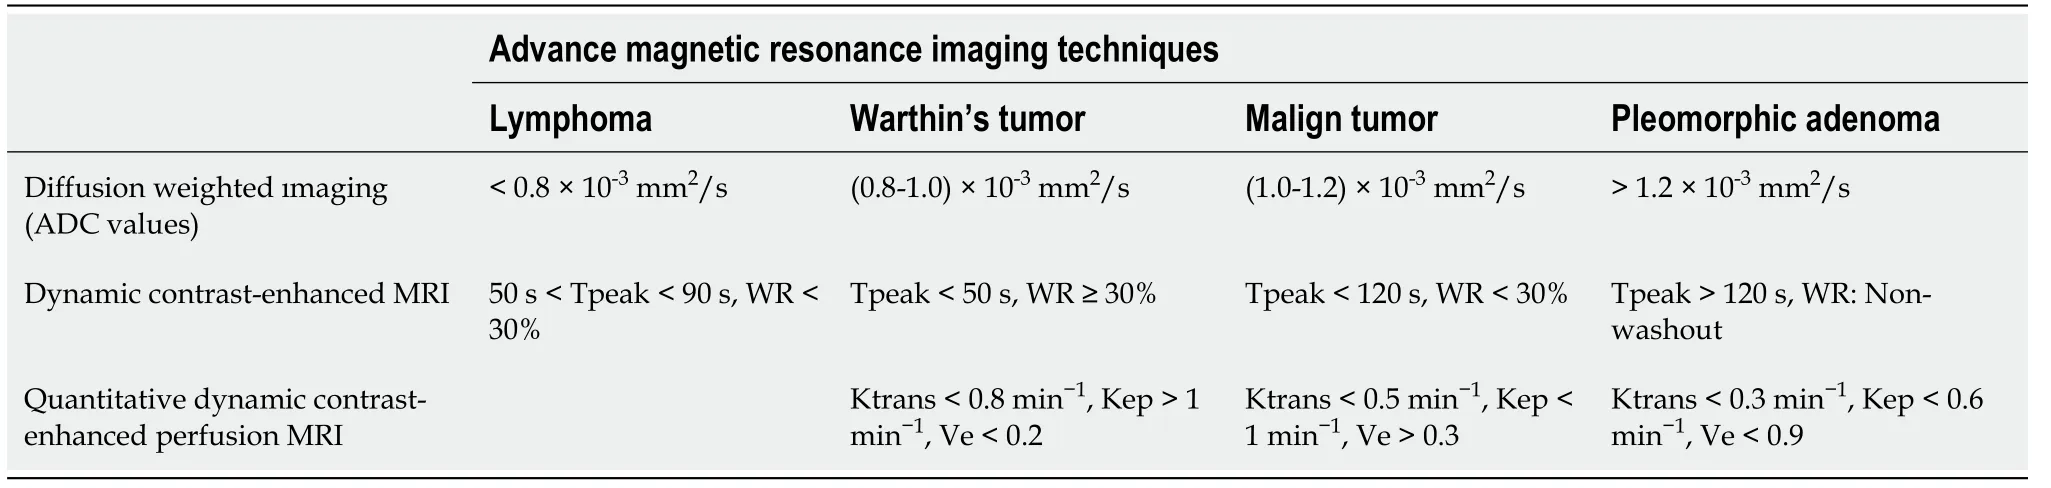
[32] found that WTs tended to have higher DSC % values than malignant parotid tumors, although there was no significant difference. The parameters used in the evaluation of SGTs on some advanced MRI techniques are shown in Table 1.
A few days before his death, Tyler beckoned7 me over to his hospital bed and whispered, I might die soon. I m not scared. When I die, please dress me in red. Mom promised she s coming to heaven, too. I ll be playing when she gets there, and I want to make sure she can find me.
Tell me, who might the owner of this forest [meadow, town} be? King Thrushbeard owns the forest and all you can see Alas, poor me! What can I do?I should have wed12 King Thrushbeard. If only I knew (Complete 193).
PSEUDO/PULSED CONTINUOUS ARTERIAL SPIN LABELING PERFUSION MRI
Arterial spin labeling (ASL) provides measurement of tumor blood flow (TBF) using the magnetization of protons in arterial blood as an intrinsic tracer without the use of contrast material[34,35]. High vascularity, increased tumor blood volume, arterio-venous shunt formation, altered capillary transit time and increased the capillary permeability may lead to high TBF values in MTs. There is a limited number of studies in the literature that have performed ASL perfusion-weighted MRI for SGTs[35]. Razek[35] reported that TBF values of malignant SGTs were significantly higher than benign SGTs.
Beautiful flowers, round which little bells were tied, stood in the corridors: what with the running to and fro and the draught, these bells tinkled so loudly that no one could speak to be heard
DTI
DTI provides the ability to distinguish between different tissue compartments at the cellular level, with different matrices that reflect the micromovement of water molecules. The most common DTI metrics used are fractional anisotropy (FA) and mean diffusivity (MD). MD is the average diffusivity along three orthogonal planes in the x, y, z directions of the tensor, equal to the mean of the three eigenvalues and equal to the ADC value. As the cellularity of the tumor increases, the MD value decreases. FA indicates the level of directionality of tissue microstructure in water diffusion and correlates with structural tissue orientations. FA correlates linearly with tumor cellularity and grade of malignancy. Abdel Razek
[33] found a significant difference between the MD values of malignant and benign SGTs. At the same time, significant differences were found between the FA values of MTs and BTs in DTI studies performed for SGTs[20]. WTs, which are rich in lymphoid content and have high anisotropy, have the highest FA levels among benign SGTs[20,33].
DIFFUSION KURTOSIS IMAGING
Diffusion kurtosis imaging (DKI) is a complex method that uses the non-Gaussian movement of water molecules in tissues. The MRIs are obtained based on the diffusion and microstructural features resulting from the organization of water molecules. A minimum of three
values are required on the DKI[36]. In the literature, some authors reported that DKI is useful in defining benign and malign SGTs, while some authors reported that no significant difference was found in distinguishing BTs and MTs. However, some of these authors reported that DKI parameters [ADC (D
) and apparent kurtosis coefficient (K
)] differ significantly in PMAs compared to other SGTs[30,37].
Carcinoma ex pleomorphic adenoma arises in connection with a primary or repeating benign PMA. About 1.5% of pleomorphic adenoma cases develop carcinoma ex pleomorphic adenoma in five years, and 10% of them in 15 years. In this condition, a painless mass still for many years starts growing. They appear in MRI as masses with ill-defined borders extending into surrounding tissues, discontinuous hypointense rim and mediate to low heterogeneous SI on T2WI[74]. On DWI studies, carcinoma ex PMAs were reported to have ADC
values in the range of [(0.82 ± 0.01)-(1.32 ± 0.035)] × 10
mm
/s[9,13,17]. Zheng
[52] found that Tpeak of carcinoma ex PMA was 120 s or less while their WR was less than 30% on DCE MRI.
INTRAVOXEL INCOHERENT MOTION MRI
Intravoxel incoherent motion (IVIM) provides both true molecular diffusion and motion of water molecules in the capillary network can be estimated with a single diffusion-weighted acquisition technique. Microvascular volume fraction (f), pure diffusion coefficient (D), and perfusion-related incoherent microcirculation (D*) parameters are used on IVIM. Single-shot spin-echo echo-planar imaging with multiple
values usually ranging from 0-800 s/mm
is used to generate IVIM MRI. Sumi and Nakamura[26] reported that WTs had significantly higher
values than PMAs. In addition, Sumi and Nakamura[26] reported that
and
* values contribute to the differentiation of WTs, PMAs, and MTs, and even the use of these parameters together provides 100% diagnostic accuracy.
PROTON MRS
Metabolite concentration in tissues and organs is measured in Proton MRS (1H-MRS) and used to characterize metabolic changes associated with tumors. Proton MRS in neoplasms uses a diagnostic algorithm based predominantly on the detection of high levels of choline compounds. Choline is an indicator of cellular proliferation and cell membrane transformation[38]. A limited number of studies have been conducted in the literature with MRS in SGTs[39]. King
[39] reported that Cho/Cr ratios were significantly different between PMAs and WTs, and between BTs and MTs.
SGTS
According to the 4
edition of the World Health Organization (WHO)’s head and neck tumors classification published in 2017, SGTs are classified as MTs, BTs, non-neoplastic epithelial lesions, benign soft tissue lesions and haematolymphoid tumors[40]. WHO’s head and neck tumors classification version 4 is given in Table 2. Despite efforts to simplify this classification, there are still more than 30 entities. MTs were divided into 20, BTs 11, non-neoplastic epithelial lesions 4, benign soft tissue lesions 3 subgroups. Two new entities have been added to this classification: Secretory carcinoma [known as mammary analogue secretory carcinoma (MASC)] and sclerosing polycystic adenosis to non-neoplastic epithelial lesions[41].

SALIVARY GLAND BTS
Pleomorphic adenoma (benign mixed tumor)
MEC refers to the most common salivary gland malignancy and 60% of these lesions involve the parotid gland. MEC develops in epithelium tissue of salivary gland ducts. It is made of mucus secreting cells, epidermoid cells and intermediate cells[46]. They may have low, intermediate or high-grade subtypes with different radiological appearances. Low grade tumors have smooth borders and cystic components containing mucin, and have hyperintense signals on T1WI and T2WI. High-grade tumors, on the other hand, are quite solid with undefined borders due to extension into neighboring structures. They often appear on T2WI as hypointense or isointense lesions due to their high cellularity[33]. ADC values of MECs on DWI is low in poorly differentiated lesions. ADC
values of MECs on DWI studies were reported to vary from [(0.81 ± 0.06)-(1.05 ± 0.03)] × 10
mm
/s [range (0.65-1.14) × 10
mm
/s][13,19,20,69]. Zheng
[52] reported Tpeak value of 120 s or lower for MECs on DCE MRI. WR of a case was reported to be less than 30% while that of another was 30% or over.
Regarding Tpeak values of PMAs on DCE MRI, Tsushima
[23] observed Tpeak was equal to or greater than 260 s while Sumi and Nakamura[26] found Tpeak values of 120 s or longer in 92.9% of the cases and less than 120 s in 7.1% of them. Similarly, Zheng
[52] measured 120 s or over in 88.9% of the cases and less than 120 s in 11.1%. Tao
[14], on the other hand, found 58 s or longer Tpeak values in 82.0% of the cases whereas in 18% it was less than 58 s. For WR values of PMAs, Tsushima
[23] reported no wash-out while Zheng
[52] reported no wash-out in 88.9% of the patients and less than 30% WR in 11.1% of the cases. The literature contains a few studies on quantitative DCE perfusion MRI parameters (Ktrans, Kep and Ve) in SGTs. In these studies, mean Ktrans value of PMAs was 0.101 ± 0.069 to 0.217 ± 0.036; mean Kep values 0.245 ± 0.160 to 0.567 ± 0.048; mean and values were determined as 0.380 ± 0.192 to 0.590 ± 0.478[3,7,30].
She was shuffling29 through the stacks of expensive stockings, sheer colors shining through slick cellophane windows: taupe, navy, a maroon30 as dark as pig s blood. The sleeve of her green coat brushed his and he smelled her perfume, something delicate and yet pervasive31, something like the dense pale petals32 of lilacs outside the window of the student rooms he d once occupied in Pittsburgh. The squat33 windows of his basement apartment were always grimy, opaque34 with steel-factory soot35 and ash, but in the spring there were lilacs blooming, sprays of white and lavender pressing against the glass, their scent36 drifting in like light.
WT
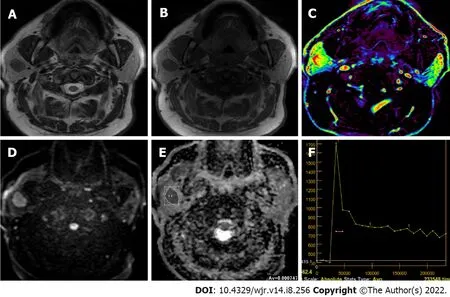
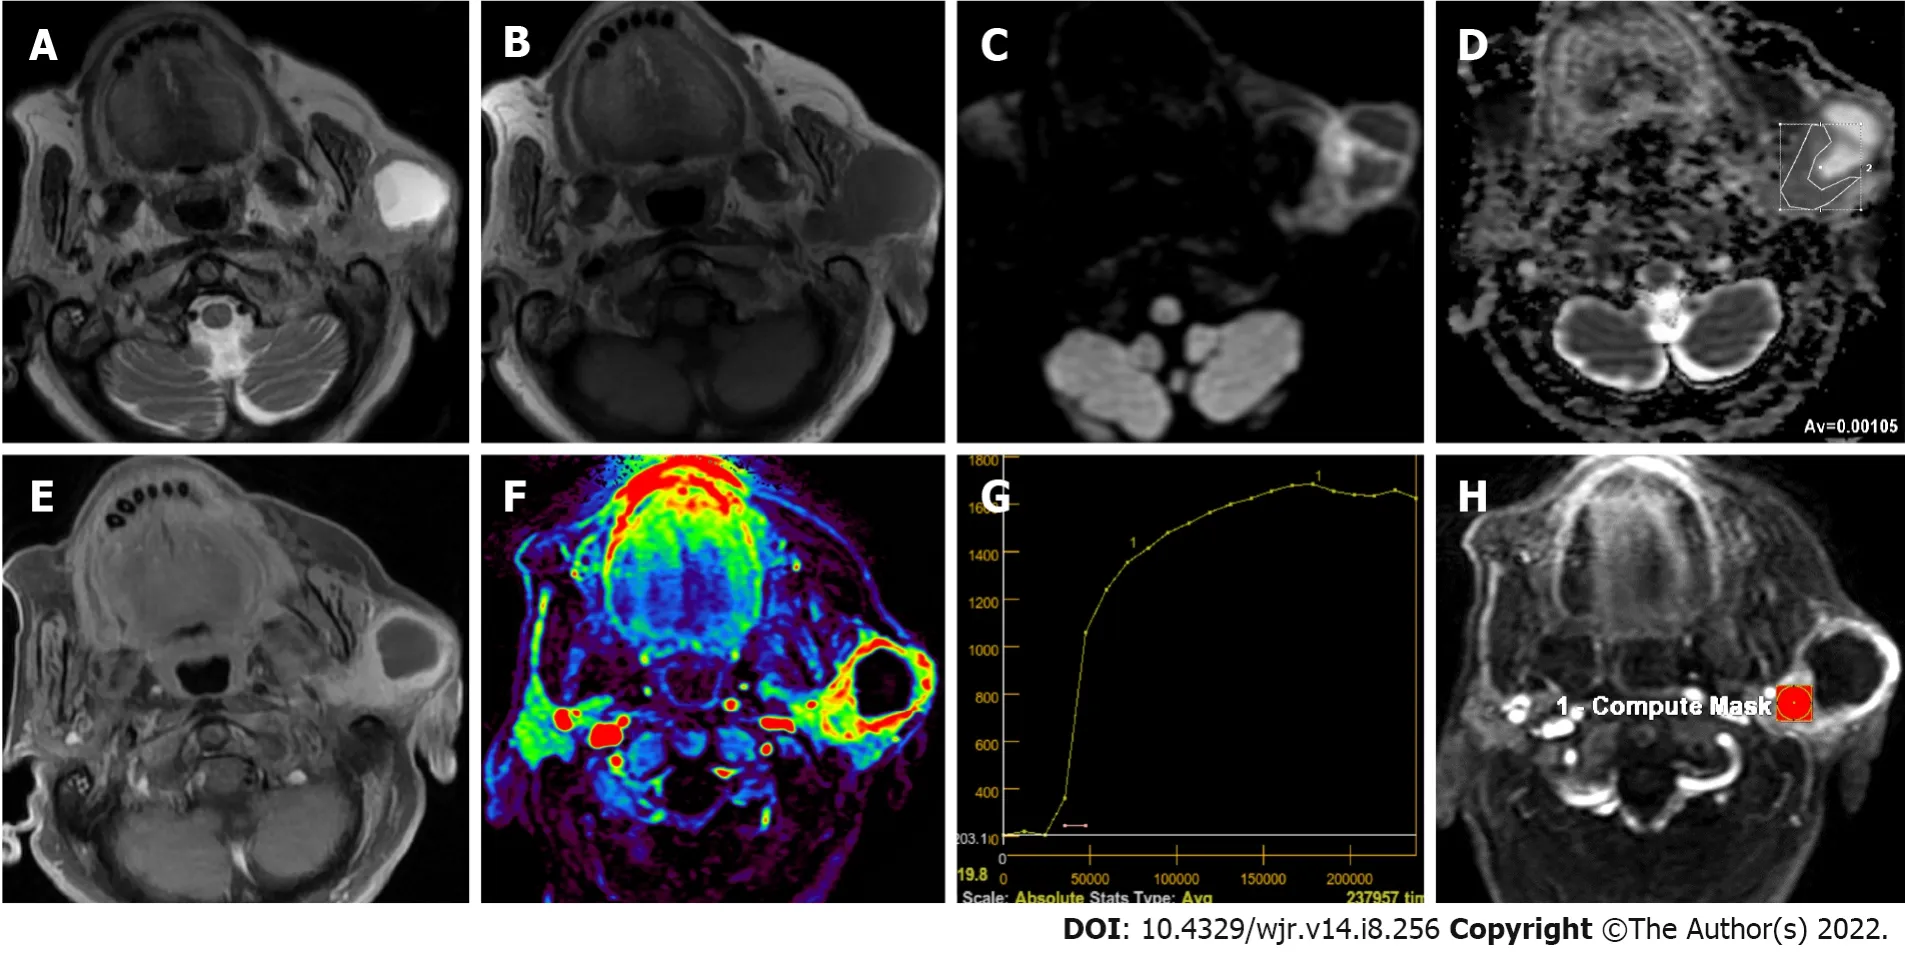
WT is the second most commonly observed benign SGT[43,48]. It is mostly observed in middle-age or older men in the parotid gland or periparotid region and more commonly in the inferior pole of the parotid gland[56,57]. Smoking, autoimmune disease and radiation exposure were reported to increase WT risk[43,48,56]. About 20% of WTs tend to be bilateral and multicentric[43,56]. They generally have a spherical to ovoid shape of 2-4 cm diameter, and their surface is smooth. WT is basically an adenoma with mucoid or brown fluid filled cysts of variable number. The cysts are made of two layered papillary proliferations of oncocytic epithelium and supporting stroma made of an abundant follicle carrying lymphoid tissue. They may have focal hemorrhage and necrosis[57]. Transformation of WTs to malignancy is extremely rare (0.3%)[43,56]. Intermediate or hypointense areas on short tau inversion recovery and T2WI, and hyperintense area on T1WI on MRI suggest WTs[48,57,58]. Solid WT components result in iso-intensity or hypo-intensity on T2WI because histopathologically WT is made of epithelial cells and lymphoid stroma with fibrovascular tissue[56]. About 30%-60% of WTs are partly or predominantly cystic[50,56,58]. WTs may resemble other less frequently observed benign lesions such as myoepitheliomas and basal cell adenomas (BCAs) which may also carry cystic components and tend to involve superficial lobe of parotid gland[48,59,60]. WTs were reported to have low ADC values (Figure 2) due to their epithelial and lymphoid stroma contents which have microscopic slit-like cysts containing proteinous fluid[56,57]. In different studies, ADC values of WTs ranged from (0.69-1.36) × 10
mm
/s and ADC
was about (0.74-1.02) × 10
mm
/s[19,52,53,56,57]. Only two studies in the literature reported ADC
values higher than 1.0 × 10
mm
/s, while others had lower values. A study reported that mean D
and mean K
values of WTs on DKI were (0.808 ± 0.227) × 10
mm
/s and 0.999 ± 0.228, respectively[37]. Huang
[30] reported the mean
value of WTs as 0.97 × 10
mm
/s and the mean
value as 0.99 on DKI.
MASC was first described in 2010 as a rare salivary carcinoma mimicking acinar cell carcinoma and was released to the World Health Organization classification of head and neck tumors in 2017[71,72]. MASC has morphological and genetic similarities with secretory carcinoma of the breast. The majority of MASCs (approximately 70%-80%) are located in the parotid gland, while a smaller number are located in other minor salivary gland areas or major salivary gland glands[72,73]. MASCs are often tumors of “papillary and cystic” or “non-papillary and cystic” morphology. The cystic and solid components of these tumors have high signal on T1WIs on MRI, more often in the cystic component. On contrastenhanced MRI series, solid components may show different forms of enhancement (homogeneous, heterogeneous, or scarce)[72]. DWI has been applied in a limited number of cases in MASCs, and ADC values in the solid components of the tumor vary between (0.5-1.7) × 10
mm
/s[70,72].
In terms of Tpeak values of WT in studies on the literature dealing with DCE MRI, Tsushima
[23] reported < 20 s, Hisatomi
[61] in the range of 30-45 s, Sumi and Nakamura[26] < 120 s, while Tao
[14] found that in 97.6% of the cases Tpeak was less than 58 s and in 2.4% of the cases Tpeak was equal to or greater than 58 s. For WR values of WTs, Hisatomi
[61] mentioned that WR was prominent in the first 30 s after Tmax. On the other hand, Sumi and Nakamura[26] found that WR ranged from 30%-70%, while Zheng
[52] found WR values equal to or larger than 30%. Tao
[14] found that WR values were 22.6% or over in 85.4% of the cases, less than 22.6% in 12.2% and no wash-out was observed in 2.4% of the cases. In the literature, quantitative DCE perfusion MRI values in WTs mean Ktrans values 0.105 ± 0.064 to 0.464 ± 0.036; mean Kep values 0.729 ± 0.112 to 2.299 ± 1.312; mean Ve values are reported in the range of 0.1439 ± 0.093 to 0.272 ± 0.013[29-31].
Oncocytoma
Oncocytomas are well bordered, benign epithelial neoplasms of homogeneous solid structure consisting of mitochondria-rich oncocytes[48,60]. They constitute about 1% of parotid tumors, but about 80% of them are observed in the parotid gland[48,56,60]. They are commonly observed in people in their 60 s and 80 s, and are slightly more common in women. Because they have high cellularity and low free water content, conventional MRI findings of oncocytomas resemble those of WTs[62]. In addition, with their lower ADC content, fast enhancement and wash-out on dynamic MRI, findings of DWI and DCE MRI could overlap. However, oncocytomas usually have higher ADC values than WTs[56]. Oncocytomas were reported to have ADC values ranging from (0.8-1.16) ×10
mm
/s[56,63]. Hisatomi
[61] found that oncocytomas have similar contrasting dynamics to WT, and consequently, they cannot be differentiated from WTs using DCE MRI alone.
BCA
BCAs are made of basaloid cells carrying eosinophilic cytoplasm, and they have no clear cell borders. Their nuclei are round-to-oval. They have solid, trabecular, tubular and membranous distribution patterns. Although most tumors carry one of these patterns predominantly, some of them may have more than one pattern. Membranous BCAs have different biological characteristics from other BCA variants because they carry microfocal adenomas, incomplete capsules or no capsule. Besides, they may recur after operation and they have malignant transformation characteristics. Their frequency is higher after 50 years of age, and women have a slightly higher prevalence[51]. BCAs most frequently arise from the parotid gland and are more frequently located in the superficial lobe[31,51]. They tend to have clearly defined borders[3,31,51]. BCAs may have cystic or hemorrhagic components[51]. In MRI of BCAs, signal intensities on T1WIs are relatively low while on T2WIs intensity varies between hypointense to slightly intense. In studies in the literature, mean ADC values of BCAs were found to be [(1.21 ± 0.20)-(1.24 ± 0.18)] × 10
mm
/s[31,51]. On dynamic MRI, on the other hand, they feature rapid and prolonged enhancement[51]. Mukai
[51] found that on DCE MRI, 12 of 14 BCAs (85.7%) had TIC patterns of either Tpeak > 120 s or Tpeak < 120 s and wash-out < 30%. Yabuuchi
[31] reported Tpeak < 120 s and wash-out < 30% in 61.5% of BCAs in DCE MRI, and Tpeak > 120 s and no wash-out in 15.3% of them.
Myoepithelioma
Myoepitheliomas are responsible only for about 1%-1.5% of all salivary neoplasms. Their primary location is parotid gland (about 40%) but they may also appear on other salivary gland parts (about 21%)[59,64]. Differentiated myoepithelial cells in the form of spindle, plasmacytoid, epithelioid, or clear cells constitute most of myoepithelioma[59]. Myoepithelial cells were proposed to have contractile units helping to excrete glandular secretions. Myoepitheliomas need to be differentiated from parotid cyst, abscess, mucocele, schwannoma, leiomyoma, neurofibroma, rhabdomyosarcoma, smooth muscle neoplasms, extramedullary plasmacytoma, benign fibrous histiocytoma, PMA, mucoepidermoid carcinoma (MEC) and myoepithelial carcinoma[64]. They feature homogeneous isointense signal based on muscle tissue on T1WI and homogeneous iso-hyperintense signals on T2WI. In the majority of them (about 80%), hypointense capsule formation and homogeneous contrasting could be observed on T2WI and contrast-enhanced series[59]. ADC
values of myoepithelioma in different studies varied from 1.31 ± 0.9 to 1.86 ± 0.18 (range 1.18-1.91) × 10
mm
/s[19].
Schwannoma and neurofibroma
Intraparotid neurofibromas or schwannomas could be associated with neurofibromatosis, but they may also arise sporadically[48]. Frequency of parotid tumors which originate in the facial nerve was estimated to be between 0.2%-1.55%[65]. A fusiform tumor appearance extending into intratemporal facial nerve canal could be a distinguishing feature in diagnosis. However, this appearance also resembles perineural extension of malignant neoplasms. Peripheral nerve sheath tumors could easily be distinguished by their target and fascicular signs on MRI[48]. The target sign refers to the appearance of central T2 hypointensity and enhancement and peripheral T2 hyperintensity and non-enhancement[48,65]. The fascicular sign corresponds to multiple ring-like T2 hypointense foci within a relatively T2 hyperintense and enhancing background[48]. On DWI, neurofibromas were reported to have ADC
values in the range of (1.41-1.91) × 10-3 mm
/s[13,17].
Lipoma or sialolipoma
Lipomas are neoplasms consisting of mature adipose tissue. For salivary gland involvement, they may be intraglandular or extraglandular[48]. Lipomas have similar signal intensities to subcutaneous adipose tissue on T1WI and T2WI[66]. Fat-suppression is useful on MRI of salivary gland lipomas. These tumors may have septations when they surround vessels[48]. Some rare variants of lipomas with a biphasic pattern where serous tissue is diffusely scattered among fat is termed sialolipoma and their appearance closely resemble normal parotid tissue[48,67]. They are encapsulated but tend to be heterogeneous in appearance due to their soft salivary gland tissue and fat tissue[48]. DWI studies showed that lipomas had ADC
values of (0.09-0.62) ± 0.21 [range (0.08-0.76) × 10
mm
/s] [19].
Hemangioma
Hemangiomas refer to vascular abnormalities involving increased proliferation and endothelial cell renewal. They are more common in childhood. About 60%-65% of hemangiomas are observed in the head and neck area, and 81%-85% of them are found in the parotid gland. Hemangiomas constitute 0.4%-0.6% of all tumors in the parotid gland and the ADC value of the hemangioma was found to be 0.8 × 10
mm
/s[68]. On MRI, they have homogeneously hyperintense appearance on T2WI and strong enhancement, but they are devoid of prominent flow. These tumors often affect the whole gland and could have additional lesions elsewhere in the head and neck or in other regions[48,68].
However, the good Fairy of the Beech-Woods did not want her to be starved, so she sent her an unlooked for relief in the shape of a beautiful white cow, which followed her back to the tiny house
SALIVARY GLAND MTS
MEC
Pleomorphic adenoma is the most frequently observed SGT. Great majority of them are located in the parotid gland, and about 80%-90% is found on the surface of the gland[42-44]. PMAs are slowly growing, painless masses observed in 30-60 years of age and more frequently in women (ratio 2:1)[43,44]. Multicentricity of PMAs is less than 1%[43]. At cellular level, morphological diversity characterized by a mixture of both epithelial and mesenchymal components is a characteristic feature of PMAs[44,45]. Ratio of these components varies greatly in PMAs, and MRI features vary based on the distribution of these components[44,46]. Stromal components in PMAs could be myxomatous, chondromatous, lipomatous, hyalinized, fibrous, calcified, or osseous, myxoid stroma being the most frequent (94.2%)[44,45]. Tsushima
[47] mentioned that high intensity signals on T2WI represented myxoid histology. Classical appearance on T2WI of MRI is generally well bordered, microlobule contoured masses with prominently high signal confined by hypointense fibrous capsule[10,44,46-48]. Zaghi
[49] evaluated the diagnostic efficiency of conventional MRI in differentiating PMAs using five different criteria. They found that masses with bright T2 signal, sharp borders, heterogeneous nodular enhancement, lobulated contours and a T2 dark rim were predictive of PMAs with a sensitivity of 43.9% and a specificity of 95%. Cellular variants of PMAs featured intermediate SI on T2WI due to their epithelial components, while the ones with fibrous stroma were hypointense. PMAs with hypointense signals on T2WI could represent malignity, but the presence of complete capsule and lobulated contour are good indications of PMAs[44]. Cystic degeneration was observed in 29%-40% of parotid gland PMAs[50]. Due to their heterogeneous composition of epithelial, myoepithelial and stromal cells with fluid areas within epithelial glandular regions, PMAs have unrestricted diffusion and high ADC values. ADC values of PMAs were reported to vary between (0.66-2.86) × 10
mm
/s[19-21,51], while ADC
values varied from (1.35-2.15) × 10
mm
/s[19,20,51-53]. Cellular variants of PMAs could have lower ADC values in the range of (1.0-1.3) × 10
mm
/s[44,54]. Average Dapp value of (1.525 ± 0.396) × 10
mm
/s and average Kapp value of 0.394 ± 0.172 were reported for PMAs on DKI[37]. Huang
[30] reported the mean
value as 1.81 × 10
mm
/s and the
value as 0.51 on DKI. Zheng
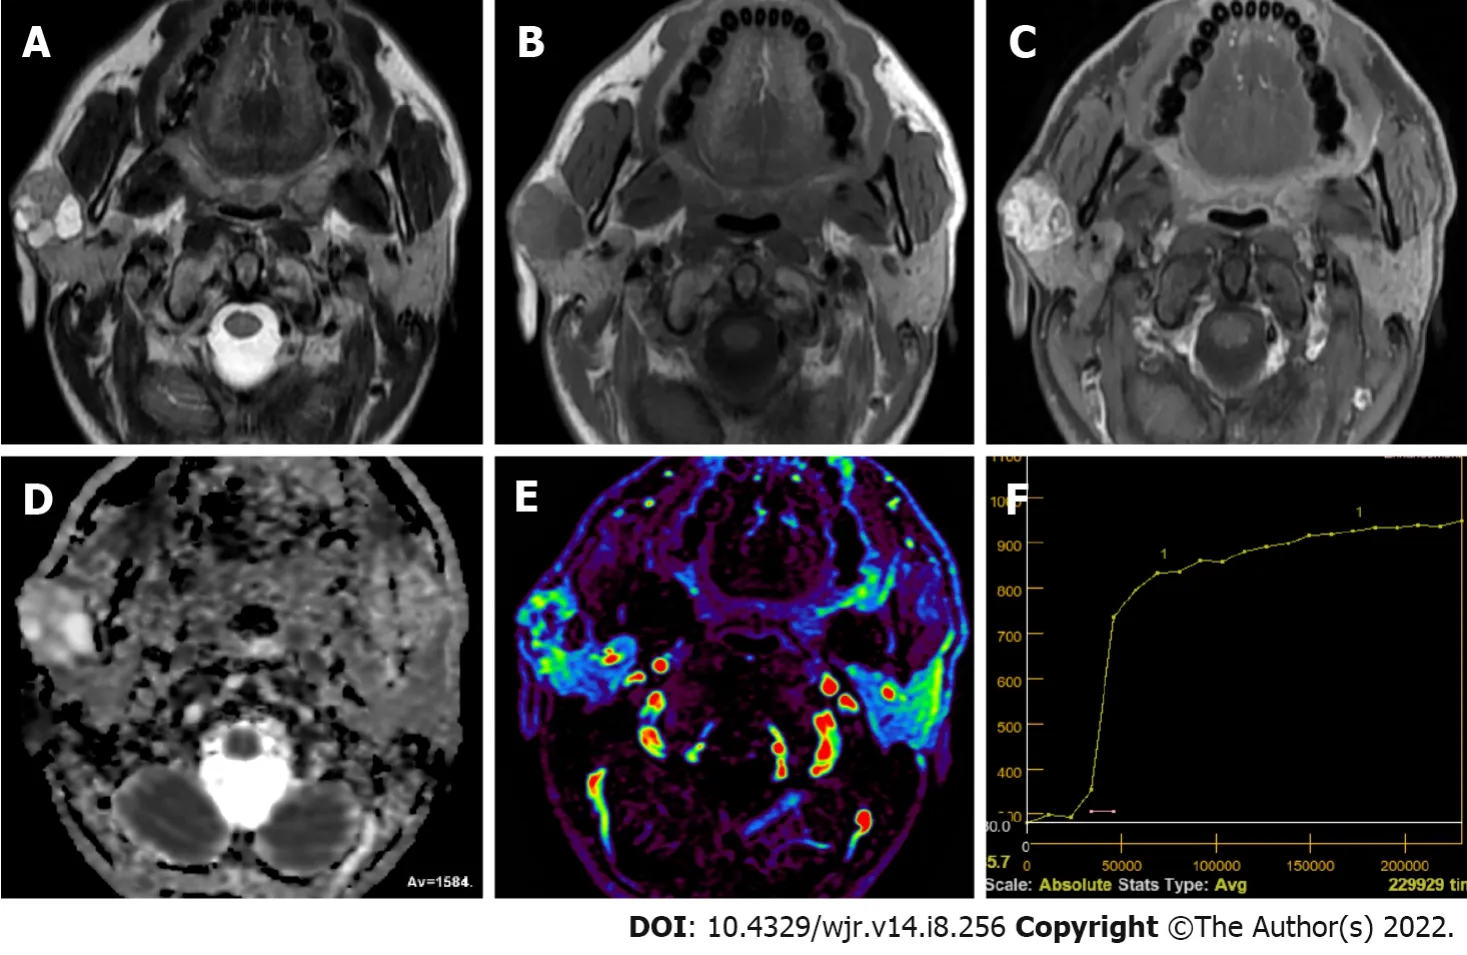
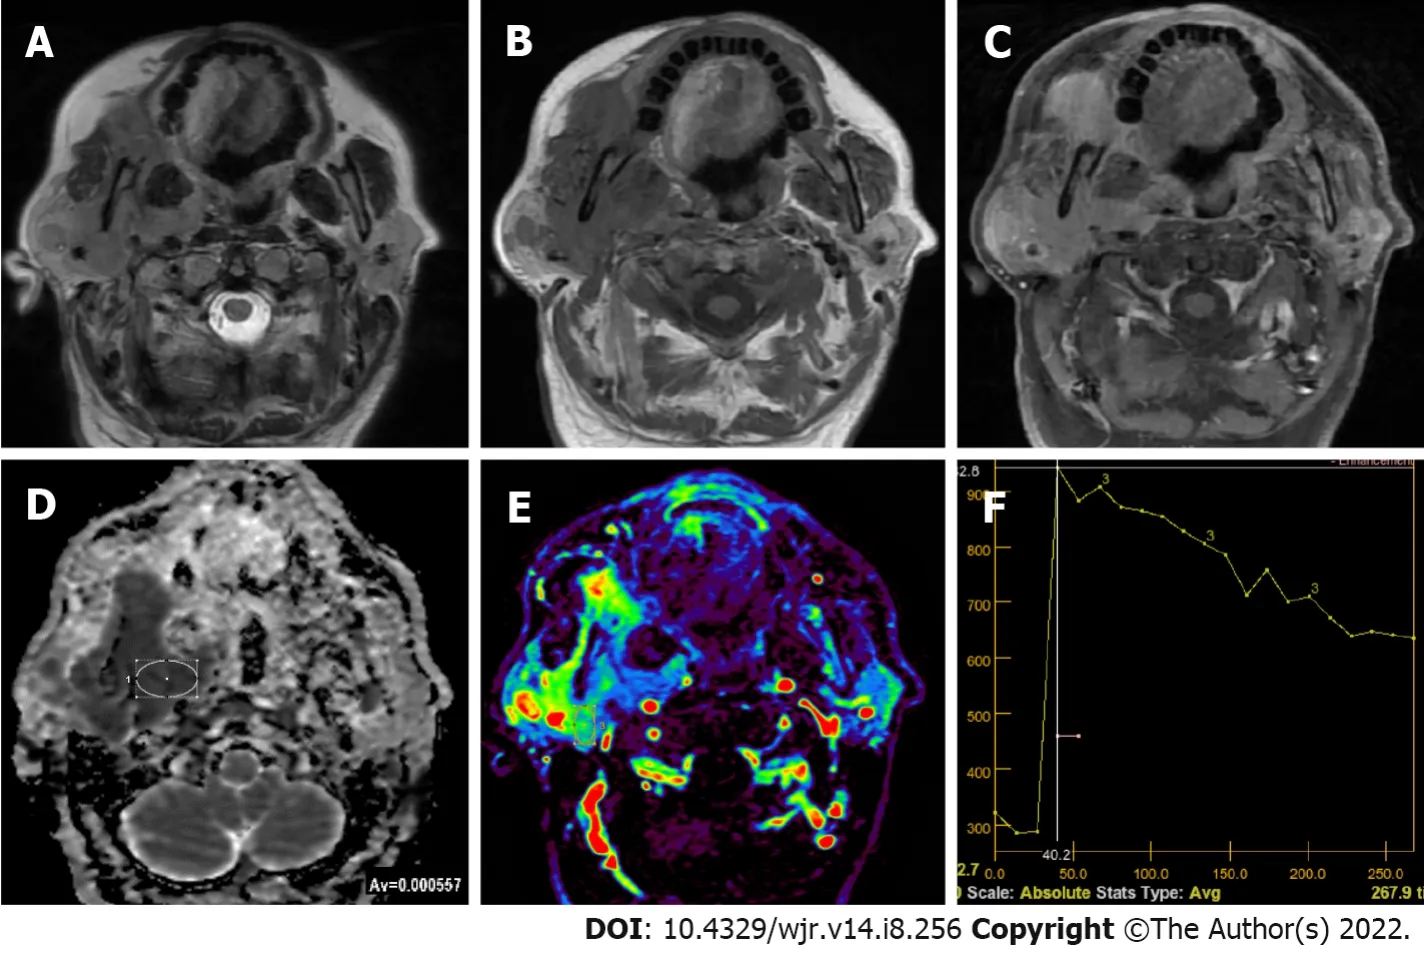
[52] reported that a great majority of PMAs featured type A TIC pattern (persistent and Tpeak > 120 s) because of unbroken capillary endothelial cells and more complex nature of stroma in tumor (Figure 1). They also mentioned slow flow of contrast medium into extracellular space. However, cellular variants of PMAs showed atypical gradual wash-out pattern on DCE MR due to their high epithelium content and low myxoid stroma[52]. Frequency of this atypical pattern in all PMA TIC patterns was reported to be about 17%-18%[24,44,55].
Adenoid cystic carcinoma
Adenoid cystic carcinoma (ACCa) is made of ductal epithelial and myoepithelial cells. It may be in solid, cribriform or tubular forms, cribriform being most common. It is more frequent in middle-aged or elderly patients. Perineural spreading and invasion capacity of ACCa is very high[46]. They can result in distant metastases and local invasions. ACCa is frequently observed as ill-defined masses with perineural spreading in imaging. ACCa has intermediate to low signal on T1WI and T2WI MRI. The parotid gland is the most common location for ACCa (about 25%), which often involves perineurium of cranial nerve VII during the diagnosis[46]. On DWI studies, ACCas were found to have ADC
values varying from [(0.84 ± 0.07)-(1.46 ± 0.03)] × 10
mm
/s[9,13,17,19,69]. Tsushima
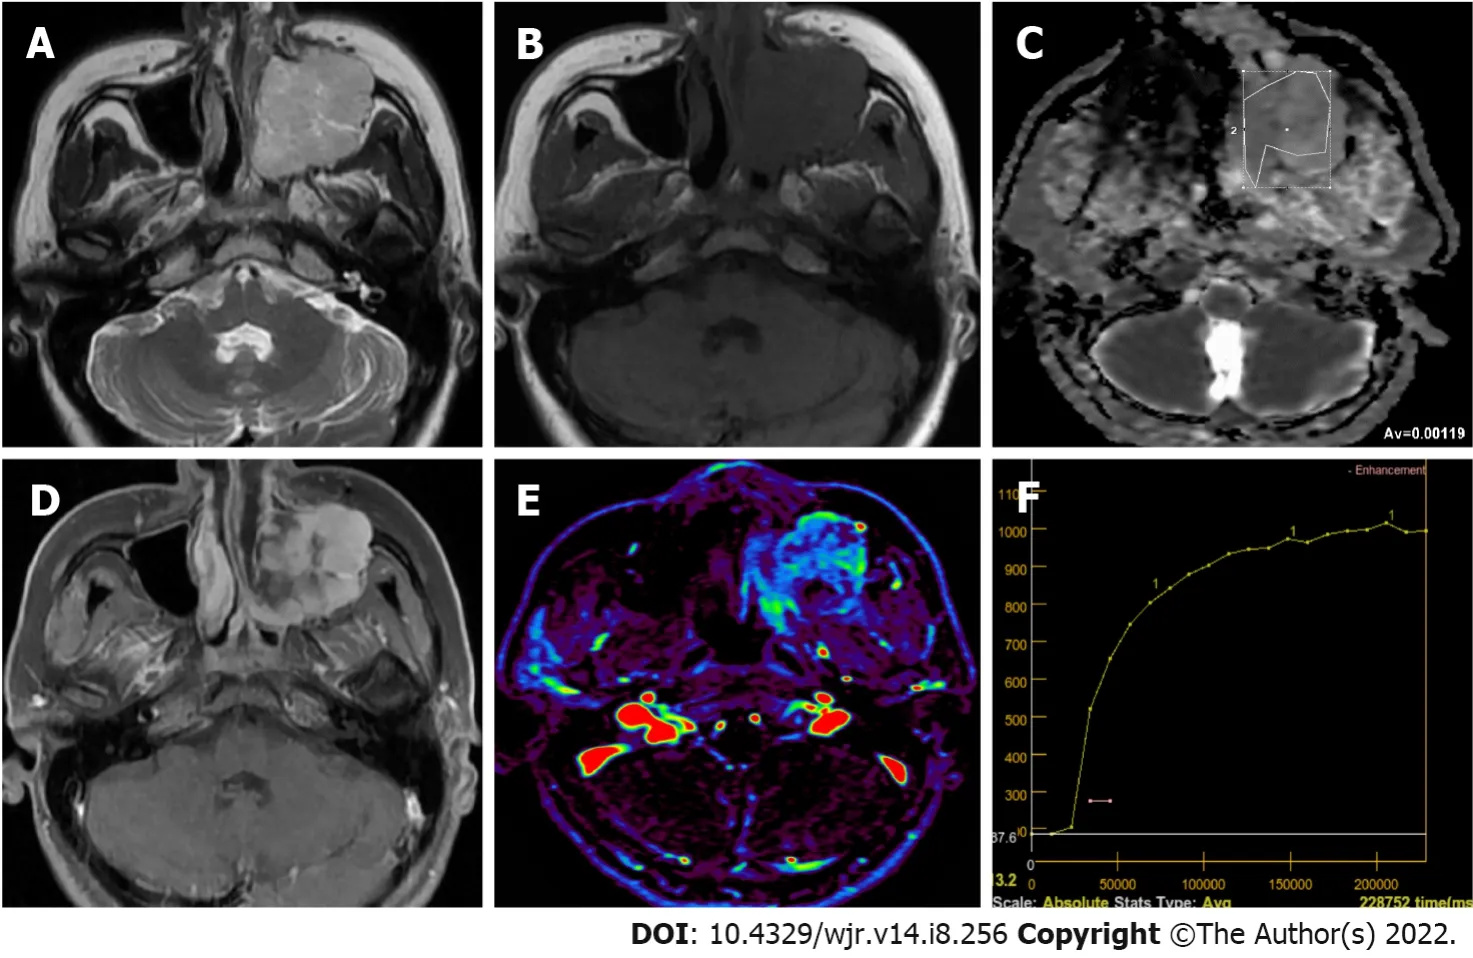
[23] detected PMAlike TIC pattern (Figure 3) in two ACCa cases using DCE MR (Tpeak > 260 s and no wash-out). It was suggested that this pattern could be due to increased interstitial space of ACCa which contains extracellular mucin and low microvessel count[3,23]. Zheng
[52] reported that one ACCa they studied had the TIC pattern most commonly observed in MTs (type C, T
≤ 120 s and WR < 30%).
Acinic cell carcinoma
Acinic cell carcinoma is a low-grade malignant lesion, and about 90% of these lesions are located in the parotid gland[46]. Its characteristic feature is serous acinar differentiation and basophilic granules in cytoplasm[8]. No specific finding is observed in imaging, but most acinic cell carcinomas are homogeneously enhanced, well-bordered, slowly growing masses like other benign or low grade malignant lesions[33,46]. Most of the malignancies which were previously considered acinic cell carcinomas are now identified as MASCs[46]. Kashiwagi
[70] revealed that acinic cell carcinomas tended to be solid while MASCs were predominantly cystic masses with solid papillary extensions. The authors mentioned that intermediate-high SI of acinic cell carcinomas on T1WI could help in differential diagnosis. DWI studies in the literature showed ADC
values from [(0.79 ± 0.33)-(1.76 ± 0.11)] × 10
mm
/s for acinic cell carcinomas[69,70]. Zheng
[52] studied three acinic cell carcinoma cases on DCE MRI and observed a Tpeak value of 120 s or less. WR was over 30% in two cases and equal to or larger than 30% in the other.
MASC
In the short time we had to chat, we found out that Miles and his mom were returning to their home in Kansas City. They had spent the last two weeks at the Ronald McDonald House at Long Island Jewish Hospital. Miles is a surviving twin (his brother died at birth) and has had serious health problems with internal organs. In spite of his thirty-one major surgical3 procedures, his long-term prognosis was still in doubt. He would be back through LaGuardia many more times.
Carcinoma ex pleomorphic adenoma
This she was all the more inclined to do as she loved children, and little Prince Featherhead, who never cried and grew prettier day by day, quite won her heart
Lymphoma
Primary lymphoma of salivary glands is rare and in 75%-80% of the cases parotid gland is involved. Most commonly encountered Non-Hodgkin lymphoma types of salivary glands are extranodal marginal zone B-cell lymphoma in mucosa-associated lymphoid tissue (MALT), follicular B-cell lymphoma and diffuse large B-cell lymphoma. Follicular type and MALT lymphomas are low-grade lesions characterized by slow growth, which sometimes regress spontaneously. In cases with autoimmune conditions such as Sjogren’s syndrome MALT lymphoma risk is 44 times higher. Parotid MALT lymphomas are mostly solid-cystic lesions which may have a solitary or diffused pattern. In non-MALT lymphomas, on the other hand, multiple or solitary homogeneous internal structure is more common. A diffuse large B-cell lymphoma is the most common high-grade lymphoma involving the parotid gland. Some of them arise from an underlying low-grade lesion. They manifest themselves with an asymptomatic mass in the parotid gland which grows in a period of four to six months[75]. The ADC values of lymphomas on DWI were generally lower than other solitary tumors (Figure 4), which helps in their differential diagnosis. DWI studies found ADC
values from 0.55 to 0.98 [range (0.4-1.21) × 10
mm
/s] for parotid gland lymphomas[15,20,21,58,76].
Petey sat and looked out over the gully. Dad would marry that girl. Yes, that girl who had kissed Petey and fussed over him, saying she d try to be a good mother to him, and all. . . .
It has been known that malignant lymphomas have higher cellularity and less extracellular space than head and neck carcinomas[27,76]. Therefore, malignant lymphomas show rapid enhancing and wash-out TIC patterns[19,26,28]. Since TIC patterns of malignant lymphomas and WTs are similar, differentiation of WTs and malignant lymphomas cannot be done using DCE MRI alone[27]. However, Tpeak of lymphomas are somewhat longer and their WR is lower compared to WTs. In their study dealing with head and neck lymphomas, Asaumi
[77] measured average maximum duration for lymphomas to reach contrast index as 78.5 ± 29.1 s. Tao
[14], on the other hand, found that in all of seven lymphomas they studied Tpeak was less than 58 s while WR was less than 22.6% in six of them (85.7%) but equal to or greater than 22.6% in one (14.3%). Wang
[76] evaluated 20 MALToma cases and reported that parotid MALTomas were usually (94.1% of the patients) in early ascending type (
type I, with a Tpeak of less than 79.65 s and an initial slope of increase less than 0.807). They mentioned that Tpeak values could be used to distinguish between parotid tumor-like benign lymphoepithelial lesion (BLEL) and MALToma because Tpeak value was at least twice higher in tumor-like BLEL cases compared to MALToma cases[76].
Salivary duct carcinoma
Salivary duct carcinoma (SDC) refers to tumors of different sizes characterized by duct structures which contain eosinophilic tumor cells. They often have a cribriform structure. SDC constitutes the most commonly encountered malignant component of carcinoma ex pleomorphic adenoma. Majority of SDCs originate from PMAs[78]. On DWI studies, ADC
values of SDCs were reported to vary from (0.88-1.28) ± 0.16 [range (0.87-1.47) × 10
mm
/s][26,27,30,31,79]. Motoori
[79] reported that on DCE MRI 78% of SDCs appeared as type B (Tpeak < 120 s and WR < 30%), and 67% of had areas of type C TIC pattern (Tpeak > 120 s) due to their abundant fibrotic tissue.
Epithelial-myoepithelial carcinoma
Epithelial-myoepithelial carcinoma (EMC) is a rare subtype of malignant salivary gland tumor. Histopathologically, it consists of a biphasic array of inner lumen ductal cells and outer myoepithelial cells. On conventional MRI, EMCs are well-contoured, may contain mostly solid or cystic components, septa or multi-nodularity can be detected, solid components are isointense or hypointense on T1WIs, hyperintense or isointense on T2WIs, contrast-enhancement with different forms (homogeneous or heterogeneous; moderate, mild or none) can be seen as masses. On DWI studies, ADCmean values of EMCs were reported to vary from (0.96-1.05) ± 0.03 [range (0.789-1.14) × 10
mm
/s][80].
Secondary malignancies of the salivary glands (metastases)
Secondary malignancies of the salivary glands may develop either by distant metastasis or by direct infiltration of tumors from adjacent tissues. Secondary malignancies of the salivary glands may involve the parenchyma of the salivary glands or the intraglandular and/or periglandular lymph nodes. Secondary malignancies most commonly involve the parotid gland, followed by the submandibular gland. Metastases in other salivary glands are less common. Metastases to the salivary glands most commonly arise from squamous cell carcinomas of the head and neck region and the upper aerodigestive tract[81,82] (Figure 5). Various hematopoietic and lymphoid malignancies, including lymphomas, but not as much as squamous cell carcinomas, constitute a significant portion of secondary malignancies of the salivary glands[81]. Metastases may originate less frequently from distant organs such as malignant melanoma, breast, lung, kidney, thyroid, pancreatobiliary, prostate, and bladder[81,82].
Cystic lesions of parotid gland and its tumors which may have cystic component
Parotid gland could have pure cystic benign lesions such as lymphoepithelial cysts, lymphangiomas, dermoid cysts, first branchial cleft cysts and mucocele, but they could be BTs and MTs which contain cystic components of different size[50]. Kato
[50] found cystic components of different size scattered over different areas which might have different T1 and T2 signal characteristics in 40% of PMAs, 60% of WTs, 67% of BCAs, 86% of SDCs, 80% of MECs, 75% of epithelial myoepithelial cell carcinomas, 50% of acinic cell carcinomas, 100% of carcinoma ex PMA, 100% of adenocarcinomas and 100% of ACCs. In order to avoid erroneous ADC measurements in tumors with cystic or necrotic components using DWI and in measurements to determine TIC pattern in DCI, region of interest should be placed in solid sections of the lesions[24,62,83].
CONCLUSION
In addition to the morphological data of conventional MRI, advanced MRI techniques allow us to obtain information about the cellularity, microstructural features or vascularity of tumors and thus to interpret the nature and subtypes of tumors. For example, while high cellular tumors such as WTs or lymphomas show low ADC values on diffusion MRI, they cause rapid contrast enhancement and significant washout on dynamic contrast MRI series. Except for their cellular variants, PMAs show high ADC values and an increasing TIC pattern on dynamic MR series. High cellular MTs show diffusion restrictions and WRs not as much as WTs or lymphomas. Quantitative perfusion MRI values (such as Ktrans, Kep, Ve) can be measured in accordance with the structural features of the tumors. With the increase in data and studies on the nature and subtypes of SGTs in the literature, threshold values or acceptance intervals for quantitative measurements have begun to emerge, although there are overlaps.
FOOTNOTES
G?k?e E designed the study; Beyhan M supervised the study. G?k?e E and Beyhan M participated in literature research and manuscript preparation, and read and approved the final version.
All the authors report no relevant conflicts of interest for this article.
This article is an open-access article that was selected by an in-house editor and fully peer-reviewed by external reviewers. It is distributed in accordance with the Creative Commons Attribution NonCommercial (CC BYNC 4.0) license, which permits others to distribute, remix, adapt, build upon this work non-commercially, and license their derivative works on different terms, provided the original work is properly cited and the use is noncommercial. See: https://creativecommons.org/Licenses/by-nc/4.0/
Turkey
Erkan G?k?e 0000-0003-3947-2972; Murat Beyhan 0000-0002-8630-4632.
She had to stoop in order to go in at the low door. Where are the servants? said the King s daughter. What servants? 21 answered the beggar-man; you must yourself do what you wish to have done. Just make a fire at once, and set on water to cook my supper, I am quite tired. But the King s daughter knew nothing about lighting15 fires or cooking,22 and the beggar-man had to lend a hand himself to get anything fairly done. When they had finished their scanty16 meal they went to bed; but he forced her to get up quite early in the morning in order to look after the house.
Wang JJ
A
Wang JJ
1 Gao M, Hao Y, Huang MX, Ma DQ, Chen Y, Luo HY, Gao Y, Cao ZQ, Peng X, Yu GY. Salivary gland tumours in a northern Chinese population: a 50-year retrospective study of 7190 cases.
2017; 46: 343-349 [PMID: 27769738 DOI: 10.1016/j.ijom.2016.09.021]
2 Del Signore AG, Megwalu UC. The rising incidence of major salivary gland cancer in the United States.
2017; 96: E13-E16 [PMID: 28346649 DOI: 10.1177/014556131709600319]
3 Abdel Razek AAK, Mukherji SK. State-of-the-Art Imaging of Salivary Gland Tumors.
2018; 28: 303-317 [PMID: 29622121 DOI: 10.1016/j.nic.2018.01.009]
4 Carlson ER. Management of Parotid Tumors.
2017; 75: 247-248 [PMID: 28328430 DOI: 10.1016/j.joms.2016.12.001]
5 Kuan EC, Mallen-St Clair J, St John MA. Evaluation of Parotid Lesions.
2016; 49: 313-325 [PMID: 26902978 DOI: 10.1016/j.otc.2015.10.004]
6 Eveson JW, Cawson RA. Salivary gland tumours. A review of 2410 cases with particular reference to histological types, site, age and sex distribution.
1985; 146: 51-58 [PMID: 4009321 DOI: 10.1002/path.1711460106]
7 Mansour N, Hofauer B, Knopf A. Ultrasound Elastography in Diffuse and Focal Parotid Gland Lesions.
2017; 79: 54-64 [PMID: 28231589 DOI: 10.1159/000455727]
8 Munhoz L, Abdala Júnior R, Abdala R, Arita ES. Diffusion-weighted magnetic resonance imaging of the paranasal sinuses: A systematic review.
2018; 126: 521-536 [PMID: 30143461 DOI: 10.1016/j.oooo.2018.07.004]
9 Inci E, Hocaoglu E, Kilickesmez O, Aydin S, Cimilli T. Quantitative Diffusion-Weighted MR Imaging in the Differential Diagnosis of Parotid Gland Tumors: Is it a Useful Technique?
2010; 30: 1339-1345 [DOI: 10.5336/medsci.2009-14994]
10 Lechner Goyault J, Riehm S, Neuville A, Gentine A, Veillon F. Interest of diffusion-weighted and gadolinium-enhanced dynamic MR sequences for the diagnosis of parotid gland tumors.
2011; 38: 77-89 [PMID: 20542568 DOI: 10.1016/j.neurad.2009.10.005]
11 Celebi I, Mahmutoglu AS, Ucgul A, Ulusay SM, Basak T, Basak M. Quantitative diffusion-weighted magnetic resonance imaging in the evaluation of parotid gland masses: a study with histopathological correlation.
2013; 37: 232-238 [PMID: 23465973 DOI: 10.1016/j.clinimag.2012.04.025]
12 Milad P, Elbegiermy M, Shokry T, Mahmoud H, Kamal I, Taha MS, Keriakos N. The added value of pretreatment DW MRI in characterization of salivary glands pathologies.
2017; 38: 13-20 [PMID: 27806890 DOI: 10.1016/j.amjoto.2016.09.002]
13 Abdel Razek AA, Samir S, Ashmalla GA. Characterization of Parotid Tumors With Dynamic Susceptibility Contrast Perfusion-Weighted Magnetic Resonance Imaging and Diffusion-Weighted MR Imaging.
2017; 41: 131-136 [PMID: 27636248 DOI: 10.1097/RCT.0000000000000486]
14 Tao X, Yang G, Wang P, Wu Y, Zhu W, Shi H, Gong X, Gao W, Yu Q. The value of combining conventional, diffusionweighted and dynamic contrast-enhanced MR imaging for the diagnosis of parotid gland tumours.
2017; 46: 20160434 [PMID: 28299943 DOI: 10.1259/dmfr.20160434]
15 Elmokadem AH, Abdel Khalek AM, Abdel Wahab RM, Tharwat N, Gaballa GM, Elata MA, Amer T. Diagnostic Accuracy of Multiparametric Magnetic Resonance Imaging for Differentiation Between Parotid Neoplasms.
2019; 70: 264-272 [PMID: 30922790 DOI: 10.1016/j.carj.2018.10.010]
16 Zhang W, Zuo Z, Luo N, Liu L, Jin G, Liu J, Su D. Non-enhanced MRI in combination with color Doppler flow imaging for improving diagnostic accuracy of parotid gland lesions.
2018; 275: 987-995 [PMID: 29430614 DOI: 10.1007/s00405-018-4895-6]
17 Matsushima N, Maeda M, Takamura M, Takeda K. Apparent diffusion coefficients of benign and malignant salivary gland tumors. Comparison to histopathological findings.
2007; 34: 183-189 [PMID: 17568674 DOI: 10.1016/j.neurad.2007.04.002]
18 Faheem MH, Shady S, Refaat MM. Role of magnetic resonance imaging (MRI) including diffusion weighted images (DWIs) in assessment of parotid gland masses with histopathological correlation.
2018; 49: 368-373 [DOI: 10.1016/j.ejrnm.2018.03.001]
19 Habermann CR, Gossrau P, Graessner J, Arndt C, Cramer MC, Reitmeier F, Jaehne M, Adam G. Diffusion-weighted echo-planar MRI: a valuable tool for differentiating primary parotid gland tumors?
2005; 177: 940-945 [PMID: 15973595 DOI: 10.1055/s-2005-858297]
20 Takumi K, Fukukura Y, Hakamada H, Ideue J, Kumagae Y, Yoshiura T. Value of diffusion tensor imaging in differentiating malignant from benign parotid gland tumors.
2017; 95: 249-256 [PMID: 28987676 DOI: 10.1016/j.ejrad.2017.08.013]
21 Matsusue E, Fujihara Y, Matsuda E, Tokuyasu Y, Nakamoto S, Nakamura K, Ogawa T. Differentiating parotid tumors by quantitative signal intensity evaluation on MR imaging.
2017; 46: 37-43 [PMID: 28704680 DOI: 10.1016/j.clinimag.2017.06.009]
22 Ogawa T, Kojima I, Ishii R, Sakamoto M, Murata T, Suzuki T, Kato K, Nakanome A, Ohkoshi A, Ishida E, Kakehata S, Shiga K, Katori Y. Clinical utility of dynamic-enhanced MRI in salivary gland tumors: retrospective study and literature review.
2018; 275: 1613-1621 [PMID: 29623392 DOI: 10.1007/s00405-018-4965-9]
23 Tsushima Y, Matsumoto M, Endo K. Parotid and parapharyngeal tumours: tissue characterization with dynamic magnetic resonance imaging.
1994; 67: 342-345 [PMID: 8173873 DOI: 10.1259/0007-1285-67-796-342]
24 Yabuuchi H, Fukuya T, Tajima T, Hachitanda Y, Tomita K, Koga M. Salivary gland tumors: diagnostic value of gadolinium-enhanced dynamic MR imaging with histopathologic correlation.
2003; 226: 345-354 [PMID: 12563124 DOI: 10.1148/radiol.2262011486]
25 Hisatomi M, Asaumi J, Yanagi Y, Unetsubo T, Maki Y, Murakami J, Matsuzaki H, Honda Y, Konouchi H. Diagnostic value of dynamic contrast-enhanced MRI in the salivary gland tumors.
2007; 43: 940-947 [PMID: 17257881 DOI: 10.1016/j.oraloncology.2006.11.009]
26 Sumi M, Nakamura T. Head and neck tumours: combined MRI assessment based on IVIM and TIC analyses for the differentiation of tumors of different histological types.
2014; 24: 223-231 [PMID: 24013848 DOI: 10.1007/s00330-013-3002-z]
27 Lam PD, Kuribayashi A, Imaizumi A, Sakamoto J, Sumi Y, Yoshino N, Kurabayashi T. Differentiating benign and malignant salivary gland tumours: diagnostic criteria and the accuracy of dynamic contrast-enhanced MRI with high temporal resolution.
2015; 88: 20140685 [PMID: 25791568 DOI: 10.1259/bjr.20140685]
28 Eida S, Ohki M, Sumi M, Yamada T, Nakamura T. MR factor analysis: improved technology for the assessment of 2D dynamic structures of benign and malignant salivary gland tumors.
2008; 27: 1256-1262 [PMID: 18504743 DOI: 10.1002/jmri.21349]
29 Xu Z, Zheng S, Pan A, Cheng X, Gao M. A multiparametric analysis based on DCE-MRI to improve the accuracy of parotid tumor discrimination.
2019; 46: 2228-2234 [PMID: 31372671 DOI: 10.1007/s00259-019-04447-9]
30 Huang N, Xiao Z, Chen Y, She D, Guo W, Yang X, Chen Q, Cao D, Chen T. Quantitative dynamic contrast-enhanced MRI and readout segmentation of long variable echo-trains diffusion-weighted imaging in differentiating parotid gland tumors.
2021; 63: 1709-1719 [PMID: 34241661 DOI: 10.1007/s00234-021-02758-z]
31 Yabuuchi H, Kamitani T, Sagiyama K, Yamasaki Y, Hida T, Matsuura Y, Hino T, Murayama Y, Yasumatsu R, Yamamoto H. Characterization of parotid gland tumors: added value of permeability MR imaging to DWI and DCE-MRI.
2020; 30: 6402-6412 [PMID: 32613285 DOI: 10.1007/s00330-020-07004-3]
32 Park SY, Kim HJ, Cha W. Comparative Study of Dynamic Susceptibility Contrast Perfusion MR Images between Warthin's Tumor and Malignant Parotid Tumors.
2019; 34: 38 [DOI: 10.7180/kmj.2019.34.1.38]
33 Abdel Razek AAK, Mukherji SK. Imaging of Minor Salivary Glands.
2018; 28: 295-302 [PMID: 29622120 DOI: 10.1016/j.nic.2018.01.008]
34 Fujima N, Kudo K, Tsukahara A, Yoshida D, Sakashita T, Homma A, Tha KK, Shirato H. Measurement of tumor blood flow in head and neck squamous cell carcinoma by pseudo-continuous arterial spin labeling: comparison with dynamic contrast-enhanced MRI.
2015; 41: 983-991 [PMID: 25787123 DOI: 10.1002/jmri.24885]
35 Razek AAKA. Multi-parametric MR imaging using pseudo-continuous arterial-spin labeling and diffusion-weighted MR imaging in differentiating subtypes of parotid tumors.
2019; 63: 55-59 [PMID: 31422165 DOI: 10.1016/j.mri.2019.08.005]
36 Rosenkrantz AB, Padhani AR, Chenevert TL, Koh DM, De Keyzer F, Taouli B, Le Bihan D. Body diffusion kurtosis imaging: Basic principles, applications, and considerations for clinical practice.
2015; 42: 1190-1202 [PMID: 26119267 DOI: 10.1002/jmri.24985]
37 Qian W, Xu XQ, Zhu LN, Ma G, Su GY, Bu SS, Wu FY. Preliminary study of using diffusion kurtosis imaging for characterizing parotid gland tumors.
2019; 60: 887-894 [PMID: 30259752 DOI: 10.1177/0284185118803784]
38 Abdel Razek AA, Poptani H. MR spectroscopy of head and neck cancer.
2013; 82: 982-989 [PMID: 23485098 DOI: 10.1016/j.ejrad.2013.01.025]
39 King AD, Yeung DK, Ahuja AT, Tse GM, Yuen HY, Wong KT, van Hasselt AC. Salivary gland tumors at
proton MR spectroscopy.
2005; 237: 563-569 [PMID: 16244265 DOI: 10.1148/radiol.2372041309]
40 El-Naggar AK, Chan JKC, Grandis JR, Takata T, Slootweg PJ. WHO classification of head and neck tumours. 4th ed. Lyon: International Agency for Research on Cancer, 2017: 159-201
41 Speight PM, Barrett AW. Salivary gland tumours: diagnostic challenges and an update on the latest WHO classification.
2020; 26: 147-158 [DOI: 10.1016/j.mpdhp.2020.01.001]
42 Speight PM, Barrett AW. Salivary gland tumours.
2002; 8: 229-240 [PMID: 12363107 DOI: 10.1034/j.1601-0825.2002.02870.x]
43 Branstetter BF. Benign tumors. Parotid space. In: Hansberger HR. Diagnostic Imaging: Head and Neck. 2nd ed. Canada: Amirsys, 2011; 5: 5-28
44 Kato H, Kawaguchi M, Ando T, Mizuta K, Aoki M, Matsuo M. Pleomorphic adenoma of salivary glands: common and uncommon CT and MR imaging features.
2018; 36: 463-471 [PMID: 29845358 DOI: 10.1007/s11604-018-0747-y]
45 Ito FA, Jorge J, Vargas PA, Lopes MA. Histopathological findings of pleomorphic adenomas of the salivary glands.
2009; 14: E57-E61 [PMID: 19179950]
46 Kessler AT, Bhatt AA. Review of the Major and Minor Salivary Glands, Part 2: Neoplasms and Tumor-like Lesions.
2018; 8: 48 [PMID: 30546932 DOI: 10.4103/jcis.JCIS_46_18]
47 Tsushima Y, Matsumoto M, Endo K, Aihara T, Nakajima T. Characteristic bright signal of parotid pleomorphic adenomas on T2-weighted MR images with pathological correlation.
1994; 49: 485-489 [PMID: 8088045 DOI: 10.1016/s0009-9260(05)81748-9]
48 Ginat DT. Imaging of Benign Neoplastic and Nonneoplastic Salivary Gland Tumors.
2018; 28: 159-169 [PMID: 29622111 DOI: 10.1016/j.nic.2018.01.002]
49 Zaghi S, Hendizadeh L, Hung T, Farahvar S, Abemayor E, Sepahdari AR. MRI criteria for the diagnosis of pleomorphic adenoma: a validation study.
2014; 35: 713-718 [PMID: 25128908 DOI: 10.1016/j.amjoto.2014.07.013]
50 Kato H, Kanematsu M, Watanabe H, Mizuta K, Aoki M. Salivary gland tumors of the parotid gland: CT and MR imaging findings with emphasis on intratumoral cystic components.
2014; 56: 789-795 [PMID: 24948426 DOI: 10.1007/s00234-014-1386-3]
51 Mukai H, Motoori K, Horikoshi T, Takishima H, Nagai Y, Okamoto Y, Uno T. Basal cell adenoma of the parotid gland; MR features and differentiation from pleomorphic adenoma.
2016; 45: 20150322 [PMID: 26837669 DOI: 10.1259/dmfr.20150322]
52 Zheng N, Li R, Liu W, Shao S, Jiang S. The diagnostic value of combining conventional, diffusion-weighted imaging and dynamic contrast-enhanced MRI for salivary gland tumors.
2018; 91: 20170707 [PMID: 29902075 DOI: 10.1259/bjr.20170707]
53 Khamis MEM, Ahmed AF, Ismail EI, Bayomy MF, El-Anwarc MW. The diagnostic efficacy of apparent diffusion coefficient value and Choline/Creatine ratio in differentiation between parotid gland tumors.
2018; 49: 358-367 [DOI: 10.1016/j.ejrnm.2018.02.004]
54 Espinoza S, Halimi P. Interpretation pearls for MR imaging of parotid gland tumor.
2013; 130: 30-35 [PMID: 22819222 DOI: 10.1016/j.anorl.2011.12.006]
55 Hisatomi M, Asaumi J, Yanagi Y, Konouchi H, Matsuzaki H, Honda Y, Kishi K. Assessment of pleomorphic adenomas using MRI and dynamic contrast enhanced MRI.
2003; 39: 574-579 [PMID: 12798400 DOI: 10.1016/s1368-8375(03)00040-x]
56 Kato H, Fujimoto K, Matsuo M, Mizuta K, Aoki M. Usefulness of diffusion-weighted MR imaging for differentiating between Warthin's tumor and oncocytoma of the parotid gland.
2017; 35: 78-85 [PMID: 28074380 DOI: 10.1007/s11604-016-0608-5]
57 Ikeda M, Motoori K, Hanazawa T, Nagai Y, Yamamoto S, Ueda T, Funatsu H, Ito H. Warthin tumor of the parotid gland: diagnostic value of MR imaging with histopathologic correlation.
2004; 25: 1256-1262 [PMID: 15313720]
58 Minami M, Tanioka H, Oyama K, Itai Y, Eguchi M, Yoshikawa K, Murakami T, Sasaki Y. Warthin tumor of the parotid gland: MR-pathologic correlation.
1993; 14: 209-214 [PMID: 8427092]
59 Ding J, Wang W, Peng W, Zhou X, Chen T. MRI and CT imaging characteristics of myoepithelioma of the parotid gland.
2016; 57: 837-843 [PMID: 26508793 DOI: 10.1177/0284185115609364]
60 Sepúlveda I, Platín E, Spencer ML, Mucientes P, Frelinghuysen M, Ortega P, Ulloa D. Oncocytoma of the parotid gland: a case report and review of the literature.
2014; 7: 109-116 [PMID: 24707257 DOI: 10.1159/000359998]
61 Hisatomi M, Asaumi J, Konouchi H, Yanagi Y, Matsuzaki H, Kishi K. Assessment of dynamic MRI of Warthin's tumors arising as multiple lesions in the parotid glands.
2002; 38: 369-372 [PMID: 12076701 DOI: 10.1016/s1368-8375(01)00073-2]
62 Sakai E, Yoda T, Shimamoto H, Hirano Y, Kusama M, Enomoto S. Pathologic and imaging findings of an oncocytoma in the deep lobe of the left parotid gland.
2003; 32: 563-565 [PMID: 14759120]
63 Iida E, Wiggins RH 3rd, Anzai Y. Bilateral parotid oncocytoma with spontaneous intratumoral hemorrhage: a rare hypervascular parotid tumor with ASL perfusion.
2016; 40: 357-360 [PMID: 27133667 DOI: 10.1016/j.clinimag.2016.02.003]
64 Weitzel M, Cohn JE, Spector H. Myoepithelioma of the Parotid Gland: A Case Report with Review of the Literature and Classic Histopathology.
2017; 2017: 6036179 [PMID: 28900549 DOI: 10.1155/2017/6036179]
65 Shimizu K, Iwai H, Ikeda K, Sakaida N, Sawada S. Intraparotid facial nerve schwannoma: a report of five cases and an analysis of MR imaging results.
2005; 26: 1328-1330 [PMID: 15956491]
66 Chikui T, Yonetsu K, Yoshiura K, Miwa K, Kanda S, Ozeki S, Shinohara M. Imaging findings of lipomas in the orofacial region with CT, US, and MRI.
1997; 84: 88-95 [PMID: 9247958 DOI: 10.1016/s1079-2104(97)90302-4]
67 Agaimy A, Ihrler S, M?rkl B, Lell M, Zenk J, Hartmann A, Michal M, Skalova A. Lipomatous salivary gland tumors: a series of 31 cases spanning their morphologic spectrum with emphasis on sialolipoma and oncocytic lipoadenoma.
2013; 37: 128-137 [PMID: 23232852 DOI: 10.1097/PAS.0b013e31826731e0]
68 Lara-Sánchez H, Peral-Cagigal B, Madrigal-Rubiales B, Verrier-Hernández A. Cavernous hemangioma of the parotid gland in adults.
2014; 6: e592-e594 [PMID: 25674332 DOI: 10.4317/jced.51750]
69 Salama AA, El-Barbary AH, Mlees MA, Esheba GES. Value of apparent diffusion coefficient and magnetic resonance spectroscopy in the identification of various pathological subtypes of parotid gland tumors.
2015; 46: 45-52 [DOI: 10.1016/j.ejrnm.2014.09.005]
70 Kashiwagi N, Nakatsuka SI, Murakami T, Enoki E, Yamamoto K, Nakanishi K, Chikugo T, Kurisu Y, Kimura M, Hyodo T, Tsukabe A, Kakigi T, Tomita Y, Ishii K, Narumi Y, Yagyu Y, Tomiyama N. MR imaging features of mammary analogue secretory carcinoma and acinic cell carcinoma of the salivary gland: a preliminary report.
2018; 47: 20170218 [PMID: 29493279 DOI: 10.1259/dmfr.20170218]
71 Skálová A, Vanecek T, Sima R, Laco J, Weinreb I, Perez-Ordonez B, Starek I, Geierova M, Simpson RH, Passador-Santos F, Ryska A, Leivo I, Kinkor Z, Michal M. Mammary analogue secretory carcinoma of salivary glands, containing the ETV6-NTRK3 fusion gene: a hitherto undescribed salivary gland tumor entity.
2010; 34: 599-608 [PMID: 20410810 DOI: 10.1097/PAS.0b013e3181d9efcc]
72 Kurokawa R, Kurokawa M, Baba A, Ota Y, Moritani T, Srinivasan A. Radiological features of head and neck mammary analogue secretory carcinoma: 11 new cases with a systematic review of 29 cases reported in 28 publications.
2021; 63: 1901-1911 [PMID: 34427706 DOI: 10.1007/s00234-021-02796-7]
73 Khalele BA. Systematic review of mammary analog secretory carcinoma of salivary glands at 7 years after description.
2017; 39: 1243-1248 [PMID: 28370824 DOI: 10.1002/hed.24755]
74 Kashiwagi N, Murakami T, Chikugo T, Tomita Y, Kawano K, Nakanishi K, Mori K, Tomiyama N. Carcinoma ex pleomorphic adenoma of the parotid gland.
2012; 53: 303-306 [PMID: 22287150 DOI: 10.1258/ar.2011.110389]
75 Shum JW, Emmerling M, Lubek JE, Ord RA. Parotid lymphoma: a review of clinical presentation and management.
2014; 118: e1-e5 [PMID: 24405648 DOI: 10.1016/j.oooo.2013.10.013]
76 Wang J, Takashima S, Takayama F, Kawakami S, Saito A, Matsushita T, Momose M, Ishiyama T. Head and neck lesions: characterization with diffusion-weighted echo-planar MR imaging.
2001; 220: 621-630 [PMID: 11526259 DOI: 10.1148/radiol.2202010063]
77 Asaumi J, Yanagi Y, Hisatomi M, Matsuzaki H, Konouchi H, Kishi K. The value of dynamic contrast-enhanced MRI in diagnosis of malignant lymphoma of the head and neck.
2003; 48: 183-187 [PMID: 14680911 DOI: 10.1016/S0720-048x(02)00347-9]
78 Andreasen S, Kiss K, Mikkelsen LH, Channir HI, Plaschke CC, Melchior LC, Eriksen JG, Wessel I. An update on head and neck cancer: new entities and their histopathology, molecular background, treatment, and outcome.
2019; 127: 240-264 [PMID: 30811708 DOI: 10.1111/apm.12901]
79 Motoori K, Iida Y, Nagai Y, Yamamoto S, Ueda T, Funatsu H, Ito H, Yoshitaka O. MR imaging of salivary duct carcinoma.
2005; 26: 1201-1206 [PMID: 15891184]
80 Suto T, Kato H, Kawaguchi M, Kobayashi K, Miyazaki T, Ando T, Noda Y, Hyodo F, Matsuo M, Ishihara H, Ogawa T. MRI findings of epithelial-myoepithelial carcinoma of the parotid gland with radiologic-pathologic correlation.
2022; 40: 578-585 [PMID: 34982376 DOI: 10.1007/s11604-021-01243-0]
81 Wang H, Hoda RS, Faquin W, Rossi ED, Hotchandani N, Sun T, Pusztaszeri M, Bizzarro T, Bongiovanni M, Patel V, Jhala N, Fadda G, Gong Y. FNA biopsy of secondary nonlymphomatous malignancies in salivary glands: A multiinstitutional study of 184 cases.
2017; 125: 91-103 [PMID: 28001329 DOI: 10.1002/cncy.21798]
82 Horáková M, Porre S, Tommola S, Baně?ková M, Skálová A, Kholová I. FNA diagnostics of secondary malignancies in the salivary gland: Bi-institutional experience of 36 cases.
2021; 49: 241-251 [PMID: 33017519 DOI: 10.1002/dc.24629]
83 Mikaszewski B, Markiet K, Smuga?a A, Stodulski D, Szurowska E, Stankiewicz C. Diffusion- and Perfusion-Weighted Magnetic Resonance Imaging-An Alternative to Fine Needle Biopsy or Only an Adjunct Test in Preoperative Differential Diagnostics of Malignant and Benign Parotid Tumors?
2017; 75: 2248-2253 [PMID: 28412261 DOI: 10.1016/j.joms.2017.03.018]
 World Journal of Radiology2022年8期
- World Journal of Radiology的其它文章
- Triple rule-out computed tomography angiography: Evaluation of acute chest pain in COVID-19 patients in the emergency department
- Imaging volumes during COVID-19: A Victorian health service experience
- Progress in interventional radiology treatment of pulmonary embolism: A brief review
- Amebic liver abscess: Clinico-radiological findings and interventional management
- Augmenting prostate magnetic resonance imaging reporting to incorporate diagnostic recommendations based upon clinical risk calculators