Prognostic significance of multiple triglycerides-derived metabolic indices in patients with acute coronary syndrome
Qiao-Yu SHAO, Xiao-Teng MA, Zhi-Qiang YANG, Qiu-Xuan LI, Yu-Fei WANG, Jing LIANG,Hua SHEN, Xiao-Li LIU, Yu-Jie ZHOU, Dong-Mei SHI?, Zhi-Jian WANG?
Department of Cardiology, Beijing Anzhen Hospital, Capital Medical University, Beijing, China
ABSTRACT
Due to the gradual increased risk of recurrent events was correlated with each additional feature of the metabolic syndrome (MetS) in statin-treated coronary artery disease (CAD) patients, which implied that other cardiovascular risk factors beyond low-density lipoprotein cholesterol (LDL-C) are also worthy of attention, such as non-LDL-C dyslipidemia, fasting plasma glucose (FPG), hypertension, and abdominal obesity.[1,2]Post hoc analyses of prospective clinical trials have revealed that elevated triglyceride (TG) and reduced high-density lipoprotein cholesterol (HDL-C)are closely associated with an increased risk of acute coronary syndrome (ACS) and stable CAD, even when the recommended LDL-C targets were met.[3-5]Elevated TG level is involved in the development of primary CAD and is strongly associated with longterm mortality of established CAD.[6-9]TG showed the strongest association between all five MetS components and cardiovascular risk,[10]and is regarded as a marker for insulin resistance (IR).[11]Additionally, acute myocardial infarction (MI) accompanied with marked lipoprotein changes, including decreased total cholesterol (TC), LDL-C and HDL-C, and increased TG.[12]Previous studies showed that highsensitivity C-reactive protein (hs-CRP) is negatively correlated with TC, LDL-C, and HDL-C, other than TG, in ST-segment elevation MI patients.[13]As a result, the unique role of TG in the lipoprotein profile should be attached great attention.
In combination with non-LDL-C and glucose metabolism factors, TG-derived indices may further improve the prognosis value of isolated TG for major adverse cardiovascular event (MACE) in cardiovascular disease (CVD) patients, especially in patients with coexisting MetS or IR. Triglyceride-glucose(TyG) index, a combination of TG and FPG concentrations, is a reliable predictive marker of coronary atherosclerosis progression and calcification and has been shown to be strongly associated with MACE risk.[14-16]Elevated TG/HDL-C ratio and atherogenic index of plasma (AIP), a logarithmically transformed ratio of TG/HDL-C, a log-transformed TG/HDL-C, have been studied as alternative biomarkers to identify individuals with an adverse cardiometabolic risk profile.[17-19]The lipoprotein combine index (LCI) has also been studied as a risk predictor for cardiovascular risk in patients with ACS.[20]
The study aimed to further confirm the crucial role of TG and TG-derived metabolic indices in the evaluation and management of CVD risk by assessing the predictive value for MACE in patients with ACS after percutaneous coronary intervention (PCI).
METHODS
Study Design and Follow-up
This study is a retrospective analysis from a singlecenter prospective observational study (Clinical Trial Number: ChiCTR1800017417) including 1770 patients with ACS who underwent primary PCI or elective PCI at Beijing Anzhen Hospital, Capital Medical University, Beijing, China between June 2016 and November 2017. Finally, 1694 patients were enrolled in the present study after exclusion of patients with prior coronary artery bypass grafting, cardiogenic shock, left ventricular ejection fraction <30%, renal dysfunction with creatinine clearance <15 mL/min or chronic dialysis, extreme body mass index (BMI > 45 kg/m2), suspected familial hypertriglyceridemia [plasma TG ≥ 500 mg/dL (5.65 mmol/L)or more than one first-degree relative with TG ≥ 500 mg/dL]. Four patients were also excluded because of missing follow-up data when more than four separate attempts to contact them. All patients were followed up at the first month and every six months after discharge. This study was approved by the Institutional Review Committee of Beijing Anzhen Hospital, Capital Medical University, Beijing, China(No.2016034x) and complied with the Helsinki Declaration of Human Rights.
Data Collection
Patients’ demographic and clinical characteristics were collected at admission and venous blood samples were collected after overnight fasting prior to angiography. The TC, TG, and FPG levels were determined according to enzymatic methods. The LDL-C and HDL-C levels were measured by homogeneous assays. The severity of coronary artery lesions was quantified by the Synergy between PCI with TAXUS and Cardiac Surgery (SYNTAX) score. Global Registry of Acute Coronary Events (GRACE) risk score was assessed on admission for predicting six months death or MI risk.
Disease Definitions
The primary endpoint of the present study was a composite of MACE, including all-cause mortality,non-fatal MI, non-fatal ischemic stroke, or unplanned repeat revascularization. The diagnostic criteria of MI, ischemic stroke, and baseline medical history were defined according to the American Heart Association guideline or the European Society of Cardiology guideline and were described in detail elsewhere.[21]Unplanned revascularization refers to any non-staged revascularization within 90 days after index PCI. When more than one event occurred during follow-up, the most severe endpoint event was selected for primary endpoint analysis (death > stroke >MI > revascularization).
Calculation of TG-derived Metabolic Indices
The TyG index was calculated as Ln [fasting TG(mg/dL) × FPG (mg/dL)/2].[22]TG/HDL-C ratio was calculated as TG level (mmol/L) divided by HDL-C (mmol/L) level.[23]AIP was a logarithmically transformed ratio of TG/HDL-C, with TG and HDL-C expressed in molar concentrations.[24,25]LCI was calculated using the formula: TC × TG × LDL-C/HDL-C.[26]All patients were divided into three groups according to the tertiles distribution of TG and TG-derived metabolic indices.
Statistical Analysis
The normality of continuous variables was assessed by quantile-quantile plots. Continuous variables in normal distributions were presented as mean ± SD by the independent Student’st-test, and variables in non-normal distributions performed as median (interquartile range) by the Mann-WhitneyUtest. Categorical variables were expressed as counts (percentages). The comparison between groups were examined by the Pearson’s chi-squared test or Fisher’s exact probability test (categorical variables),and ANOVA or the Kruskal-WallisHtest (continuous variables). The Kaplan-Meier method is used to plot the time-survival curve. The unadjusted and adjusted Cox proportional hazards model was used to assess the association between the TG-derived metabolic indices (considered as a continuous variable and categorical variable) and MACE. Multiple confounders including clinically relevant risk factors and statistically significant variables in univariate analysis were adjusted. The results of survival analyses were presented as hazard ratio (HR) and 95%confidence interval (CI). The two-sided significance level was set atP-value < 0.05. All statistical analyses were performed with R statistical software 4.1.0(R Foundation for Statistical Computing, Vienna,Austria) and IBM SPSS 26.0 (SPSS Inc., IBM, Chicago,IL, USA).
RESULTS
Baseline Characteristics
Among the 1694 patients enrolled, the average age was 60.0 ± 10.4 years, 76.5% of patients were male,43.7% of patients were current smokers, 63.8% of patients had hypertension, 79.6% of patients had a history of dyslipidemia, and 45.8% of patients had diabetes mellitus. Table 1 summarizes baseline characteristics by MACE. Patients who suffered MACE had higher levels of TG, TyG index, AIP, TG/HDL-C ratio, and LCI. Patients with adverse events were more likely to have the medical history of diabetes mellitus, chronic kidney disease, and MI, and elevated concentration of TC, LDL-C, FPG, glycosylated hemoglobin, and hs-CRP. Higher SYNTAX score and morecomplex coronary lesions appeared in subjects suffered MACE. At the same time, we also summarize the data on baseline characteristics grouped by TG and TG-derived metabolic indices tertiles (supplemental material, Tables 1S-5S). Patients with highest tertiles by any of the four TG-derived metabolic indices had higher levels of hs-CRP. They also were more likely to have history of smoking, dyslipidemia, and diabetes mellitus.
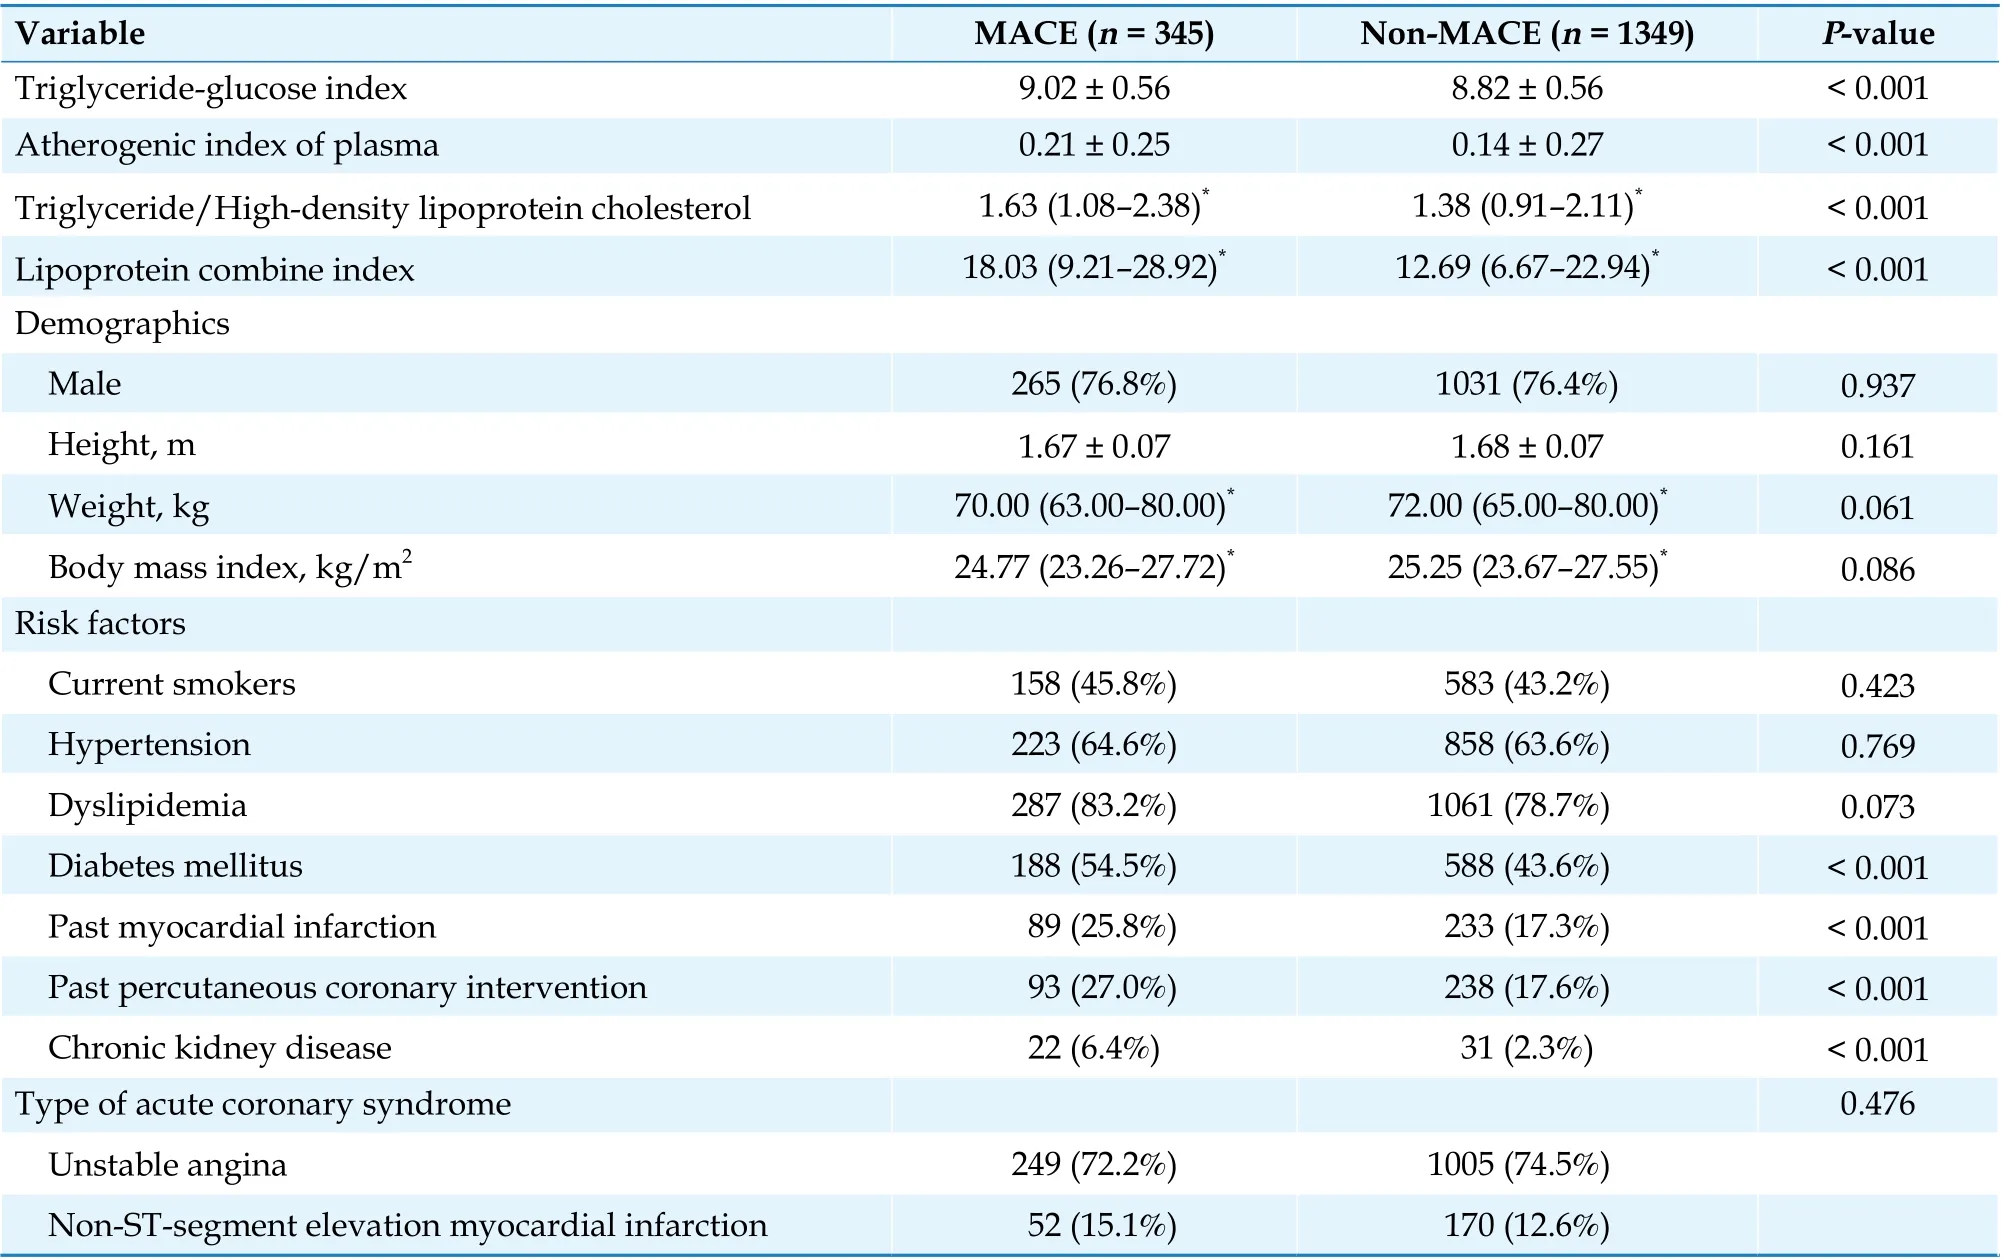
Table 1 Baseline characteristics of study subjects by MACE.
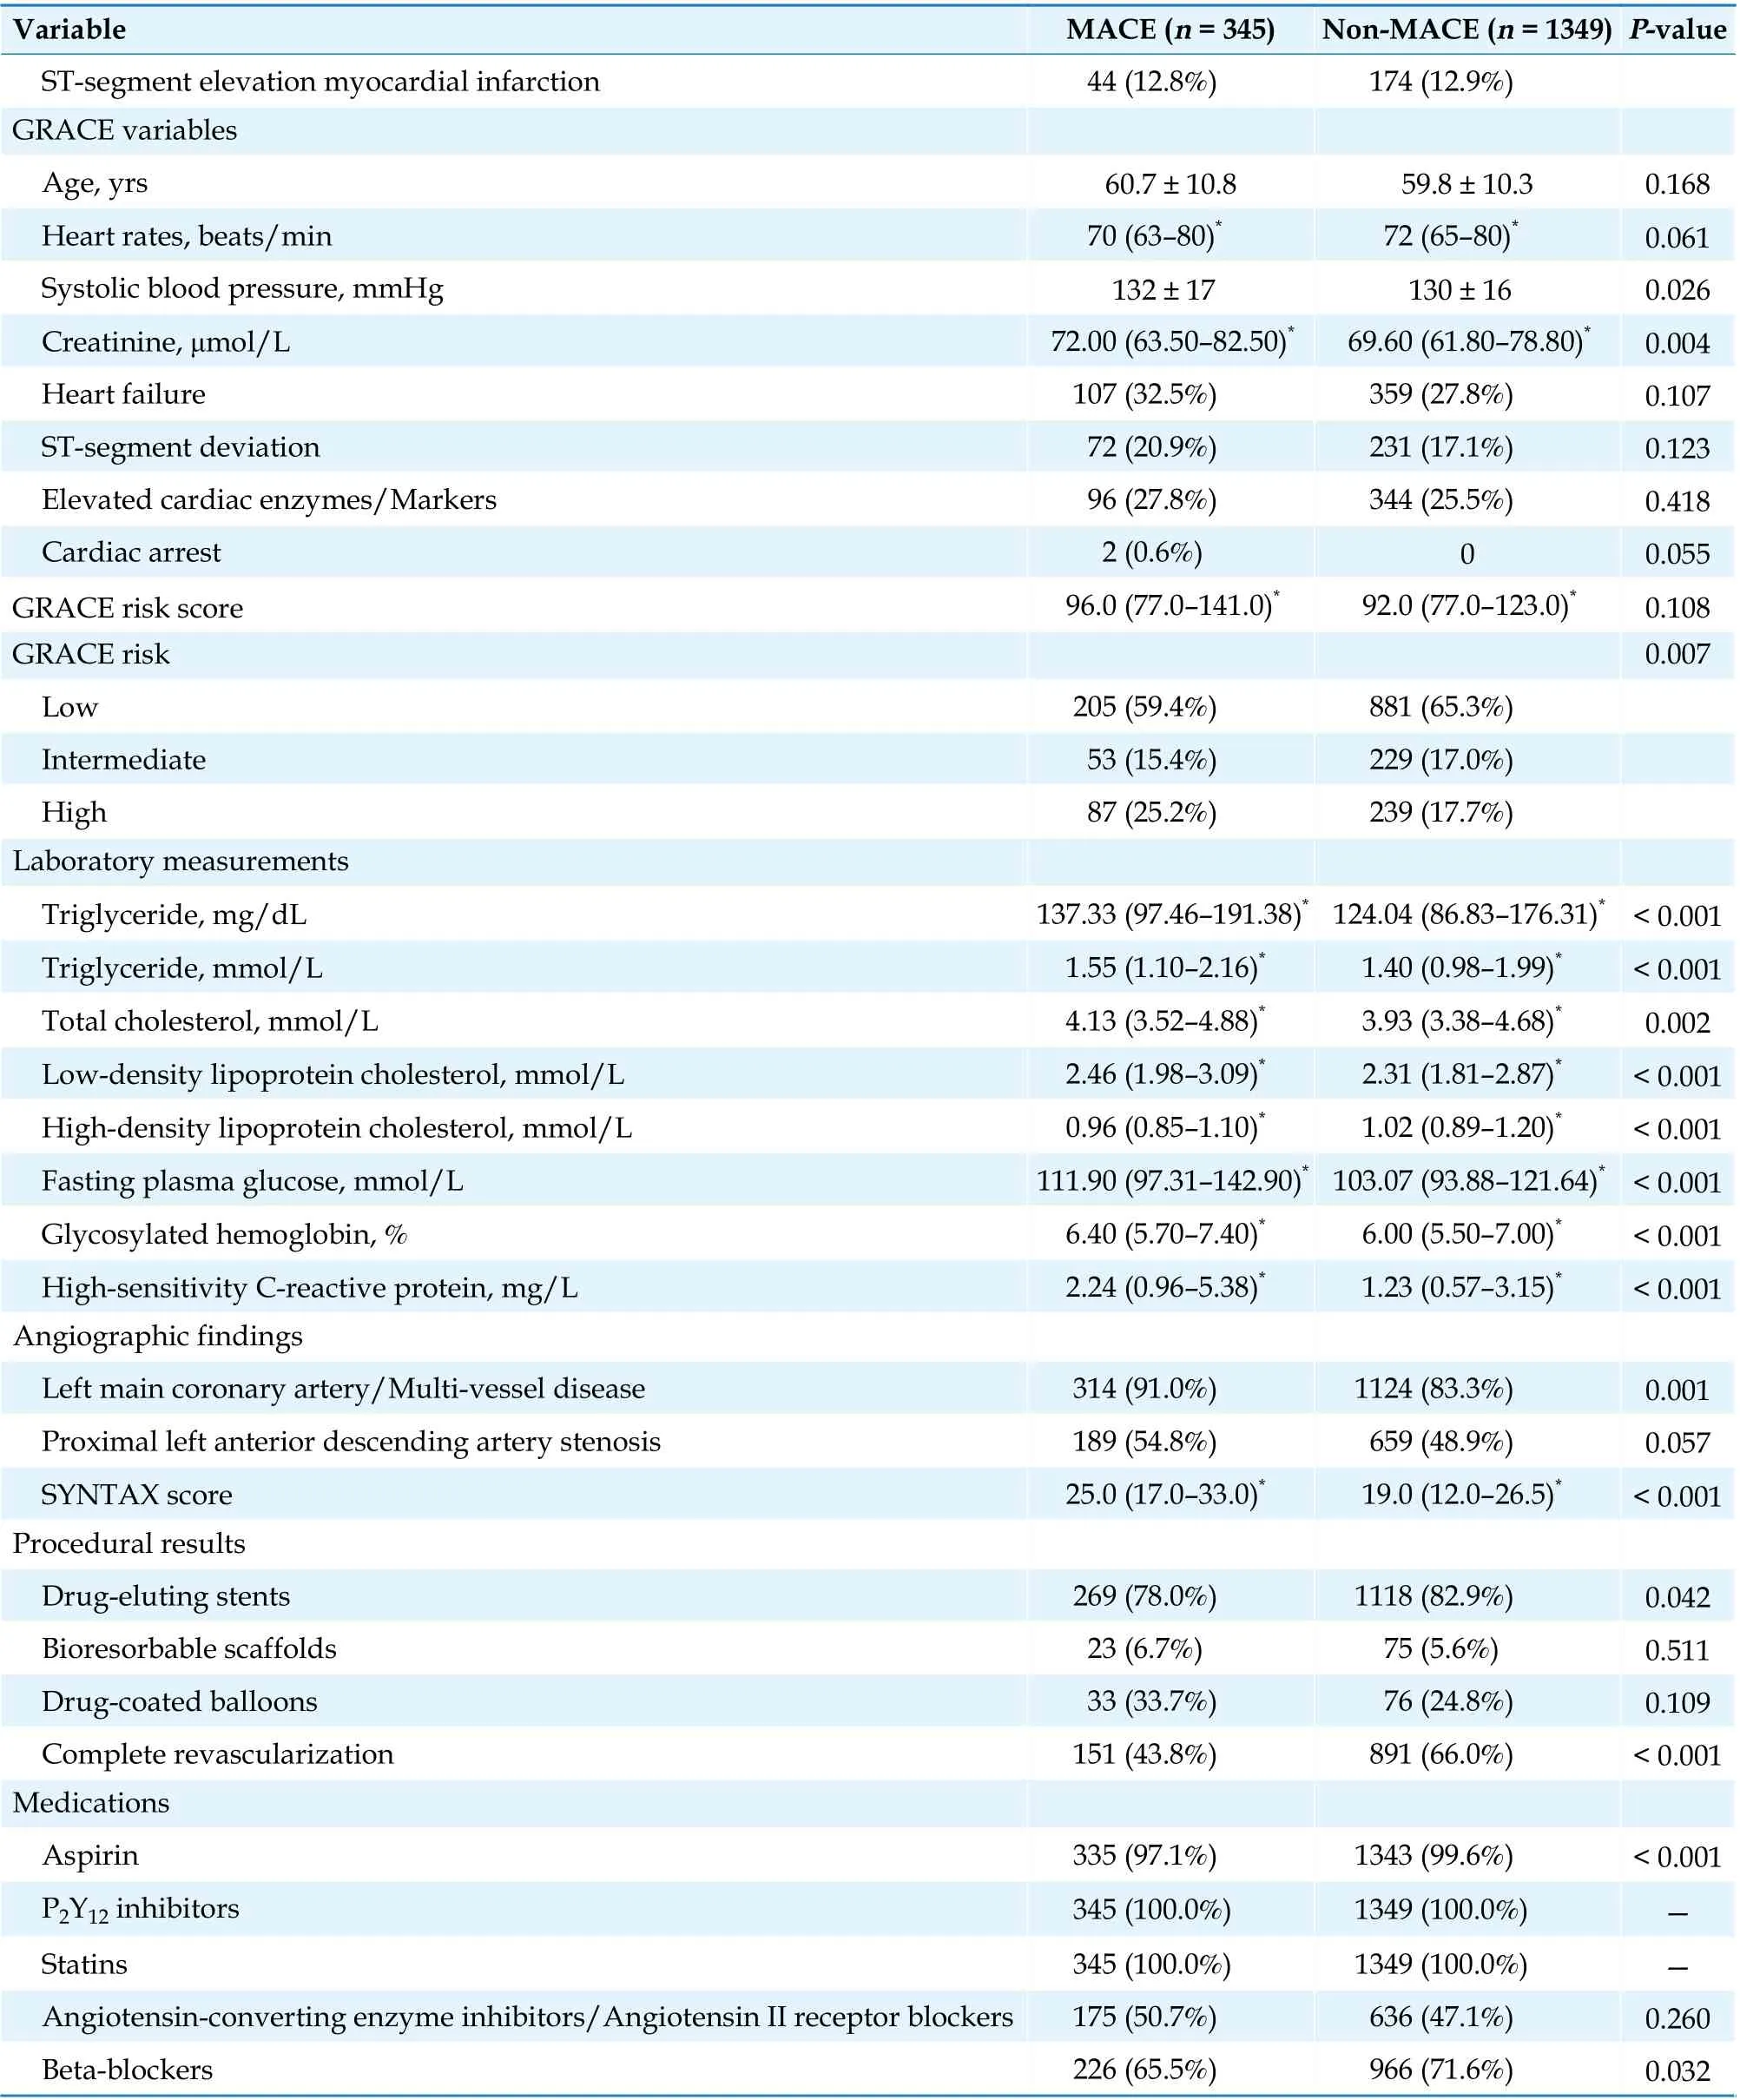
Continued
TG-derived Metabolic Indices and Cardiovascular Events

Figure 1 Survival curves of MACEs based on tertiles of TyG index (A), AIP (B), TG/HDL-C (C), and LCI (D). Kaplan-Meier curves were constructed to assess the survival free of MACEs by tertiles of TyG index, AIP, TG/HDL-C, and LCI. T1 represents for lowest concentration group, T2 represents for medium concentration group and T3 represents for highest concentration group. AIP: atherogenic index of plasma; HDL-C: high-density lipoprotein cholesterol; LCI: lipoprotein combine index; MACE: major adverse cardiovascular event; TG: triglyceride; TyG: triglyceride-glucose.

Table 2 Cox proportional hazards analyses of four TG-derived metabolic indices to predict major adverse cardiovascular event.
Over a median follow-up time of 927 days (interquartile range: 927-1109 days), 345 of 1694 patients suffered MACEs, representing 42 deaths (2.5%), 25 non-fatal strokes (1.5%), 48 non-fatal MI cases (2.8%)and 281 unplanned revascularizations (16.6%). Fiftyone of them suffered more than one MACE event.Kaplan-Meier analyses demonstrated that patients in the highest tertile of TG and any of the four TGderived indices were significantly more likely to have MACE than those in lowest and median tertiles (log-rankP≤ 0.001, Figure 1 and supplemental material, Figure 1S). In univariate Cox regression analyses, elevated TG-derived metabolic indices were associated with a higher incidence of MACE regardless of the indices used, independent of whether the indices were used as a continuous or categorial variables (Table 2). The adjusted impact of TG and four TG-derived indices on MACE was also showed in Table 2. After adjusting for clinically relevant risk factors and statistically significant variables, TGderived metabolic indices have significant correlation with MACE when TG-derived metabolic indices as a continuous variable (TG-adjusted HR = 1.002,95% CI: 1.001-1.003; TyG index-adjusted HR = 1.736,95% CI: 1.398-2.156; AIP-adjusted HR = 2.513, 95% CI:1.562-4.043; TG/HDL-C-adjusted HR = 1.148, 95% CI:1.048-1.258; and LCI-adjusted HR = 1.009, 95% CI:1.004-1.014;P< 0.001 for all indices). The MACE risk rose with increasing TG and four TG-derived metabolic indices as shown in restricted cubic splines(Figure 2 and supplemental material, Figure 2S).The incidence of MACE in patients with the highest tertile of four TG-derived metabolic indices was significantly higher than that in those with the lowest and median tertiles (P< 0.05 for all comparative,Figure 3). In Cox regression analyses, the highest tertiles of any of the four TG-related indicators independently correlated with the risk of MACE (TG-adjusted HR = 1.494, 95% CI: 1.120-1.994; TyG indexadjusted HR = 1.830, 95% CI: 1.341-2.497; AIP-adjusted HR = 1.533, 95% CI: 1.135-2.071; TG/HDL-Cadjusted HR = 1.570, 95% CI: 1.163-2.121; and LCIadjusted HR = 2.008, 95% CI: 1.487-2.711;P< 0.05 for all indices), while the lowest and median tertiles had no impact on MACE (P> 0.05 for all indices)(Table 2).
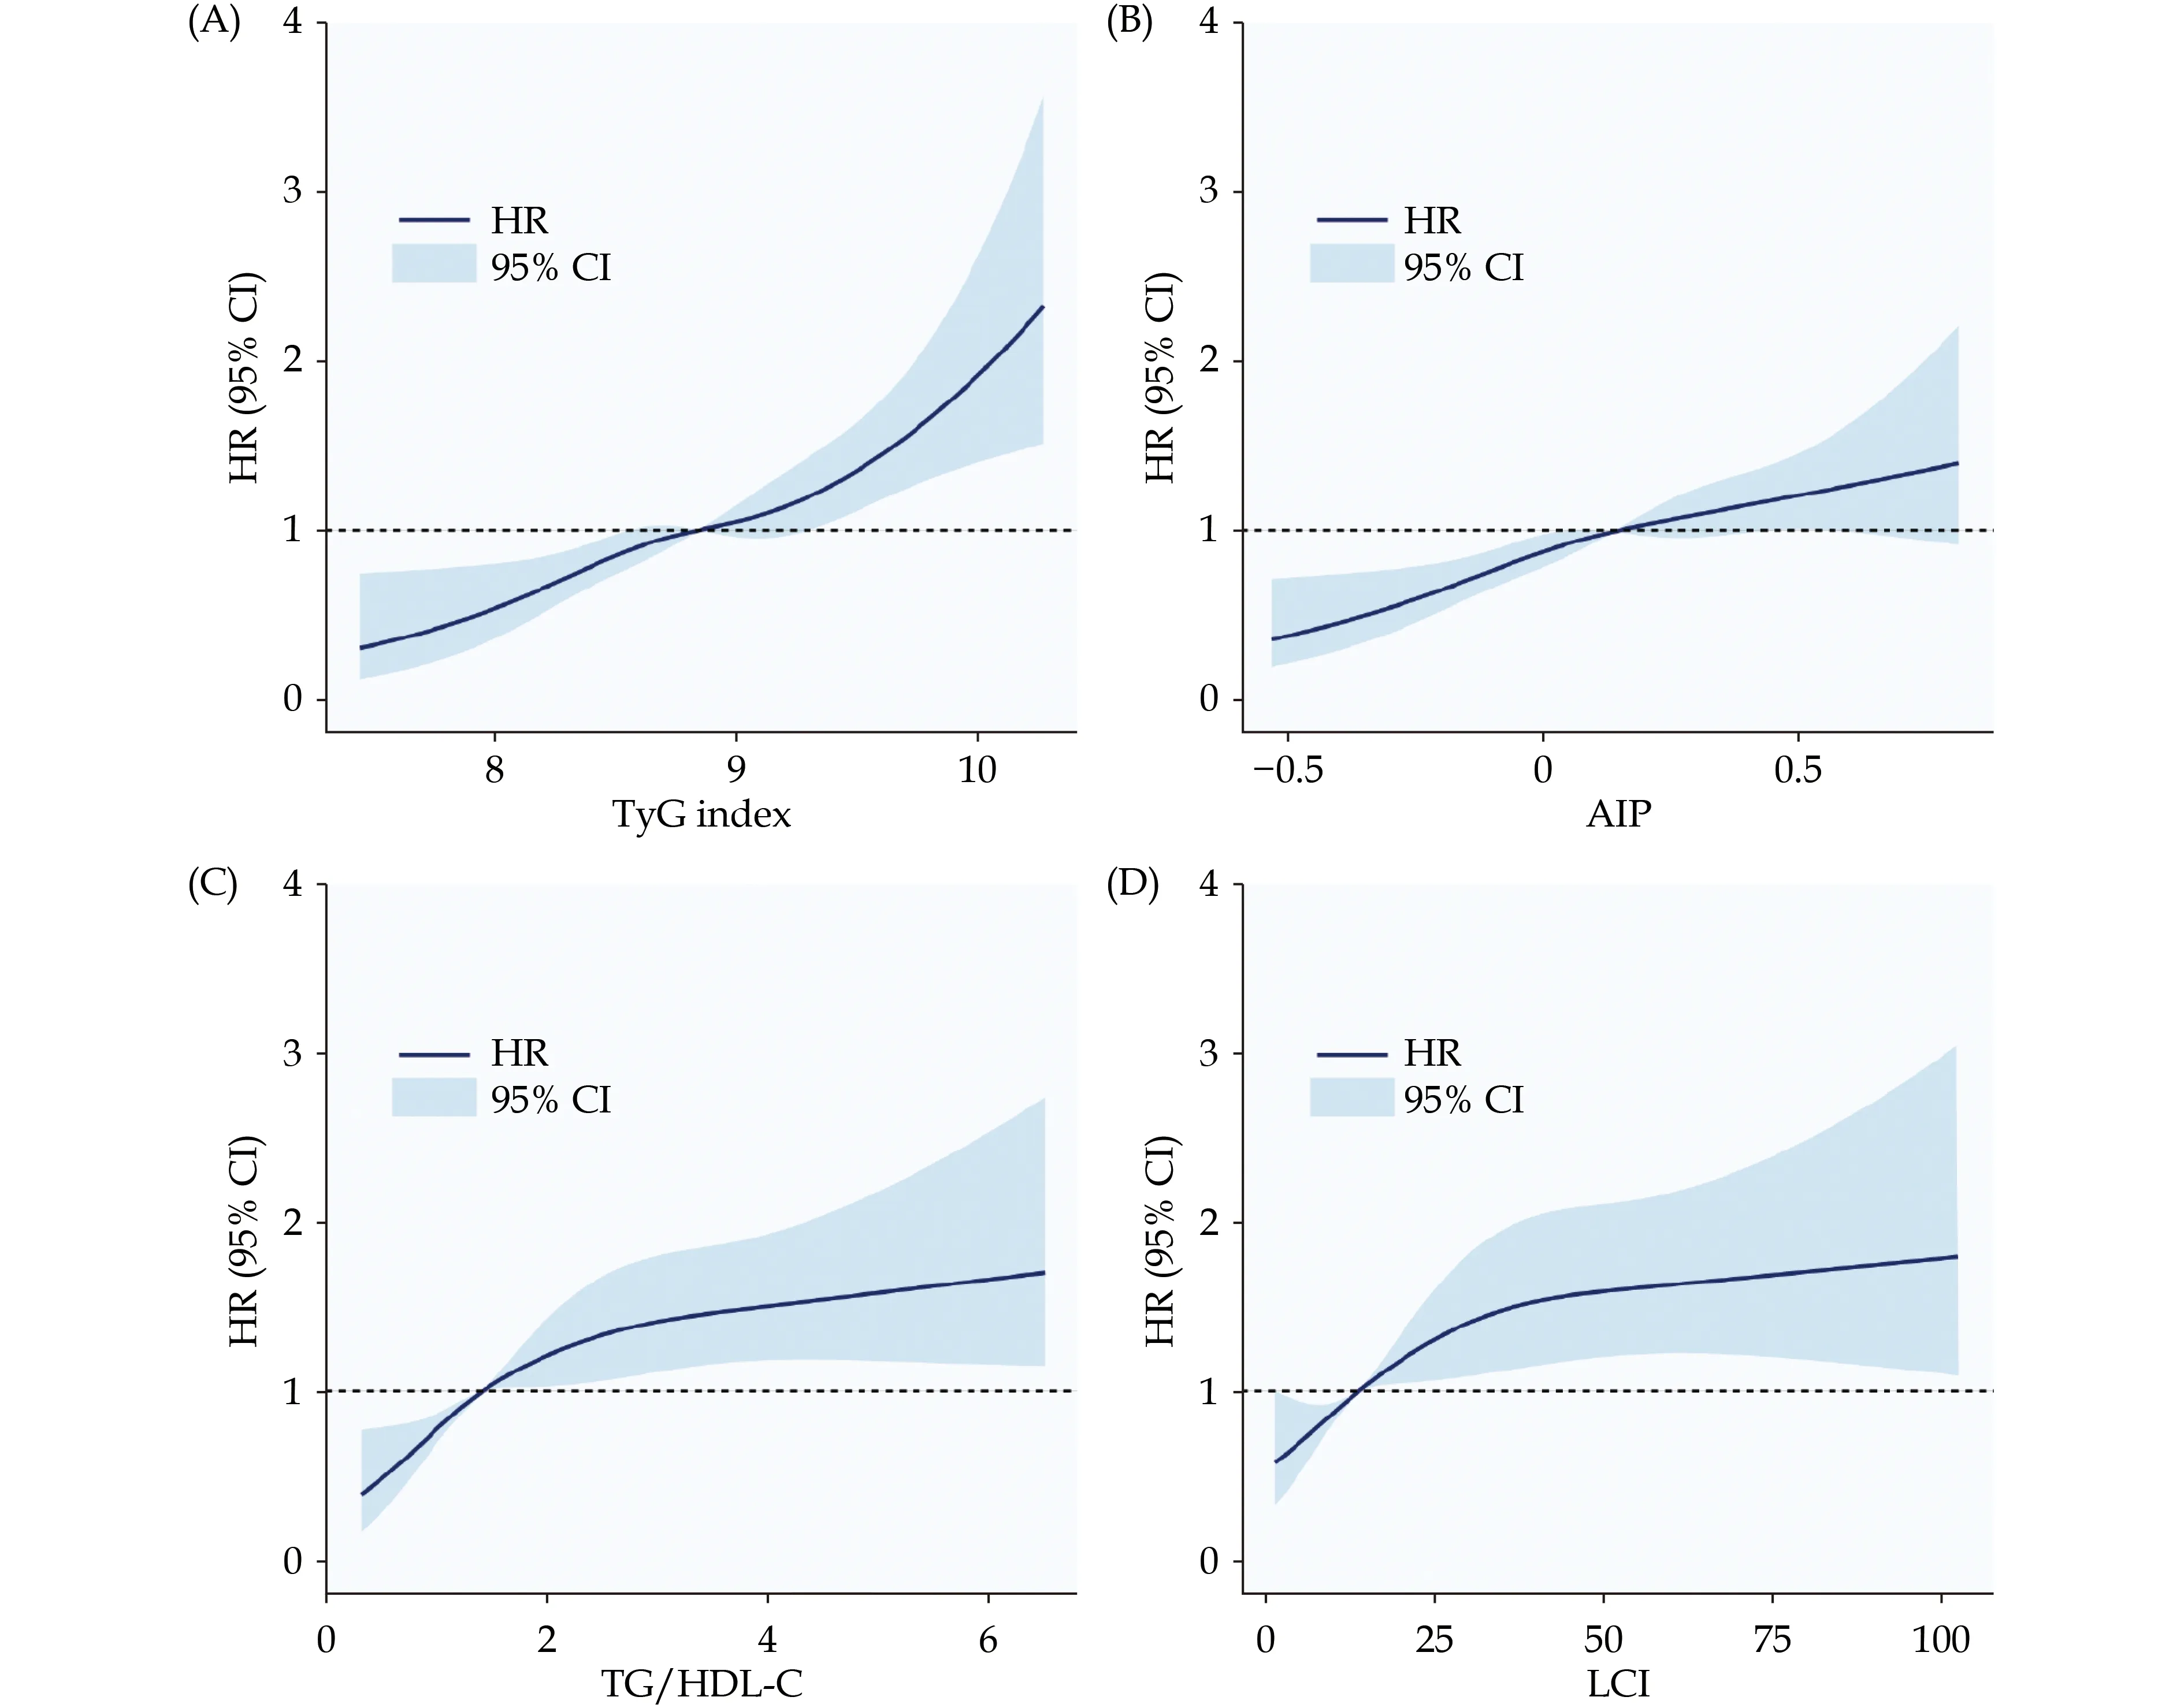
Figure 2 Restricted cubic splines for the risk of major adverse cardiovascular event according to TyG index (A), AIP (B), TG/HDL-C(C), and LCI (D). AIP: atherogenic index of plasma; HDL-C: high-density lipoprotein cholesterol; HR: hazard ratio; LCI: lipoprotein combine index; TG: triglyceride; TyG: triglyceride-glucose.
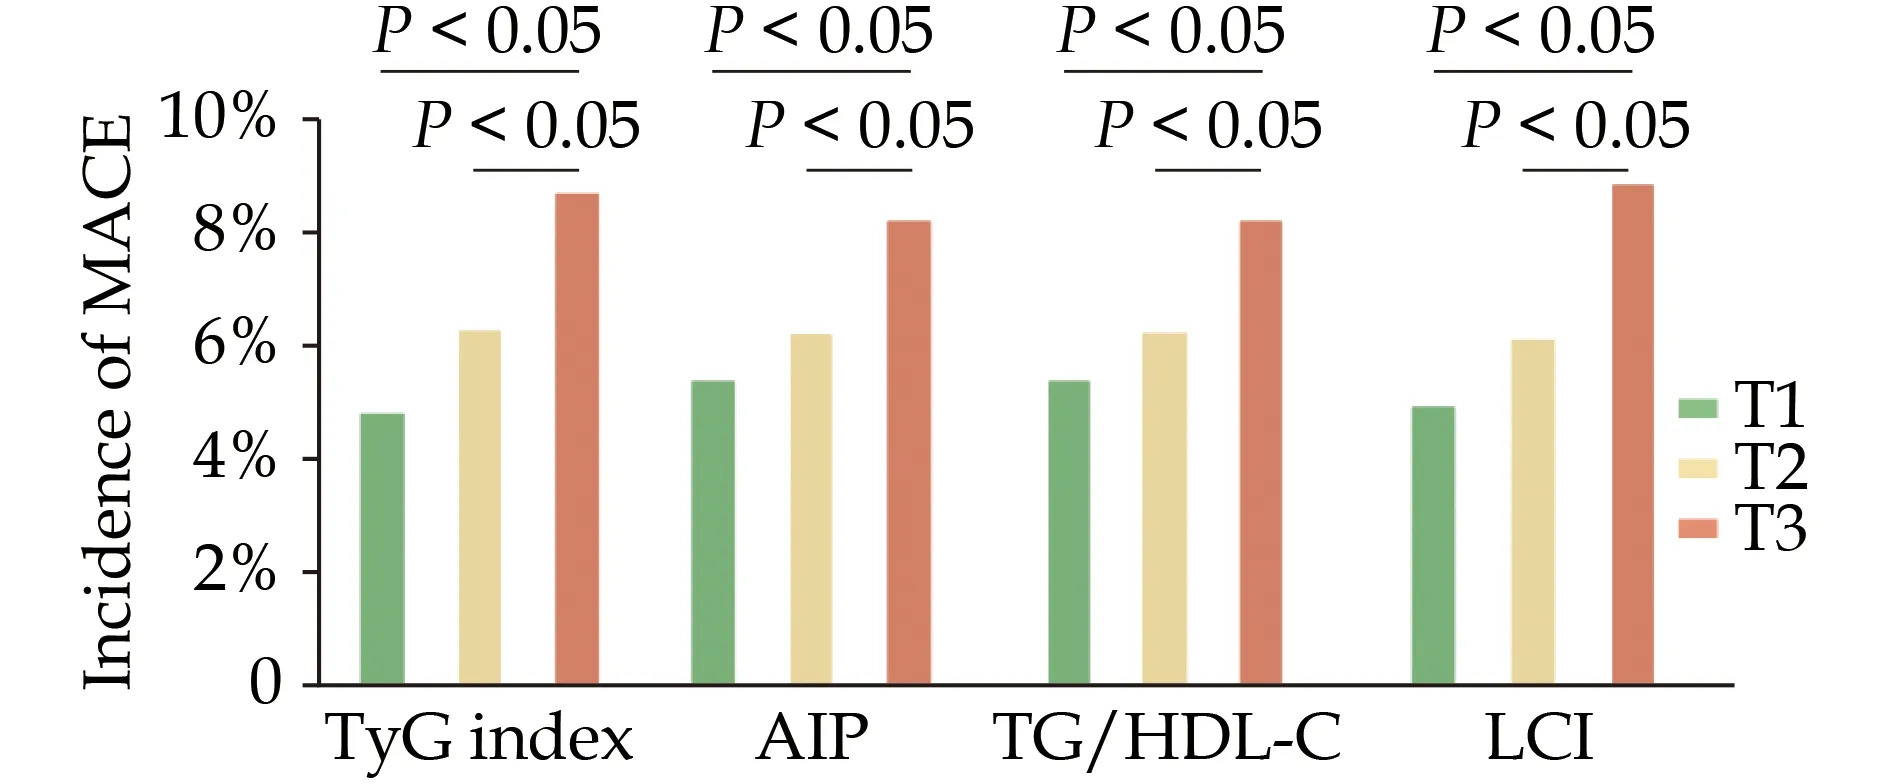
Figure 3 Incidence of MACE according to the tertiles of TGderived metabolic indices in the total population. T1 represents for lowest concentration group, T2 represents for medium concentration group and T3 represents for highest concentration group.AIP: atherogenic index of plasma; HDL-C: high-density lipoprotein cholesterol; LCI: lipoprotein combine index; MACE: major adverse cardiovascular event; TG: triglyceride; TyG: triglycerideglucose.
Predictive Role of TG-derived Metabolic Indices in MACEs
Four TG-derived metabolic indices showed significantly predictive value for MACE (P< 0.001 for all C-statistics, Table 3). After the addition of the baseline model including various confounders, the discrimination ability of four TG-derived metabolic indices for MACE remained significant (Table 4). Furthermore, whether with or without adjustment for baseline model, each of the four indices appeared to provide a significant incremental prognostic value on TG (Tables 3 & 4). For MACE risk prediction comparison, the TyG index outperformed the AIP, TG/HDL-C ratio, LCI at predicting MACE, as was seen by the comparative discrimination index values (P<0.05 for all comparative, Table 4), independent of the potential influence by clinically relevant risk factors and statistically significant variables.
Subgroup Analysis
All TG-derived metabolic indices showed similarMACE risks across demographic characteristics or comorbidities groups: age ≥ 65 years or < 65 years,BMI ≥ 25 kg/m2or < 25 kg/m2, hypertension or not,diabetes mellitus or not, hs-CRP ≥ 2 mg/L or < 2 mg/L(allPinteraction> 0.05) (Figure 4). Interestingly, TG,TyG index, AIP, and TG/HDL-C consistently and significantly predicted higher risk of MACE in the female cohort compared to the male cohort (Pinteraction<0.05).
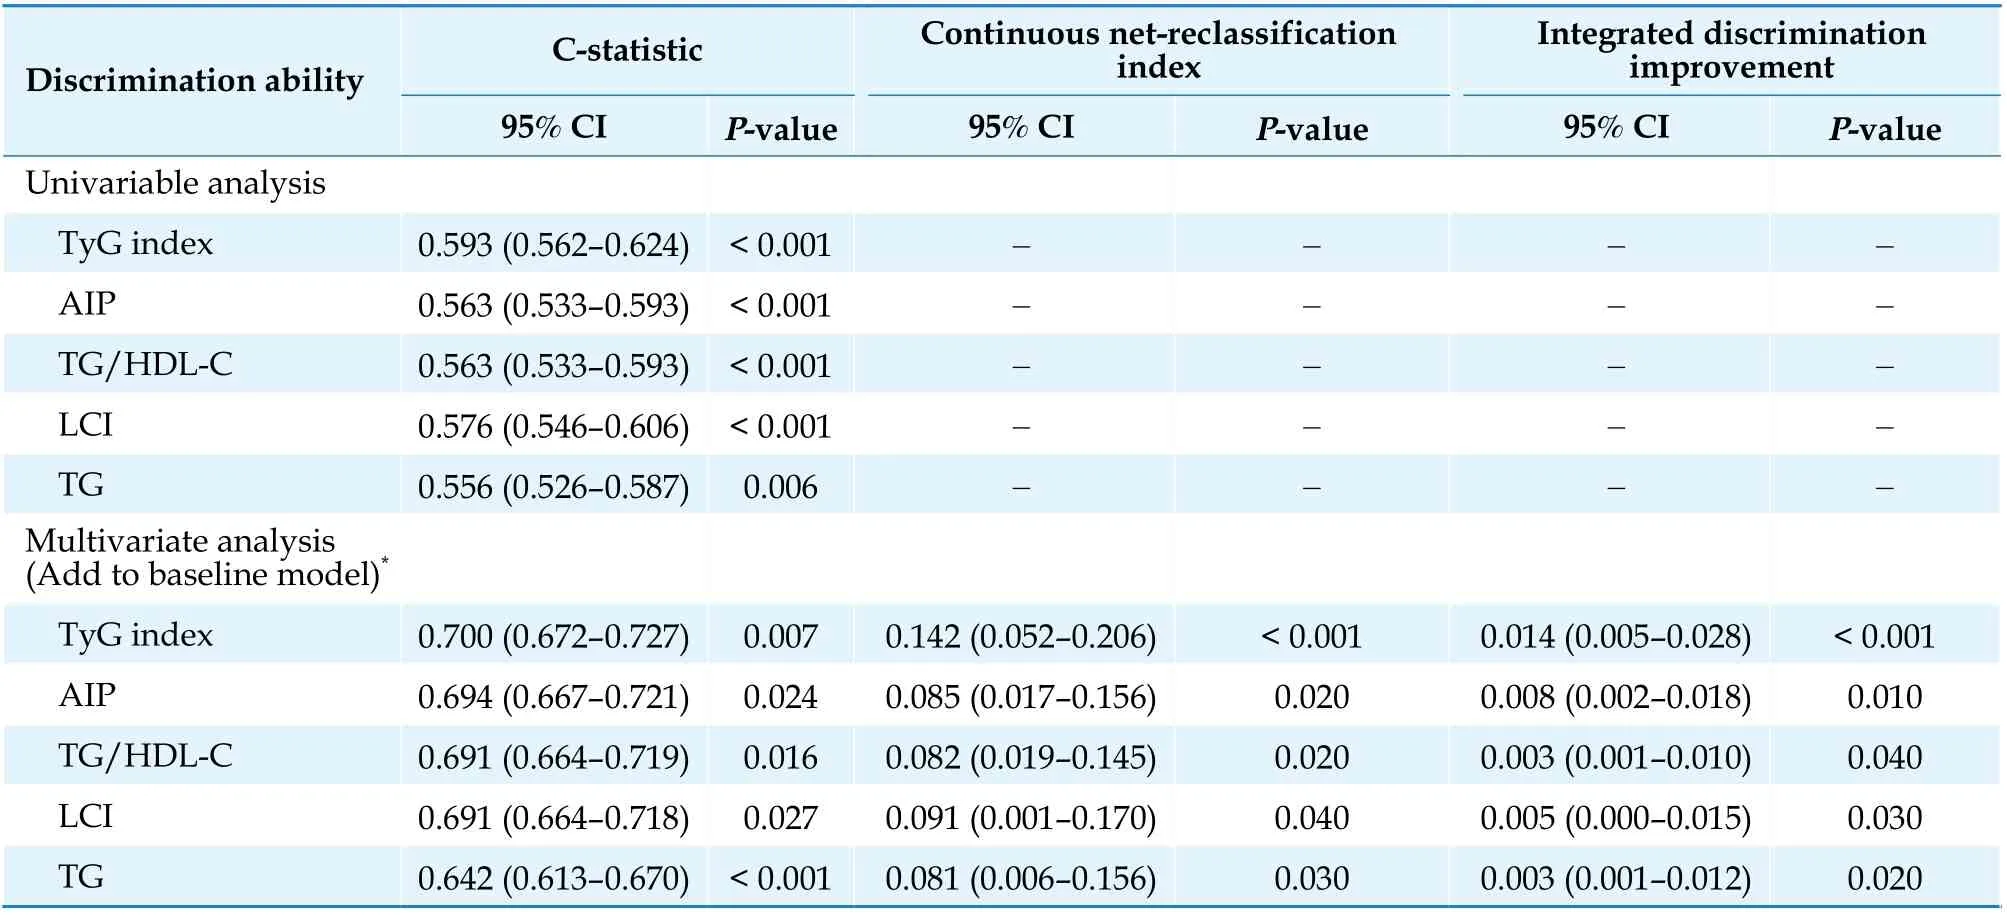
Table 3 Discrimination ability of the four TG-derived metabolic indices for major adverse cardiovascular events.
DISCUSSION
In ACS patients undergoing PCI, elevated TG and TG-derived metabolic indices were significantly associated with poor prognosis. Even after adjustment for multiple potential confounders, composite TG-derived metabolic indices were the better predictors of MACE risk than a single lipid composition,TG. Notably, the TyG index was found to be a better predictor of MACE than other TG-derived metabolic indices in these patients.
The extent to which TG directly contributes to CVD or is a biomarker of risk has been debated for several decades. After the introduction of statins in clinical practice, the emphasis was first on the potential to lower LDL-C and then to raise HDL-C, with less emphasis on lowering TG levels. However, some scholars pointed out that lower HDL-C levels were not the cause of CVD.[27-29]Consequently, interest in TG has increased and new epidemiological and genetic evidence suggests that elevated levels of TG or TG-rich lipoproteins are increasingly the cause of CVD and all-cause mortality.[30-36]TG metabolites, namely chylomicrons, very low-density lipoproteins, remnant-like particle cholesterol, apolipoprotein C-II, and apolipoprotein C-III, have been shown to be involved in the metabolic process of atherosclerosis.[37]
IR is postulated to be the principal feature of MetS which acts as a precursor to the development of diabetes mellitus,[38,39]CAD,[39]and CVD.[40,41]Elevated TG level is considered as a surrogate marker of IR.[42,43]McLaughlin,et al.[42]suggested that TG,TG/HDL-C, and insulin levels were the most useful metabolic markers in identifying individuals with IR. Excess visceral fat in patients with IR may increase the flow of free fatty acids to the liver, thereby increasing very low-density lipoproteins secretion and leading to hypertriglyceridemia.[37]TG-derived metabolic indicators can also be used as surrogateindices for IR to further improve the prognostic value of isolated TG for MACE in ACS patients.[44]
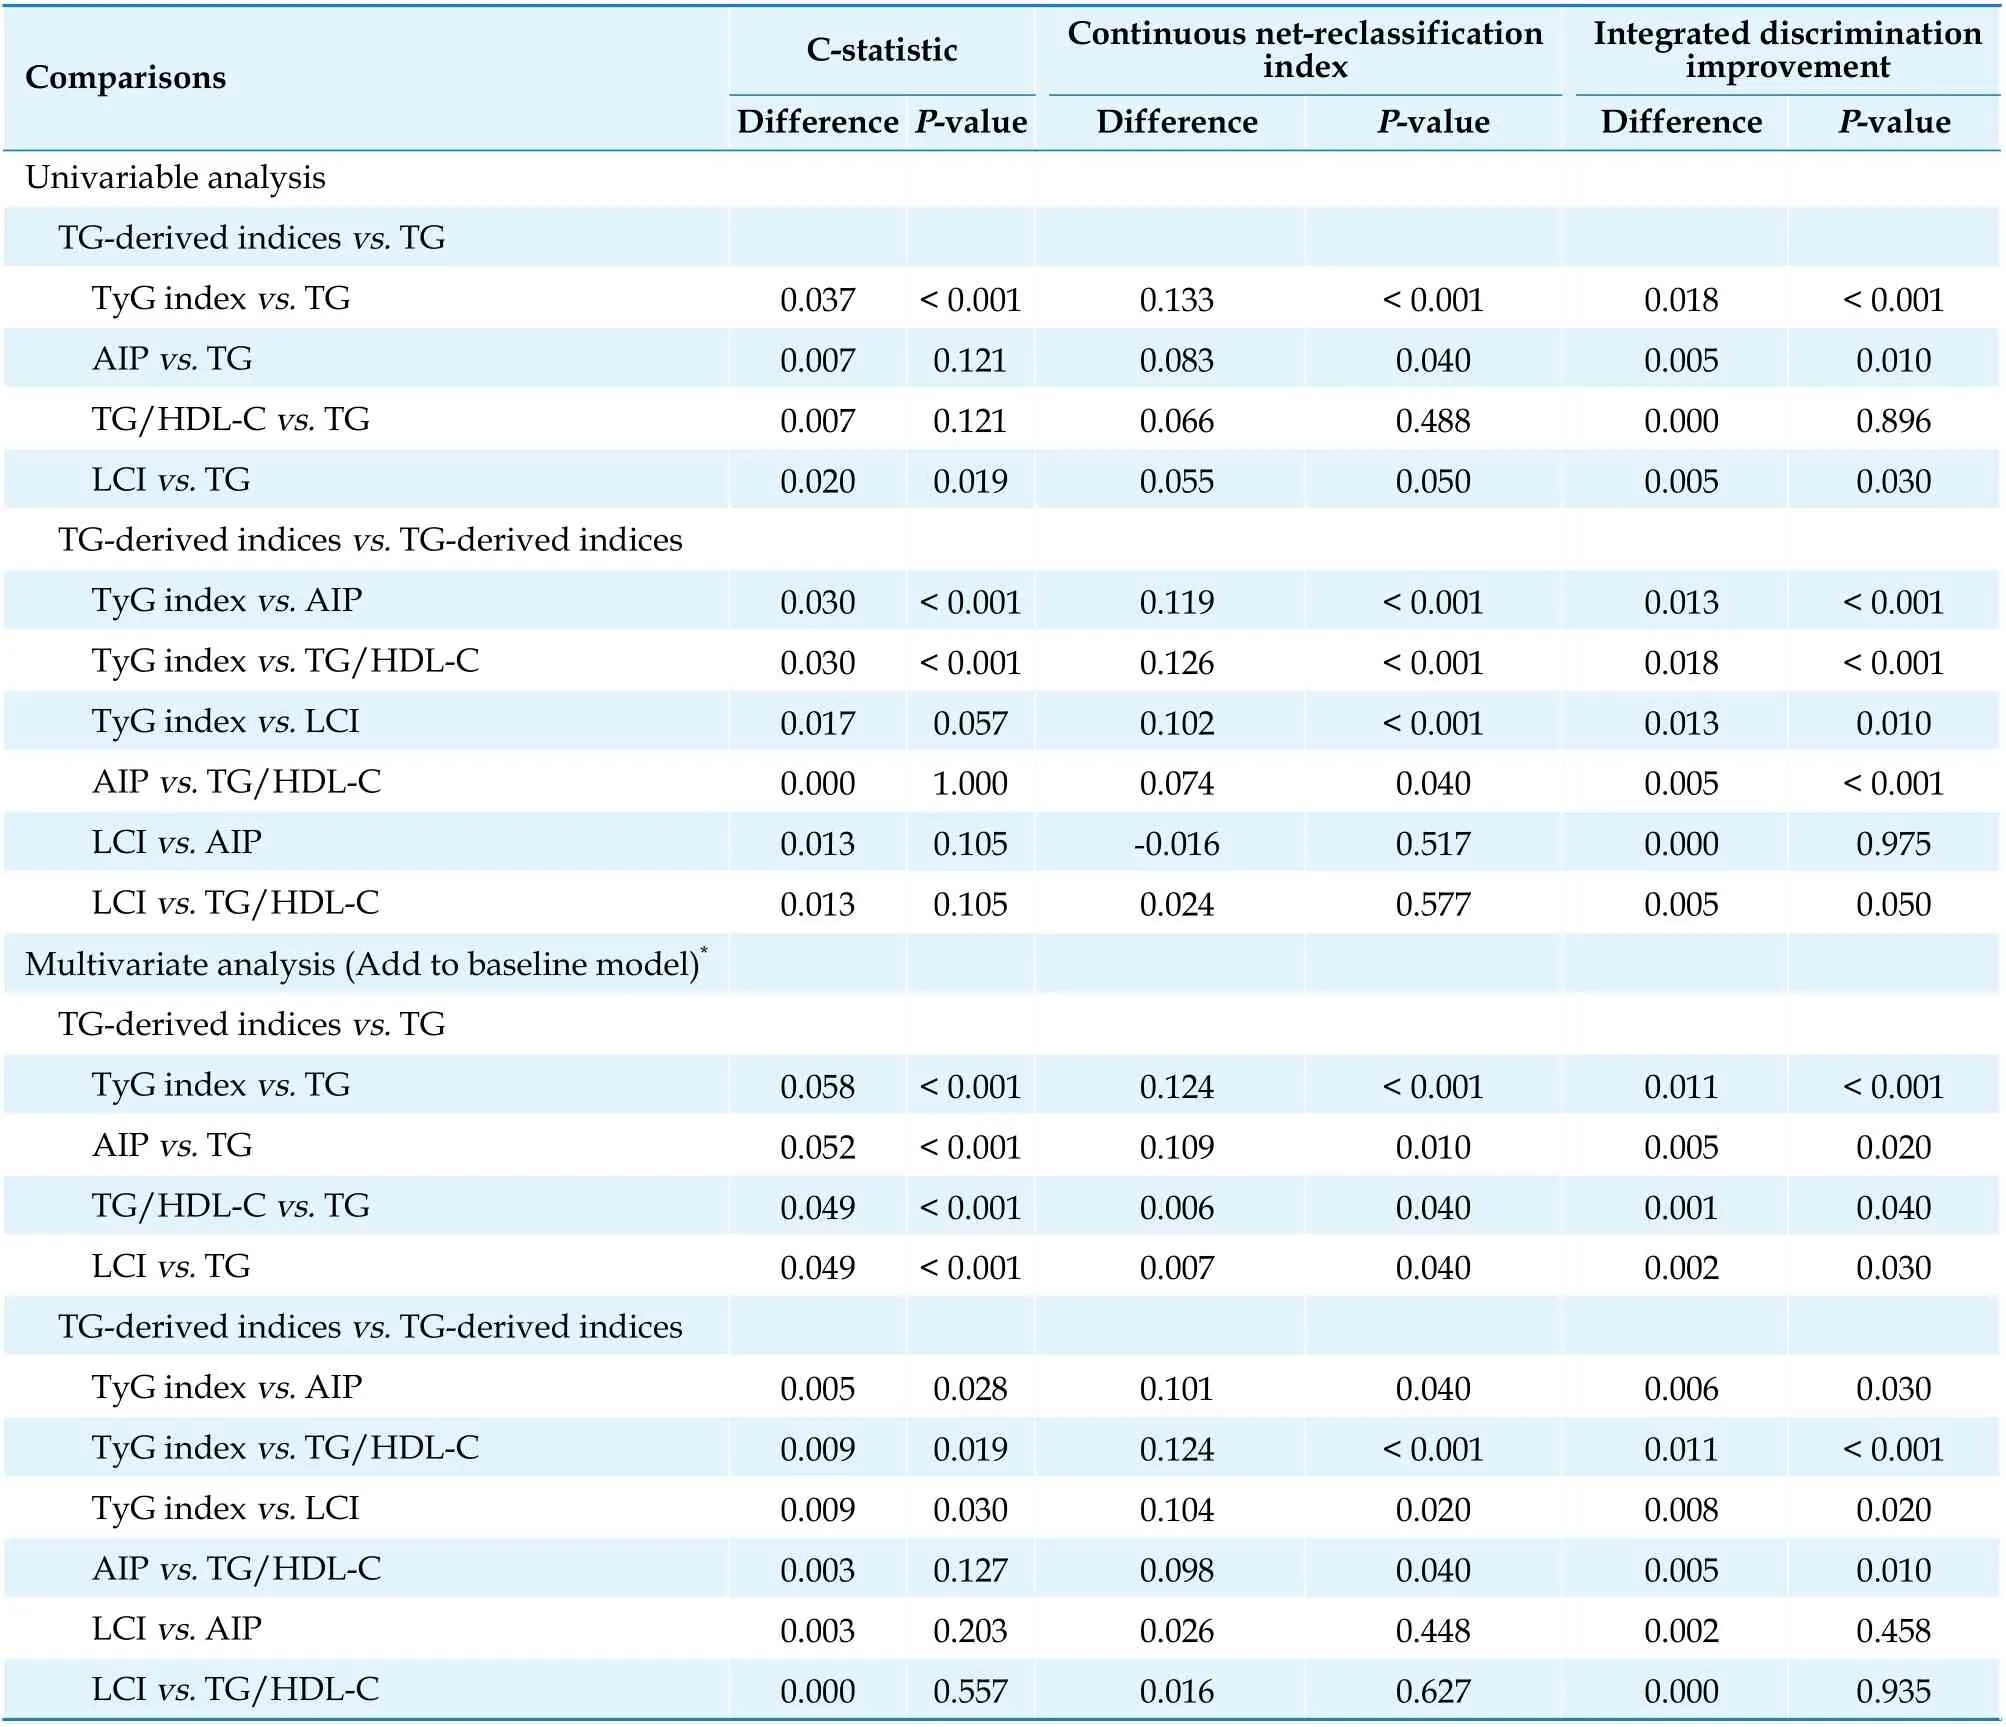
Table 4 Comparative analysis of the discrimination of four TG-derived metabolic indices to predict major adverse cardiovascular events.
High TG level and low HDL-C are characteristic of dyslipidemia in the MetS and are significantly associated with poor prognosis.[45-47]Elevated TG/HDL-C ratio has been shown to be associated with adverse long-term cardiovascular outcomes and allcause mortality in high-risk populations who underwent clinically indicated coronary angiography.[48-50]AIP is a log-transformation of the TG/HDL-C ratio and has been used by Tan,et al.[25]to evaluate changes in atherogenic lipoprotein profiles induced by IR reduction therapy and is superior to TG/HDL-C in describing treatment effects. In the present study,TG-derived metabolic indices were found to have stronger predictive value than isolated TG. Previous case-control and prospective studies also supported that TG/HDL-C ratio associated with a higher incidence of CVD and all-cause mortality with better predictive ability compared to isolated LDL-C or non-HDL-C.[48,51-53]Edwards,et al.[44]also supported that AIP and elevated TG/HDL-C were stronger predictors of mortality than TG, TC, LDL-C and HDL-C alone. A cross-sectional study found that LCI correlated with the atherosclerotic vascular disease better than single lipid parameters.[54]
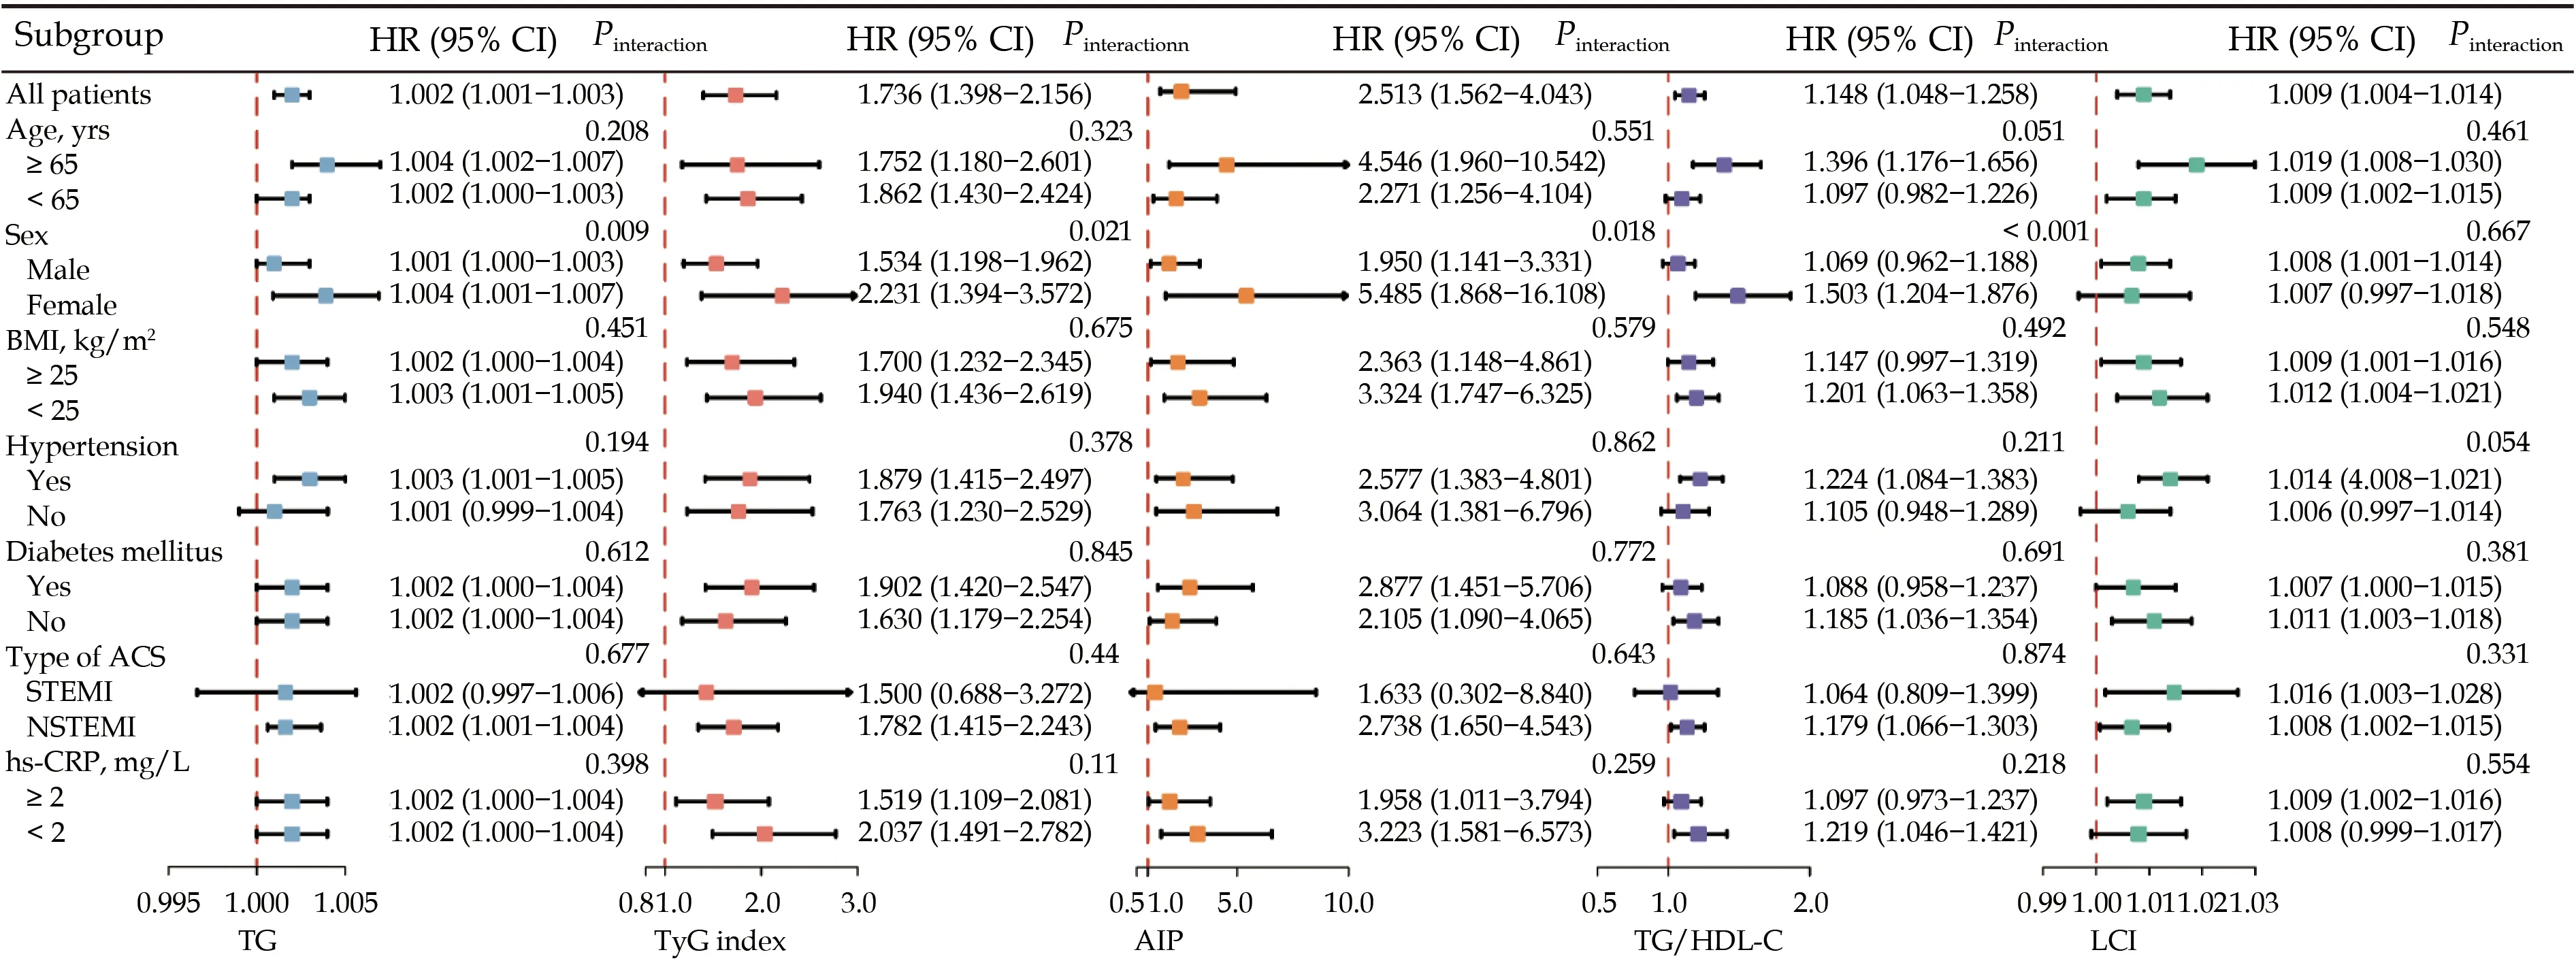
Figure 4 Subgroup analyses of TG-derived metabolic indices. Adjusted for sex, BMI, current smoking, hypertension, diabetes mellitus, dyslipidemia, past myocardial infarction, past percutaneous coronary intervention, chronic kidney disease, admission diagnosis with different types of ACS, GRACE risk score, hs-CRP, SYNTAX score, complete revascularization, and discharged with aspirin, angiotensin converting enzyme inhibitors/angiotensin II receptor blockers and beta-blockers. ACS: acute coronary syndrome; AIP: atherogenic index of plasma; BMI: body mass index; HDL-C: high-density lipoprotein cholesterol; HR: hazard ratio; hs-CRP: high-sensitivity C-reactive protein; LCI: lipoprotein combine index; NSTEMI: non-ST-segment elevation myocardial infarction; STEMI: ST-segment elevation myocardial infarction; TG: triglyceride; TyG: triglyceride-glucose.
TyG index, combining TG with FPG, is an simple and ideal IR surrogates[55]and is positively associated with the development of MetS,[56]diabetes mellitus,[57]coronary artery calcification[16,58,59]or carotid artery calcification,[60]hypertension,[61,62]and obstructive sleep apnea.[63]All of the above factors are considered risk factors for CVD and are closely associated with poor prognosis. Several studies have shown that TyG index is strongly associated with cardiovascular risk in patients with different types of CAD or CVD.[59,64-66]A positive correlation was reported between higher TyG index level and the incidence of MACE in patients with ST-segment elevation MI who underwent PCI,[67]and patients with non-ST-segment elevation ACS.[68]
TG levels in women are significantly influenced by the endogenous hormonal environment and by exogenously administered reproductive hormones.[37]The Framingham Heart Study[69]and the Cardiovascular Study in the Elderly[70]validated HDL-C and TG levels as independent lipid predictors of CVD mortality in women. In our subgroup analysis, the predictive value of TG, TyG index, AIP, and TG/HDL-C for MACE risks were significantly higher in women. Similarly, Stensvold,et al.[71]found that higher TG level was an independent predictor of coronary heart disease mortality in middle aged Norwegian women compared with men. And in female patients undergoing PCI, the TyG index was independently associated with MACE, but not in men.[72]
LIMITATIONS
There are several limitations of this study that should be considered. Firstly, the characteristics of observational study limit the extending of the conclusions. Secondly, although we statistically adjusted for confounders in multivariate Cox regression,such adjustment may not have completely eliminated the confounders. Thirdly, the present results were found in Chinese population and should be discreetly generalizable to other ethnic groups. Last but not least, other metabolic indices derived from TG, such as visceral adiposity index and lipid accumulation products, were not analyzed because waist circumference was not routinely measured in our cardiovascular center.
CONCLUSIONS
TG and TG-derived metabolic indices were strongly associated with the risk of MACE among ACS patients undergoing PCI, and TG may be another pivotal target for optimizing secondary preventive therapeutic regimen in addition to LDL-C. TyG index may play the role of the relatively optimal lipids metabolic indices to predict MACE.
ACKNOWLEDGMENTS
This study was supported by the National Key Research and Development Program of China (2017YFC 0908800), the Beijing Municipal Administration of Hospitals’ Mission Plan (SML20180601), the China Postdoctoral Science Foundation (2021M692253), the Beijing Postdoctoral Research Foundation (2021-ZZ-023), and the Beijing Municipal Health Commission(Jing 19-15). All authors had no conflicts of interest to disclose.
 Journal of Geriatric Cardiology2022年6期
- Journal of Geriatric Cardiology的其它文章
- Transplant-associated thrombotic microangiopathy: a rare but deadly complication post orthotopic heart transplantation
- Establishment of a diagnostic model of coronary heart disease in elderly patients with diabetes mellitus based on machine learning algorithms
- Simultaneous interventional therapy for coarctation of the aorta combined with intracristal ventricular septal defect in older age adult
- Acute myocardial infarction complicated with takotsubo syndrome in an elderly patient: case report and literature review
- Normalizing the dementia status in cardiovascular diseases:a perspective
- Efficacy of comprehensive remote ischemic conditioning in elderly patients with acute ST-segment elevation myocardial infarction underwent primary percutaneous coronary intervention
