The“Bi-drifting”Subpulses of PSR J0815+0939 Observed with the Fivehundred-meter Aperture Spherical Radio Telescope
Lun-Hua Shang,Jun-Tao Bai,Shi-Jun Dang,and Qi-Jun Zhi
1 School of Physics and Electronic Science,Guizhou Normal University,Guiyang 550001,China;lhshang@niaot.ac.cn
2 School of Electronic and Optical Engineering,Nanjing University of Science and Technology,Nanjing 210094,China
3 Guizhou Provincial Key Laboratory of Radio Astronomy and Data Processing,Guizhou Normal University,Guiyang 550001,China
Received 2021 October 24;revised 2021 November 16;accepted 2021 December 10;published 2022 February 2
Abstract We report the“Bi-drifting”subpulses observed in PSR J0815+0939 using the Five-hundred-meter Aperture Spherical radio Telescope(FAST).The observation at band from 1050 to 1450 MHz is evenly divided into two bands,i.e.,the bands at center frequencies of 1150 and 1350 MHz.The mean pulse pro files and the“Bi-drifting”subpulses at these two bands are investigated.It is found that the pulse pro files at these two frequencies show four emission components,and the peak separations between four emission components decrease with the increase of frequency.In addition,the ratio of peak intensity of each component to the intensity of component IV at 1150 MHz is larger than that at 1350 MHz.We carry out an analysis of the longitude-resolved fluctuation spectrum and twodimensional fluctuation spectrum for each emission component,and find that the P3 of components I,II and III is about 10.56,10.57 and 10.59 s at 1150 and 1350 MHz.However,the reliable measurements of P3 of component IV and P2 for these four components were not obtained due to the low signal-to-noise ratio of observation data.The pulse energy distributions at frequencies 1150 and 1350 MHz are presented,and it is found that no nulling phenomenon has been found in this pulsar.With our observation from the FAST,the“Bi-drifting”subpulse phenomenon of PSR J0815+0939 is expanded from 400 to 1350 MHz,which is helpful for the relevant researchers to test and constrain the pulsar emission model,especially the model of“Bi-drifting”subpulse.
Key words:(stars:)pulsars:general–(stars:)pulsars:individual(PSR J0815+0939)–radiation mechanisms:nonthermal
1.Introduction
The pulsar is known for its highly periodic pulse emission.Generally,the single pulses consist of one or more subpulses.Usually,the phase of the subpulse in a periodic radiation window often changes randomly.However,for some pulsars,the phase of subpulse changes regularly,the so-called drifting subpulse.The drifting subpulse phenomenon was first observed by Drake&Craft(1968).Up to now,more than 100 pulsars have been observed to show this phenomenon(Weltevrede et al.2006,2007;Basu et al.2016).The patterns of subpulse drifting are very diverse,and can be roughly classi fied as four groups according to their phase behaviors,i.e.,coherent phasemodulated drifting,switching phase-modulated drifting,diffuse phase-modulated drifting and low-mixed phase-modulated drifting(Basu et al.2019).Sometimes,the phenomena of mode changing and nulling often appear with the appearance of subpulse drifting(Hankins&Wolszczan 1987;Redman et al.2005;Basu&Mitra 2018b).
The subpulse drifting has been a hot research topic with the phenomenon that was observed in more and more pulsars.The drifting subpulse phenomenon has been widely regarded as a powerful tool to probe the inner magnetospheric structure and radiation mechanism of the pulsar(Ruderman &Sutherland 1975;Gil et al.2003,2006;Qiao et al.2004).One of the models to explain the generation of subpulse drifting phenomenon is the inner gap spark model(or carousel model)(Ruderman&Sutherland 1975).This model assumes that in the inner gap acceleration region,there are sparks of localized discharges circulate around the magnetic axis.The subpulses were came from these localized discharge sparks,when the line of sight sweeps through these localized discharge sparks,they will be found.The drifting subpulse phenomenon is caused by the rotation of the spark region around the magnetic axis.Although this model has achieved success in the generation mechanism of drifting subpulse,it is facing more and more observation challenges from the complex phenomenon of subpule drifting,such as the changing drifting rate and direction,complex drifting patterns as well as switching drifting states of subpulse(Rankin et al.2013;Rankin&Rosen 2014;Lu et al.2019a;Zhang et al.2019;Wang et al.2021).Therefore,some alternative models have been developed to explain various special subpulse drifting phenomena(van Horn 1980;Gil&Sendyk 2000;Qiao et al.2004;Gogoberidze et al.2005;Szary&van Leeuwen 2017).
The“bi-drifting”pulsar,PSR J0815+0939,was discovered in the Arecibo drift-scan searches(Champion et al.2005).The main feature of“bi-drifting”phenomenon is that the drift direction is different in different subpulse component.Its integrated pulse pro file contains of four pulse components,the subpulse drifting direction of the two leading components is opposite to that of the two trailing components.For most subpulse-dri fiting pulsars,the subpulse-dri fiting direction for each subpulse is the same.But,to date,there are only three interesting pulsars,including PSR J0815+0939,have been found to exhibit clear“bi-drifting”phenomenon,the other two pulsars are PSRs J1034-3224 and J1842-0359(Basu et al.2019;Szary et al.2020).The“bi-drifting”phenomenon of these pulsars challenges the traditional carousel model.It can be understood by some modi fied models(Szary&van Leeuwen 2017;Wright&Weltevrede 2017).
In this paper,we report the“bi-drifting”subpulse phenomenon of PSR J0815+0939 observed with the Five-hundredmeter Aperture Spherical radio Telescope(FAST)of China.The paper is organized as follows.In Section 2,we introduce theL-band observation of PSR J0815+0939 with the FAST.In Section 3,the properties of subpulse drifting and mean pulse pro files of this pulsar are presented.In Section 4,we present the discussions and conclusions of this paper.
2.Observations
The FAST is a national major scienti fic project built by the Chinese Academy of Science(CAS)operated by the National Astronomical Observatories,CAS.It is located in Guizhou province,China(Nan 2006;Jiang et al.2019,2020;Qian et al.2020).The longitude and latitude of the FAST are 106.9°E 25.7°N,respectively.The aperture of the telescope is 500 m and the effective aperture is 300 m.One of the scienti fic goals of the FAST is to discover more than one thousand pulsars,establish a pulsar timing array,and study the emission physics of pulsars(Li et al.2019;Lu et al.2019a,2019b,2020;Wang et al.2019).We used the 19-beam receiver of FAST to observe the PSR J0815+0939 on 2020 October 8.The 19-beam receiver covers a frequency range of 1050–1450 MHz with a system temperature below 20 K(Jiang et al.2019).During the observations,the signal from the central beam was Nyquist sampled at 8 bit resolution and then a Roach2 board was used to divide the overall band into 4096 channels.In observation,the search model with four polarizations,49.152μs time resolution was used.The data files were recorded in PSRFITS format.We fold the individual pulse from the FITS files using the DSPSR software package(van Straten&Bailes 2011)with the ephemeris provided by PSRCAT.4https://www.atnf.csiro.au/research/pulsar/psrcat/The radio-frequency interference are manually removed using“pazi”of PSRCHIVE software package(Hotan et al.2004).Polarization calibration was achieved by correcting for the differential gain and phase between the receptors through separate measurements using a noise diode signal.Flux across the band is averaged.Finally,the PSRSALSA package was used to carry out fluctuation analysis(Weltevrede 2016).
3.Data Analysis
3.1.The Mean Pulse Pro f i les
The periodPand period derivativeP˙of PSR J0815+0939 are~645.16 ms and 0.139×10⁻¹⁵s s-1,respectively.It is located at the position of RAJ (08:15:08.776)DECJ(+09:39:50.7)in the Sky.The DM is 52.66 cm-3pc,and the flux densityS400=3.7 mJy at center frequency of 400 MHz is very small.The characteristic ageτderived from thePandP˙is 7.35×10⁷yr.The rotation energy loss and surface magnetic field derived from thePandare 2.0×1031erg s-1and 3.3×10¹¹G,respectively.The relatively small rotation energy loss rate and old age place it close to the graveyard region in thediagram(Champion et al.2005).The polarization pro file of PSR J0815+0939 is shown in Figure 1.The overall pulse width is~0.44 spin period,containing of four components.Previous observations show that the separations of the four components are 41,58 and 54 ms at 400 MHz band(Rankin 1983).The separations was measured by using four single Gaussian components to fit the pulse pro files at center frequency 1250 MHz with a bandwidth of 400 MHz(the component fitting method,see citations(Lu et al.2016;Shang et al.2017,2021)for details),and find that the separations of the four components are 38.29±0.66 ms,69.88±1.60 ms and 41.16±1.15 ms at the 1250 MHz band,respectively.This is different from that in previous observation of 400 MHz.

Figure 1.Polarization pro file for PSR J0815+0939.In the bottom panel,the black,red and blue lines are the total intensity,linear polarized intensity and circular polarized intensity,respectively.The upper panel shows the position angles and corresponding uncertainties of the linear polarized emission.

Figure 2.The pulse stack of 1825 pulses of PSR J0815+0939 at center frequency 1250 MHz with a bandwidth of 400 MHz is shown in the upper panel.Average pulse pro file is shown in the bottom panel and divided into four components labeled as I,II,III and IV by the five vertical lines.

Figure 3.The pulse stack of 1825 pulses of PSR J0815+0939 at center frequencies of 1150 MHz and 1350 MHz with bandwidth of 200 MHz are shown in the upperleft and-right panels,respectively.The corresponding average pulse pro files are shown in the bottom-left and-right panels,respectively.Each pulse pro file is divided into four components labeled as I,II,III and IV by the five vertical lines.
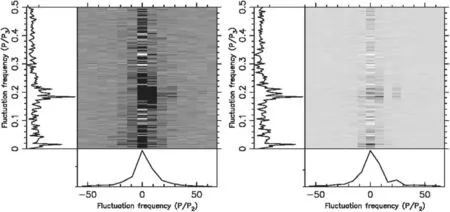
Figure 4.The left and right panels are the 2DFS for components I and II at frequency 1150 MHz,respectively.Each panel has two side panels,the horizontally(left)and vertically(bottom)integrated power show the fluctuation frequencies of P/P3 and P/P2,respectively.Here,P is three times of period of J0815+0939.
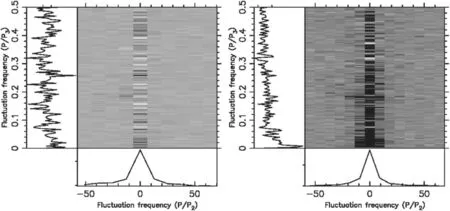
Figure 5.The left and right panels are the 2DFS for components III and IV at frequency 1150 MHz,respectively.See Figure 4 for further details.

Figure 6.As Figure 4,but for frequency 1350 MHz.
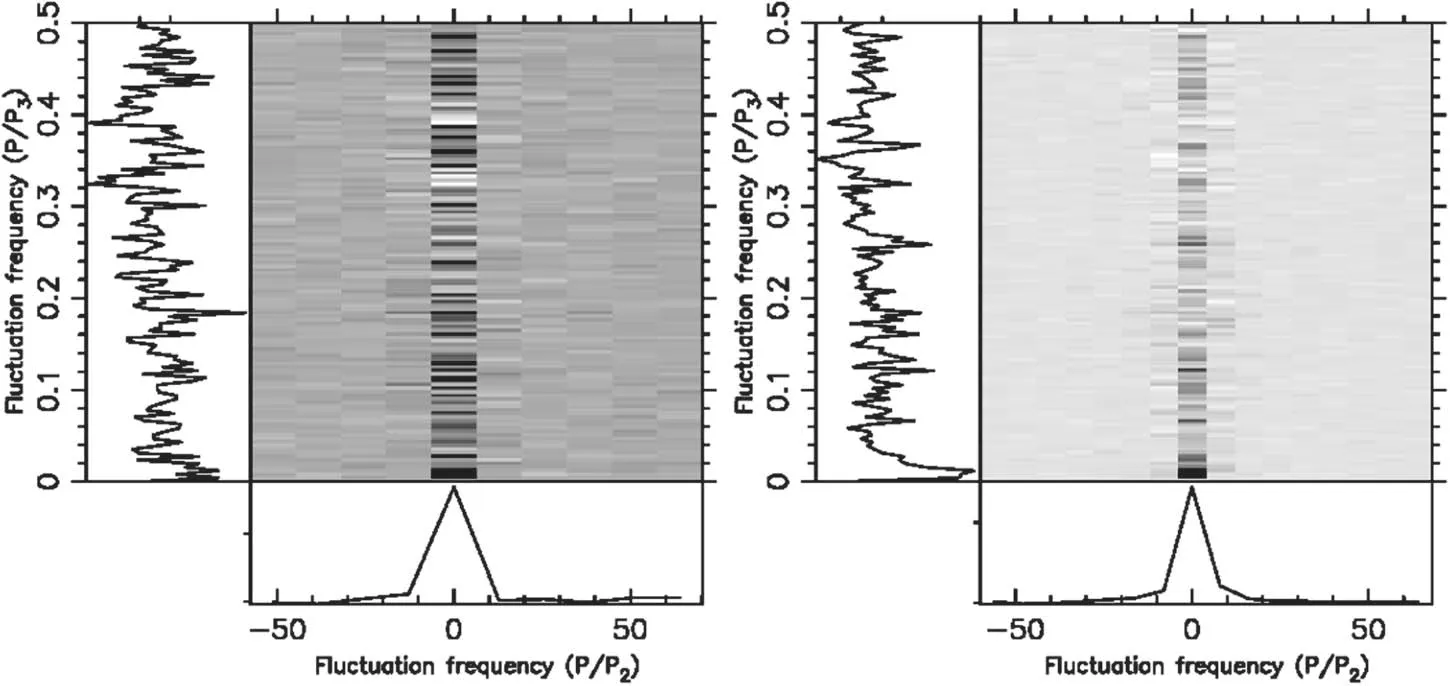
Figure 7.As Figure 5,but for frequency 1350 MHz.
3.2.The Drift Characteristics of Subpulse
The drifting is generally characterized by the drift rate and two drift periods(P2 andP3)(Backer 1973).The drift rate is de fined as the drifted longitude of pulse phase of each subpulse per second.P2 denotes the phase drifting of subpulse in longitude within a phase period.P3 denotes the separation of subpulse reappearance at a given longitude.Champion et al.(2005)measured the drift periodP3 of PSR J0815+0939 with the observations of Arecibo,it was found that theP3 of the four components is~8.72 and~10.87 s at 327 and 430 MHz,respectively.In addition,the drift rates of the four components are different.The drift rates of component II are different from components III and IV at 327 and 430 MHz bands,and they seem to decrease with the increase of frequency.
To investigate the pulse modulation behavior,we used the PSRSALSA package to carry out an analysis of the longituderesolved fluctuation spectrum(LRFS,Backer 1970 and twodimensional fluctuation spectrum(2DFS,Edwards&Stappers 2002)for each of pulse components.The single pulses at center frequency 1250 MHz with a bandwidth of 400 MHz from the observations of FAST 19 beam receiver of PSR J0815+0939 are shown in Figure 2.The detected periodic modulation of subpulse is shown in Figures 4–8 for the data at center frequencies 1150 and 1350 MHz.As the upper panel shown in Figure 2,although the FAST is the most sensitive radio telescope in the world,the drifting phenomenon of PSR J0815+0939 cannot be clearly seen by human eyes due to the weak emission flux of this pulsar atL-band.
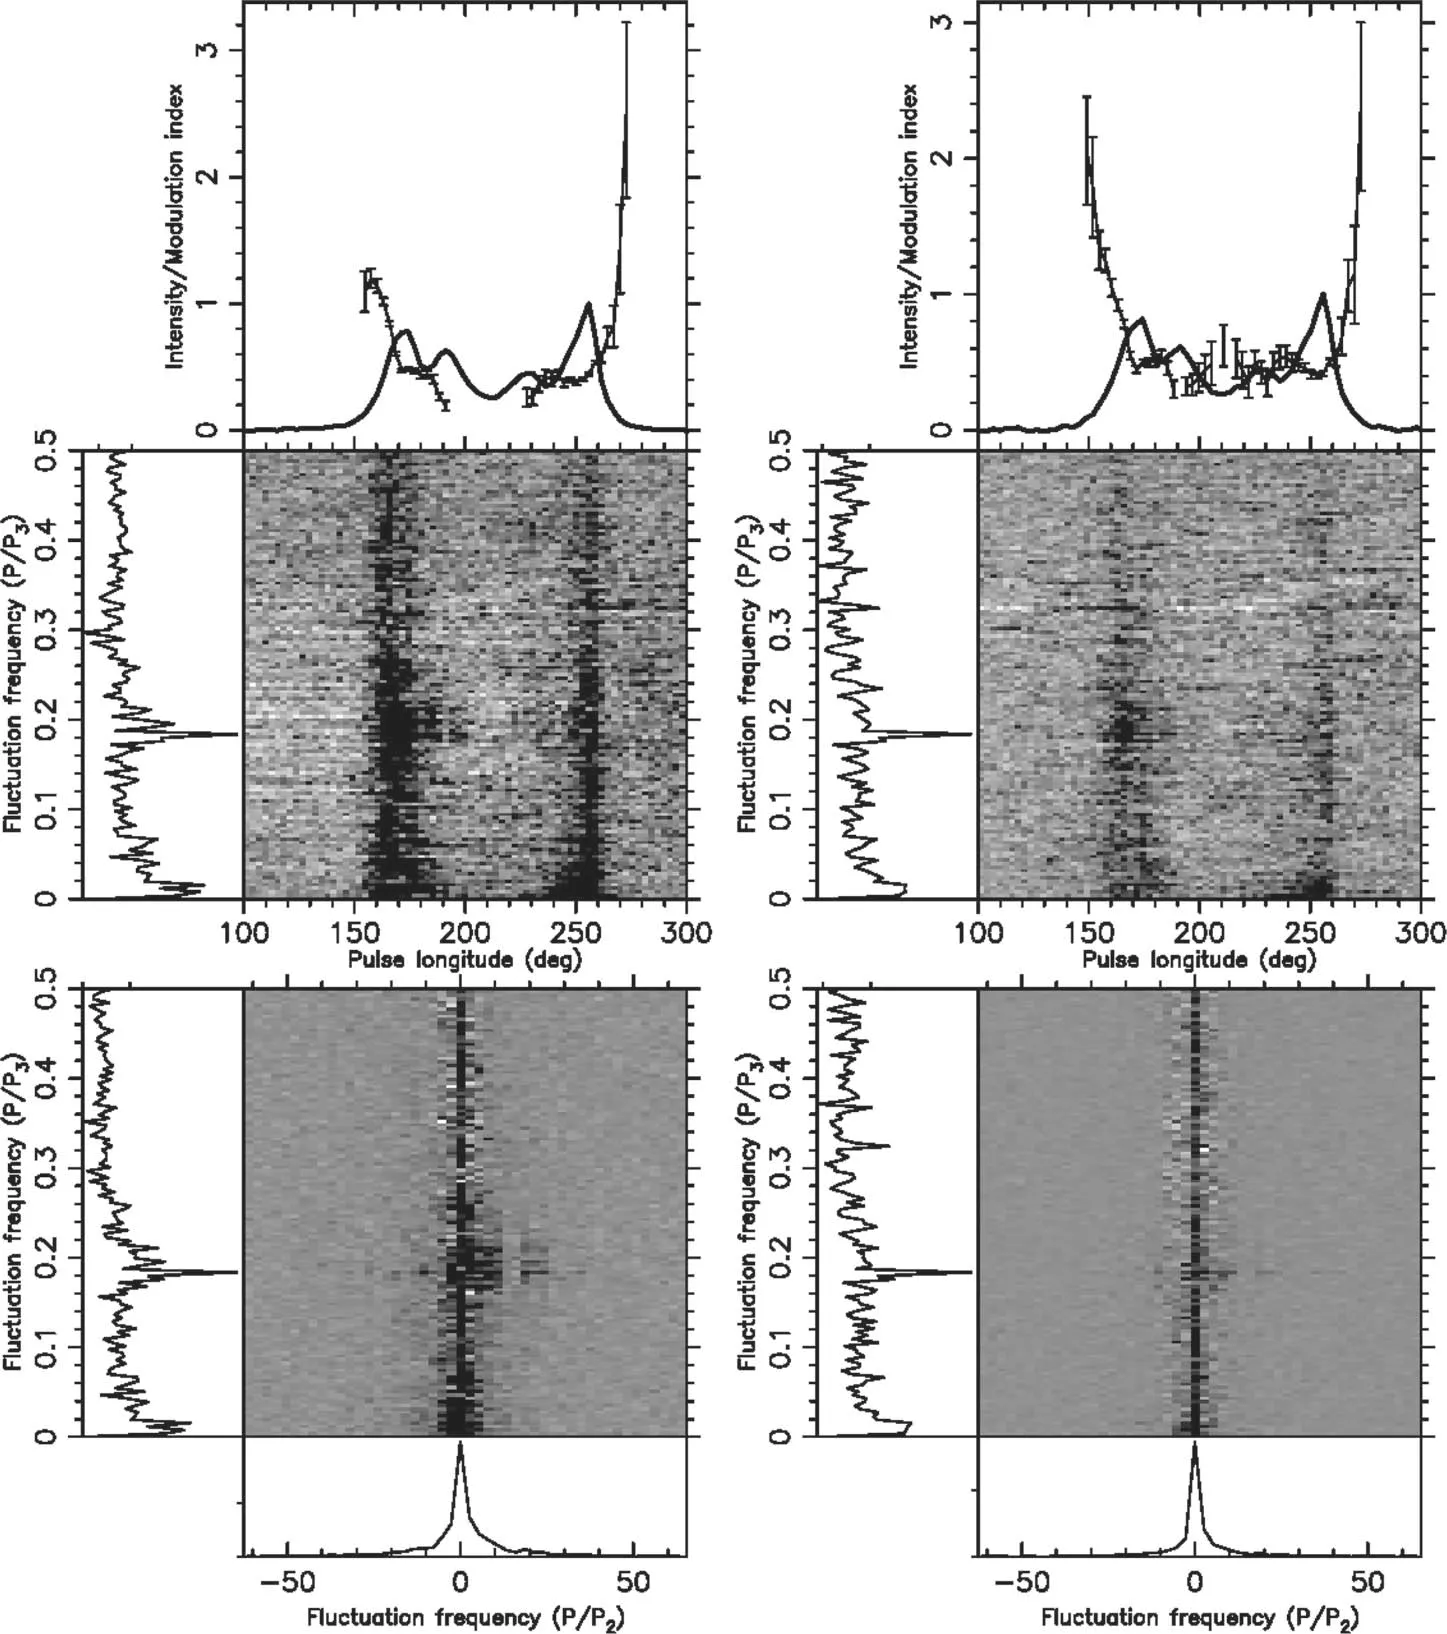
Figure 8.Fluctuation analysis for PSR J0815+0939.The mean pulse pro file(solid line)and longitude-resolved modulation index(points with error bars)are shown in the top panel.The LRFS with a side panel showing the horizontally integrated power is given below this panel.The 2DFS with side panels showing horizontally(left)and vertically(bottom)integrated power is plotted below the LRFS.The left and right columns are the results at frequencies 1150 and 1350 MHz,respectively.
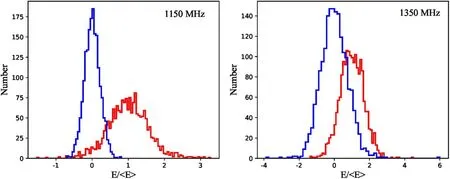
Figure 9.The pulse energy distribution of PSR J0815+0939 at 1150 MHz(the left panel)and 1350 MHz(the right panel).The blue step lines are the distribution of energy at the off-pulse region.The red step lines are the distribution at the on-pulse region.
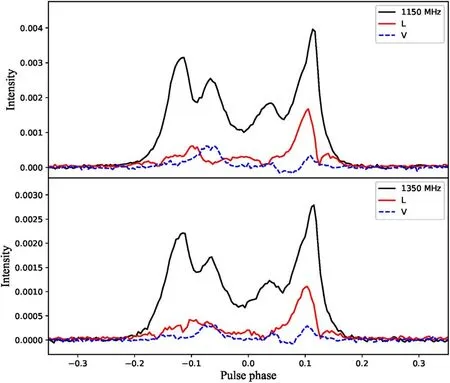
Figure 10.The mean pulse pro files at frequencies 1150 MHz(upper panel)and 1350 MHz(bottom panel).The black and red solid lines are the mean pulse pro files and linear polarizations,respectively.The blue dashed lines are the circular polarizations.
To measure the subpulse drifting of PSR J0815+0939,a phase period is binned into 128 bins and every three consecutive single pulses(the duration of each single pulse is a spin period of PSR J0815+0939)are integrated into a single pulse to make the subpulse reach a higher signal-to-noise rate.Previous measurements at 327 and 430 MHz indicated an evolution of the drift rate with frequency,i.e.,the drift rate decreases with the increase of frequency Champion et al.(2005).To con firm this conclusion,we carry out a splittingfrequency analysis of LRFS and 2DFS for the four components.We split the FAST observation data with a frequency range from 1050 to 1450 MHz into two bands,i.e.,1050–1250 MHz(band1)and 1250–1450 MHz(band2).Then,the drift rate,P2 andP3 of the four components in the pulse pro files at band1 and band2 are measured with the PSRSALSA package,respectively.However,as the flux of PSR J0815+0939 atL-band is too weak to obtain the measurements of the drift rat andP2.Only the measurement ofP3 at band1 and band2 for components I,II and III are obtained,the measurements are listed in Table 1.

Table 1 Parameters Obtained from LRFS and 2DFS Analyses of the Single-pulse Observations of PSR J0815+0939 with the FAST
3.3.The Single Pulse and Mean Pulse Pro f i les
We study the frequency behaviors of radio emission of PSR J0815+0939 by dividing theL-band observation into two bands,i.e.,the bands at center frequencies 1150 and 1350 MHz.Each band have a bandwidth of 200 MHz.The single pulses at these two bands are shown in Figure 3.We present the pulse energy distributions of the off-pulse and on-pulse regions for these two bands shown in Figure 9.It is found that no pulse nulling phenomenon has been discovered in this pulsar,and the energy energy distributions of on-pulse region at 1150 and 1350 MHz are basically similar.The mean pulse pro files at frequencies 1150 and 1350 MHz are shown in Figure 10.We find that the pulse pro files of PSR J0815+0939 not change signi ficantly within 400 MHz atL-band.Previous observation show the pulse pro file of this pulsar consisting of four components with separations of 41,58 and 54 ms at 400 MHz band(Champion et al.2005).We calculated these separations for the pulse pro files at 1150 MHz and 1350 MHz,and find that the separations are 38.04±0.90,68.93±2.3 and 42.18±1.60 ms for the pulse pro files at 1150 MHz,respectively,while the separations are 38.65±0.96,69.35±2.22 and 41.56±1.59 ms for the pulse pro files at 1350 MHz,respectively.
We investigate the change of intensity ratio of peak with frequency.Comparing the pulse pro files at 327 and 430 MHz shown in Figure 6 of Champion et al.(2005),we find that the change of intensity ratio of peak with frequency is irregular.As shown in Figure 6 of Champion et al.(2005),the largest peak is the component IV for the pulse pro file at 430 MHz,while the largest peak is component III for the pulse pro file at 327 MHz.This seems to show that the ratio of peak intensity of each component to the peak intensity of component IV increases with the increase of frequency.However,we calculate peak intensity ratio for the pulse pro files at 1150 MHz and 1350 MHz,and find that the ratios of the peak intensities of components I,II and III to the peak intensity of component IV are about 0.80,0.64 and 0.47 for the pulse pro file at 1150 MHz,respectively.While the ratios are about 0.79,0.62 and 0.44 for the pulse pro file at 1350 MHz,respectively,i.e.,the ratio of peak intensity at lower frequency is larger than that at higher frequency.
4.Discussions and Conclusions
We report here“Bi-drifting”subpulses observed in PSR J0815+0939 using the FAST radio telescope.To investigate the pulse modulation behavior at different frequency.The 1250 MHz observation with a 400 MHz bandwidth from FAST are divided into two-band data,i.e.,bands at center frequencies 1150 and 1350 MHz with a bandwidth of 200 MHz.Then,an analysis of the longitude-resolved fluctuation spectrum and two-dimensional fluctuation spectrum of each sub-pulse components for these two bands are carried out.It is found that theP3 of the four components is 10.5–10.6 s at 1150 and 1350 MHz.This is close to the measurements at 430 MHz given by Champion et al.(2005).The peak separations between the four components are presented,we find that the peak separation decreases with the increase of frequency,which is consistent with the frequency evolution behavior of the pulse pro file of most pulsars,i.e.,the pulse width decreases with the increase of frequency.We measured the ratio of peak intensity of each component to the peak intensity of component IV for the pulse pro files at 1150 and 1350 MHz,and found the ratio at lower frequency is larger than that at higher frequency.Our analysis of pulse energy distribution for the two bands shows that no nulling phenomenon was found in this pulsar.
The first observation for this pulsar was from the Arecibo telescope at 327 and 430 MHz,and this was the first time to show the“Bi-drifting”subpulse phenomenon(Champion et al.2005).Although FAST is the largest and most sensitive radio telescope in the world,it is also very dif ficult to obtain a clear image of“Bi-drifting”subpulse with the observation of FAST.Therefore,with the FAST observation,we expand the emission modulation phenomenon of PSR J0815+0939 from 400 to 1350 MHz.However,as the observed signal is so weak that onlyP3 of components I,II and III are presented.By combining the observed results given in the previous works with the results of this paper,it is helpful for the relevant researchers to test and constrain the pulsar emission model and give a more perfect model.
Acknowledgments
The Five-hundred-meter Aperture Spherical radio Telescope(FAST)is a National Major Scienti fic Project built by the Chinese Academy of Sciences.Funding for the project has been provided by the National Development and Reform Commission.FAST is operated and managed by the National Astronomical Observatories,Chinese Academy of Sciences.This work made use of the data from the FAST.This work is supported by the National Key R&D Program of China(No.2017YFB0503300),and the National Natural Science Foundation(Grant Nos.U1731238,61875087,U1831120,U1838106,61803373,11303069,11373011 and 11873080),the Foundation of Science and Technology of Guizhou Province(Nos.[2016]4008,[2017]5726-37 and[2018]5769-02),the Foundation of Guizhou Provincial Education Department(No.KY(2020)003).
 Research in Astronomy and Astrophysics2022年2期
- Research in Astronomy and Astrophysics的其它文章
- A Study of Magnetized White Dwarf+Helium Star Binary Evolution to Type Ia Supernovae
- Development of Pulsar Digital Backend Based on RFSoC
- Ensemble Numerical Simulations of Realistic SEP Events and the Inspiration for Space Weather Awareness
- Identi fications of RR Lyrae Stars and Quasars from the Simulated Data of Mephisto-W Survey
- Studies on the Equatorial Spot of G-type Contact Binary UV Lyn
- Measuring Microlensing Parallax via Simultaneous Observations from Chinese Space Station Telescope and Roman Telescope
