Measuring Microlensing Parallax via Simultaneous Observations from Chinese Space Station Telescope and Roman Telescope
Shi Yan(顏實(shí)) and Wei Zhu(祝偉)
1 Department of Astronomy,Tsinghua University,Beijing 100084,China;weizhu@tsinghua.edu.cn
2 School of Physics,Nankai University,Tianjin 300071,China
3 Canadian Institute for Theoretical Astrophysics,University of Toronto,Toronto,ON M5S 3H8,Canada
Received 2021 August 19;revised 2021 October 28;accepted 2021 November 22;published 2022 February 2
Abstract Simultaneous observations from two spatially well-separated telescopes can lead to measurements of the microlensing parallax parameter,an important quantity toward the determinations of the lens mass.The separation between Earth and Sun–Earth L2 point,~0.01 au,is ideal for parallax measurements of short and ultra-short(~1 hr to 10 days)microlensing events,which are candidates of free-floating planet(FFP)events.In this work,we study the potential of doing so in the context of two proposed space-based missions,the Chinese Space Station Telescope(CSST)in a low-Earth orbit(LEO)and the Nancy Grace Roman Space Telescope(Roman)at L2.We show that joint observations of the two can directly measure the microlensing parallax of nearly all FFP events with timescales t E?10 days as well as planetary(and stellar binary)events that show caustic crossing features.The potential of using CSST alone in measuring microlensing parallax is also discussed.
Key words:gravitational lensing:micro–stars:fundamental parameters–methods:miscellaneous
1.Introduction
Gravitational microlensing is powerful in detecting cold planets,including those beyond the snow line and those that are unbound to any star(e.g.,Mao&Paczynski 1991;Gould&Loeb 1992;Sumi et al.2011).Statistical studies have found that cold planets are abundant(Gould et al.2010;Suzuki et al.2016),and that unbound planets may be as common as main-sequence stars in the Galaxy(Mróz et al.2017,2019).Observational constraints on unbound planets,or free-floating planets(FFPs),can provide important constraints on the formation and evolution of planetary systems(see Zhu&Dong 2021 for a recent review).
The standard microlensing technique usually does not yield measurements of the lens mass.This is because the microlensing timescale,tE,involves multiple physical parameters

Hereμrelis the relative proper motion between the lens and the source,andθEis the angular Einstein radius

whereκ≡ 4G(c2a u)-1≈ 8.14 masis a constant,MLis the mass of the lens andis the lens–source relative parallax,withDLandDSthe distances to the lens and the source,respectively(Gould 2000).
The lens mass can be measured or directly constrained if two of the three physical quantities—angular Einstein radius,microlensing parallax and lens flux—are measured(e.g.,Yee 2015).Microlensing parallax is the lens–source relative parallax scaled by the angular Einstein radius(Gould 1992)

For faint microlenses such as FFPs,the only way to directly measure the mass is therefore the combination ofθEandπE.The microlensing parallax is of particular importance,as it alone can already yield strong constraints on the lens mass under general assumptions of the lens kinematics(Han&Gould 1995;Zhu et al.2017a).
Many methods have been proposed to measure the microlensing parallax in general microlensing events(e.g.,Gould 1992,1994a;see a brief summary in Zhu et al.2015).In the context of FFP events,the ideal way is to obtain observations from two observatories that are separated by a large fraction of the projected Einstein radius

Here the normalization has been chosen for an Earth-mass object at a typical microlensing distance(DL≈4 kpc).A combination of telescopes at Earth and the Sun–Earth L2 point,with a maximum projected separation of 0.01 au,is therefore ideal for the detection of microlensing parallax for free-floating planetary-mass objects.
Studies have looked into the feasibility of measuring microlensing parallax from Earth and L2.The Roman Space Telescope,previously known as WFIRST,is going to conduct multiple microlensing campaigns from L2(Spergel et al.2015).With a 2.4 m aperture and 0.3 deg2field of view,Roman is expected to detect over one thousand bound planets and hundreds of FFPs out of its 5×72 day microlensing campaigns(Penny et al.2019;Johnson et al.2020).The potential of utilizing a Roman-like telescope for microlensing parallax observations has long been realized(e.g.,Gould et al.2003;Han et al.2004;Yee 2013;Gould et al.2021).In particular,Zhu&Gould(2016)and Street et al.(2018)studied the use of ground-based telescopes,either the Korea Microlensing Telescope Network(KMTNet,Kim et al.2016)or the Rubin Observatory(previously known as LSST)to augment the microlensing parallax measurements of Roman.See also Bachelet&Penny(2019)and Ban(2020)for the feasibility of using two L2 satellites(i.e.,Euclid and Roman)to determine microlensing parallax parameters.
The Chinese Space Station Telescope(CSST)is a planned mission currently scheduled to launch in late 2023 and start scienti fic observations in 2024(Zhan 2011,2018;Cao et al.2018).CSST has an aperture of 2 m and a field of view of 1.1 deg2,and it will be in a~400 km low-Earth orbit(LEO)with an orbital period around 95 minutes.The primary science goal of CSST is to understand the nature of dark matter and dark energy using a number of cosmological probes,such as galaxy clusterings as well as weak and strong gravitational lensings(e.g.,Gong et al.2019;Zhang et al.2019).The high resolution and large field of view of CSST make it also a wonderful mission to conduct space-based microlensing surveys(Gould 2009).Similar to those by Euclid and Roman(Penny et al.2013,2019;Johnson et al.2020),the microlensing survey by CSST will have sensitivity to low-mass planets on both wide and unbound orbits.
This paper discusses the potential of measuring microlensing parallax by CSST alone and by combining CSST in LEO and a Roman-like telescope at L2.We show in Section 2 that such a joint program can measure microlensing parallax for the majority of short(and ultra-short)timescale microlensing events.Section 3 explains the potential of CSST and Roman in measuring parallax and thus presents a full lens solution of caustic-crossing binaries(including planetary events).A brief discussion is given in Section 4.
2.Measuring the Microlensing Parallax of Single-lens Events
The microlensing light curve arising from a point source and a single lens is given by Paczynski(1986)

HereFSis the source flux at baseline,Fbaseis the total flux(source and possible blend)at baseline,anduis the distance between the source and the lens at a given timetnormalized to the Einstein radius.Because of the microlensing parallax effect,telescopes at different locations(namely L2 and LEO)see different values ofu

Heret0is the peak time andtEis the event timescale.We use the effective timescaleteff≡u0tErather than the impact parameteru0in describing the event evolution,becauseteffis almost always better constrained in observations than isu0.
The microlensing parallax measured from two well separated observatories can be approximated as (Refsdal 1966;Gould 1994a)

whereπE‖andπE⊥are the components parallel and perpendicular to the source trajectory,respectively.HereD⊥is the projected separation between the two observatories,tEis the event timescale, and Δt0≡t0,LEO-t0,L2and Δu0≡u0,LEO-u0,L2are the differences in peak times and impact parameters as seen from two observatories,respectively.
By writing the parallax vector in the form of Equation(7)we have assumed that(a)the event timescaletEis(effectively)the same at two locations and that(b)bothtEand the projected separationD⊥are invariant in the process of the event.The latter is a reasonable assumption for short(less than a few days)timescale events,which are the focus of this section.Regarding the former,the difference intEarises from the relative motion between the two telescopes,which we separate into two parts.The relative motion between Roman and Earth(<1 km s-1)is very small compared to the lens-source projected motion,which is typically200 km s-1(see Appendix B of Zhu&Gould(2016)).The relative motion between CSST and Earth varies within an orbital period of CSST(T≈90 min)and caps at~8 km s-1.For events withtE?T,the time-averaged relative velocity is negligible compared to the transverse velocityv?hel.For events withtEcomparable toT,the relative motion between CSST and Earth is in fact useful in further breaking the standard four-fold degeneracy in two-location observations(Refsdal 1966;Gould 1994a;Zhu et al.2017b),as in such cases CSST can be effectively treated as more than one static telescope.We will further discuss the use of this effect in Section 2.2.
WhileπEis an important quantity that is frequently used in the literature,a better parameter that is more directly constrained in observations and better connected to the lens kinematics is(Dong et al.2007;Zhu&Gould 2016)

We therefore rely on this parameter to quantify the detectability of the microlensing parallax effect in such an LEO+L2 con figuration.
We utilize Fisher matrix analysis to evaluate the detectability of the parallax effect.For the Roman survey,we use 15 minute cadence and the expected photometric performance out of the 53 s exposure from Penny et al.(2019).For the CSST survey,we assume a duty cycle of 40%and 8 observations per orbit(corresponding to ~5 minute cadence).The photometric performance of the CSST microlensing survey is derived from the online CSST ETC simulator.4http://etc.csst-sc.cn/ETC-nao/etc.jspWe have assumed high zodiacal light and average Earth shine light for the background contamination and an extinction law ofE(B-V)=0.94.A typical M0V star in the bulge is chosen as the microlensing source.With an exposure time of 60 s and a systematic floor of 0.001 mag,we can then simulate the noise curve of the CSST microlensing survey.The result is plotted in Figure 1 together with the noise curve of Roman from Penny et al.(2019).

Figure 1.The expected noise curves of the CSST and Roman microlensing surveys.The dashed curve signi fies our analytical approximation of the Roman noise curve,which is used in Appendix to derive the scaling relations.

Figure 2.Example light curves of typical disk and bulge events with a timescale t E=0.1 days.The blue curve shows the light curve seen by CSST at LEO,for which we have set the impact parameter u0,LEO=0.1 and a source baseline flux F S,LEO=1(corresponding to 21 mag).The orange and green curves are what Roman would see.We have adoptedπrel=0.12 mas and μrel=7 mas yr-1 for the disk event,andπrel=0.02 mas andμrel=4 mas yr-1 for the bulge event.
The parameters used to model the combined data set are


HereFS,LEOis the source flux at baseline in the bandpass of CSST at LEO,and we renormalize the flux values such thatFS,LEO=1 corresponds to a 21 magnitude star.For the other observatory,we rely on the parametercto quantify the ratio of source fluxes in the bandpasses of the two telescopes and it is related to the observed color of the sourcemLEO-mL2We do not specify the bandpasses of the two space-based surveys,although for practical reasons we will useH-andIband for observations from L2 and LEO,respectively.Considering the stellar colors from Pecaut& Mamajek(2013)and assuming an extinction ofAI=1.5 andE(I-H)≈1(Gonzalez et al.2012;Nataf et al.2013),one finds that a Sun-like star in the bulge will havemLEO≈20,mLEO-mL2≈1.8 andc≈5.2.Early M-dwarfs,which will probably be the primary sources of the events simultaneously observed by CSST and Roman,will havemLEO≈23,mLEO-mL2≈2.7 and thusc≈12.
Throughout this paper we consider two types of microlensing events:a typical disk event with lens-source relative parallaxπrel=0.12 mas(corresponding to a lens at≈4 kpc)and a relative proper motionμrel=7 mas yr-1;and a typical bulge event withπrel=0.02 mas(corresponding to a lens at≈7 kpc)andμrel=4 mas yr-1.These yield typical transverse velocities(Zhu&Gould 2016)

Figure 2 features example light curves of typical disk and bulge microlensing events withtE=0.1 d,u0,LEO=0.1 and a source baseline fluxFS,LEO=1(corresponding to a baseline magnitude of 21).
The Fisher matrix Fijis then de fined by

Here{tl}and{tm}are the time series of the Roman telescope and CSST,respectively,andσFrepresents the uncertainty of the measured flux.We then compute the covariance matrix of the vectorΛ,ΣΛ,based on the relation betweenΛand the direct observables(Equation(8)).The detectability of the parallax effect is quanti fied by

where0denotes the zero-parallax case.
For any chosen set of microlensing parameters we apply the above Fisher matrix analysis to numerically evaluate the detectability of the parallax effect.One example output is featured in Figure 3,for which we have assumed a maximum projected separation between LEO and L2D⊥=0.01 au.
To gain theoretical insights,we also derive the following analytical scaling relation in the high-magni fication(u0→0)regime(see Appendix for the detailed derivation)

Heref(c) ≡χ2L(c)χ2L(c=1)captures the dependence ofon the color parametercand is normalized by the value ofatc=1(see Figure 4).As af firmed in Figure 3,the above scaling relation matches the numerical results reasonably well and breaks down at both large(u0?1)and smallu0values(u0?0.01).The former is due to the breakdown of the highmagni fication regime.The latter is due to the fact that we have assumedu0,LEO=u0,L2in the analytical derivation.According to Equation(7),Δu0=πE,⊥D⊥.For typical disk and bulge events,Δu0≈0.01 and 0.001,respectively,and thusu0,L2=u0,LEO+Δu0→u0,LEOas long asu0,LEO?0.01.Additionally,the above scaling typically breaks down attE?0.1 days when the event timescale is comparable to the orbital period of an LEO satellite around Earth.
With Equation(14)and the numerical results from Figure 3,we can rewrite the detection signi ficance of the parallax effect inas the following expressions
The above expressions can be readily used to evaluate the detectability of the parallax effect in any given single-lens event.Speci fically,with the maximum projected separation ofD⊥=0.01 au between Earth and L2,the combination of CSST and Roman should be able to detect the microlensing parallax effect for typical bulge(disk)events with 0.1?tE/days?10(0.1?tE/days?80),if the source is 23 mag at baseline and the impact parameter is~0.3.These values enclose the bulk of the expected FFPs from Roman,especially those with lowmass(and thus preferentially terrestrial)lenses(e.g.,Johnson et al.2020).
2.1.Lens Mass Determinations
Besides the microlensing parallax,another critical parameter toward a lens mass measurement is the angular Einstein radius θE,which is usually determined from the finite-source effect(Yoo et al.2004).For single-lens events,the finite-source effect becomes prominent when the impact parameteru0becomes comparable to or less than the scaled source sizeρ.The fraction of microlensing events with complete lens mass measurements out of all events with parallax detections can be estimated as

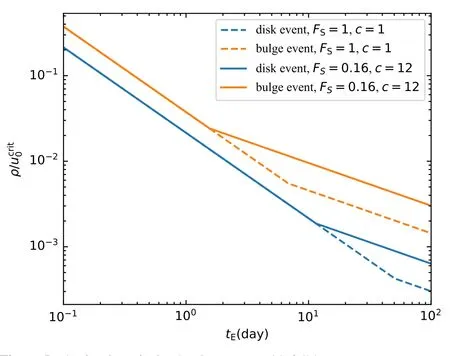
Hereθ★=0.3μas is the typical value for the source angular size,which corresponds to an early M dwarf with a radius of 0.5R⊙in the Galactic Bulge.The quantityis the critical impact parameter above which the parallax effect is no longer detectable.For given source and lens properties,it can be derived from the scaling relations in Equation(15)with a certainthreshold for the parallax detection.We use athreshold of 10 and set an upper limit onat 0.7.The latter takes into account the fact that the scaling relations are no longer valid approximations whenu0approaches unity.
Figure 5 shows the estimated fraction of events with complete mass measurements out of those with parallax detections.Here we have included the results with typical sources(FS=0.16 andc=12,corresponding tomLEO≈23 andmLEO-mL2≈2.7)in addition to the results with the defaultFS=1 andc=1 combination.For events with timescales in the range of 0.1–10 days,for which the joint observations of CSST and Roman are most valuable,?0.3%(?2%)of disk(bulge)events with typical sources and parallax detections should have complete lens mass determinations.Up to~40%of ultra-short-timescale events will show the finitesource effect and thus have complete lens mass determinations.This fraction is largely independent of the source properties.

Figure 3.The detection signi ficance of the parallax effect as functions of various parameters.From top to bottom,they are source baseline flux F S,LEO,impact parameter u0,LEO and event timescale t E,respectively.Panels on the left show theχ2 signi ficance between models with and without the parallax effect,whereas panels on the right display the uncertainties of the kinematic parallax parametersΛ⊥andΛ‖.In each panel,the solid curve assumes typical disk lenses(withπrel=0.125 mas,μrel=7 mas yr-1 and thusΛ=6.52),and the dashed curve assumes typical bulge lenses(withπrel=0.018 mas,μrel=4 mas yr-1 and thusΛ=1.63).In the left panels,the gray horizontal lines representχ2=10,above which the parallax effect is considered to be detected.In the right panels,the gray horizontal lines signify the values ofΛ.Our default parameters are F S,LEO=1,u0,LEO=0.3,t E=10 days and color parameter c=1.


Figure 4.The dependence of the parallax detectability on the color parameter c(de fined by Equation(10)).The y-axis shows the relative enhancement in the parallax detectability,quanti fied byχΛ2,of a source with a color parameter c compared to the case with c=1.
For events that do not show the finite-source effect,the lens mass can be inferred from the microlensing parallax alone(Han&Gould 1995).Such mass inferences are statistically accurate at the~30%level for typical disk events(e.g.,Yee 2015;Zhu et al.2017a),whereas the uncertainty increases to?40%for bulge events(Gould et al.2021).Such statistically inferred lens properties are also valuable in constraining the mass distribution of isolated microlenses,especially those with low probabilities of showing the finite-source effect.
2.2.CSST Alone
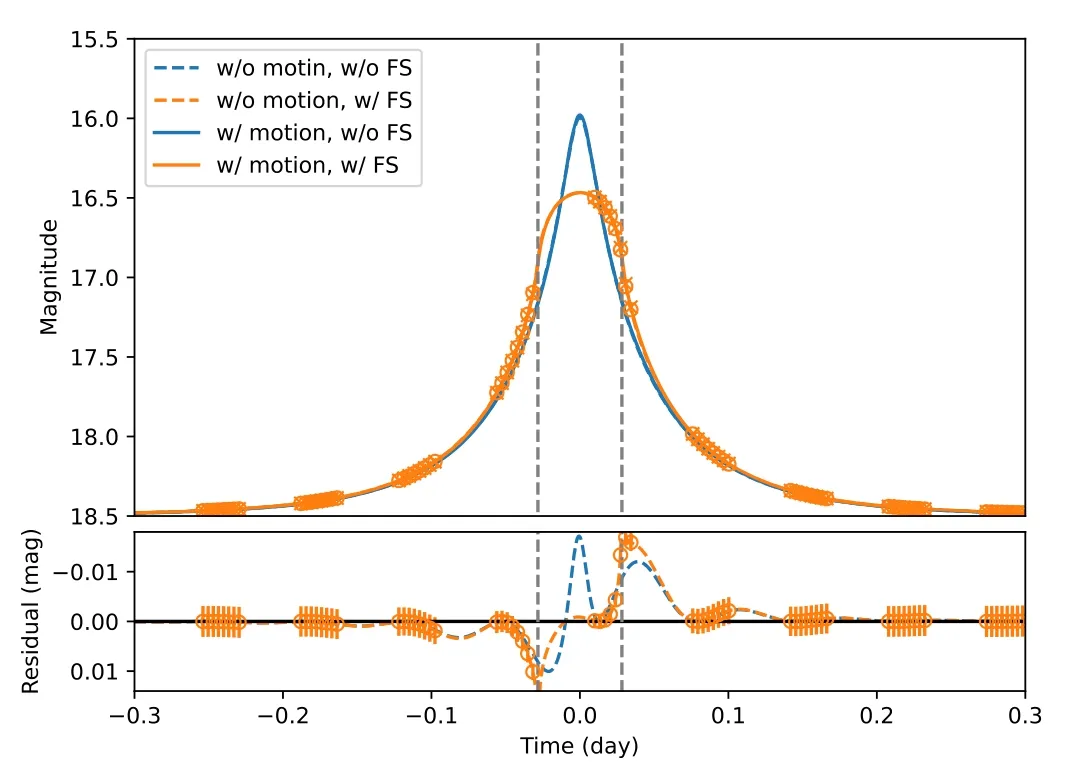
The orbital motion of CSST around Earth will be useful in further resolving the four-fold degeneracy in the single-lens case(Refsdal 1966;Gould 1994a;Zhu et al.2017b)as well as detecting the parallax effect by CSST alone.An example light curve to demonstrate the use of the orbital motion effect of CSST is displayed in Figure 6.
For simplicity,we will treat the orbital motion effect of CSST as if two satellites were simultaneously observing with a separation of an Earth diameter(i.e.,R⊥=2R⊕).With this approximation,the result from the CSST+Roman analysis(Equation(15))is directly applicable

Note that these scaling relations do not take into account the finite-source effect.The point-source example featured in Figure 6 haswhich for the chosen parameters is a factor of~2 smaller than what the above scaling relation yields.This difference probably comes from the fact that the real orbit of CSST has an effective projected separation smaller than 2R⊕.

Figure 5.The fraction of microlensing events with full lens mass measurement out of all with microlensing parallax effect,quanti fied by the ratio between the scaled source sizeρa(bǔ)nd the critical impact parameter for parallax detectionsSee the main text for more details.Here blue and orange curves correspond to typical disk and bulge events,respectively.The dashed curves are for our default set of source parameters(F S=1,c=1),whereas the solid curves are for more typical microlensing sources from the Roman survey(F S=0.16,c=12).
Ultra-short-timescale events with relatively small impact parameters almost always show the finite-source effect,so it is necessary to take into account the impact of this additional effect on the detectability of the parallax effect.The finitesource effect works in two different ways:on the one hand,it reduces the magni fication when the source–lens relative distanceu?ρ;on the other hand,the finite-source effect increases the magni fication atu~ρ(Gould 1994b,see also Yoo et al.2004;Chung et al.2017).Whether the finite-source magni fication is less or more sensitive to the variation of distanceuthan is the point-source magni fication depends on the ratio betweenuandρ.Consequently,the detectability of the parallax effect can be either enhanced(when there are more data points withu~ρ)or reduced(when there are more data points withu?ρ).For example,the finite-source example displayed in Figure 6 has161,slightly higher than the value of the point-source case.Considering that the source should be relatively bright,here we have assumed a Sun-like star in the bulge as the microlensing source.

Figure 6.An ultra-short-timescale(t E=0.1 days)event arising from a typical disk lens seen by CSST alone.With an impact parameter of u0=0.1,the event with a scaled source sizeρ=0.3 manifests strong finite-source effect(orange curves),where the peak region of the light curve deviates substantially from the point source approximation(blue curves).The dashed vertical lines indicate the locations where the lens–source distance u=ρ.In each set of curves,the solid one implements the orbital motion of CSST,and the resulting light curve appears slightly but statistically signi ficantly different from the dashed curve.Without the finite-source effect,theχ2 difference between the dashed and solid curves is 141.With the finite-source effect,theχ2 difference increases to 169.
A more precise and comprehensive evaluation of the parallax detectability in the case of CSST alone will require additional knowledge like the position of Earth and the inclination of CSST orbit,and thus we do not attempt to derive it in the present work.In short,CSST alone should be able to detect the parallax effect of ultra-short-timescale events which have relatively high magni fications and bright sources(see also Mogavero&Beaulieu 2016).For such events,the joint observations of CSST and Roman can also be used to break the four-fold degeneracy that is common in single-lens microlensing events.
3.Measuring Microlensing Parallax of Causticcrossing Binary Events
For binary and planetary events with caustic-crossing features,which constitute roughly half of all binary and planetary events in such well sampled observing campaigns(Zhu et al.2014),the joint observations of CSST and Roman can also measure the microlensing parallax and thus fully determine the mass and distance of the lens system.The caustic-crossing features are smoothed on the scales of the source size,and thus two observers separated by roughly the(projected)source size should see caustic-crossing features with measurable time offsets.For typical microlensing events in the CSST and Roman campaigns,the source stars are subsolar in size(e.g.,Penny et al.2019),and thus the LEO–L2 separation,~0.01 au=2R⊙,is ideal for the microlensing parallax observations regardless of the event timescale(see also Gould et al.2021).Figure 7 illustrates two example light curves,one of planetary nature with mass ratioq=10-5and the other of binary nature withq=1.In both examples,the caustic-crossing features are signi ficantly offset in the light curves of CSST and Roman.

Figure 7.Typical planetary(upper panels,with mass ratio q=10-5)and binary(lower panels,with q=1)microlensing events with caustic-crossing features seen by CSST in LEO and Roman at L2.The left panels display the expected light curves and the right panels feature the caustic and lens-source relative trajectories.We have assumed a timescale of t E=10 days and scaled source sizeρ=10-3 in both cases.Although the light curves seen by CSST and Roman look overall very similar,the caustic-crossing features show statistically signi ficant differences that can be used to measure the parallax effect.
Besides the LEO–L2 separation,other factors also affect the detectability of the microlensing parallax.The determination of the full two-dimensional microlensing parallax requires that each satellite should capture(at least)two caustic crossing features.Otherwise there will be a continuous degeneracy in the parallax vector(Hardy & Walker 1995;Graff&Gould 2002).This is not rare in reality.For example,some caustic-crossing events have effectively only one causticcrossing feature(e.g.,Shvartzvald et al.2015),or the observations of one or both satellites may fail to capture some of the caustic-crossing features(e.g.,Zhu et al.2015).This latter scenario is probably going to be the dominant factor,as CSST at LEO has a duty cycle of~30%–40%due to(mostly)Earth’s umbra.
Caustic-crossing events may have their parallax further constrained by the orbital motions of CSST or Roman(Honma 1999).Such a complementary constraint will be especially useful for caustic-crossing events with continuous degeneracies.We refer to Zhu&Gould(2016)for more discussion.
4.Discussion
This work studies the potential of simultaneous observations by CSST and Roman in detecting the microlensing parallax effect.We have derived the scaling relations that quantify the detectability of the parallax effect by the two satellites together and by CSST alone.Our calculations con firm that CSST and Roman together can measure the microlensing parallax for short and ultra-short timescale(~0.1–10 days)microlensing events,which roughly correspond to brown dwarf and lowermass lenses.CSST alone has the capability to detect the microlensing parallax for ultra-short timescale events with relatively high magni fications and bright sources.Furthermore,the separation between CSST and Roman is ideal for microlensing parallax measurements of caustic-crossing events.With the angular Einstein ring radius measurements from the caustic-crossing features(Yoo et al.2004),these parallax measurements will lead to direct determinations of the mass and distance of the lens system.
Although the combination of LEO and L2 is not ideal to detect the parallax effect of typical Galactic microlensing events,which usually require a projected separation between observatories of several au(Refsdal 1966;Gould 1994a),it is perhaps the best approach to complete the mass measurements(or inferences)of Galactic microlenses.A space-based telescope with high spatial resolution like CSST and Roman can resolve individual bulge stars and thus constrain the properties of luminous lenses through the lens flux method(e.g.,Bennett et al.2007).The microlensing campaign by CSST or Roman alone can therefore measure/constrain the mass function of(most)stellar lenses.However,as the lens flux method does not work for sub-stellar microlenses such as brown dwarfs and FFPs,the microlensing parallax method becomes the only way to constrain the lens properties.Therefore,a joint program that can detect the parallax effect of short and ultra-short timescale microlensing events can complement the lens mass measurements/constraints of the microlensing campaigns of individual missions.
Finally,it is also worth pointing out that although our results have assumed the con figuration of CSST and Roman,they are generally applicable to any combination of satellites at LEO and L2.
Acknowledgments
We would like to thank the anonymous referee for comments and suggestions that have improved the paper.We acknowledge the science research grants from the China Manned Space Project with No.CMS-CSST-2021-A11.
Appendix Fisher Matrix Analysis:Analytics
The scaling relation (Equation (15))can be derived analytically in the high-magni fication regime,where the light curve can be modeled with only three parameters(t0,teff,Fpeak)(Gould 1996)

HereFpeak=FS/u0is the source flux at event peak and τeff≡(t-t0)/teff.The joint data set of LEO and L2 can then be modeled with the parameter set

and the corresponding derivatives are

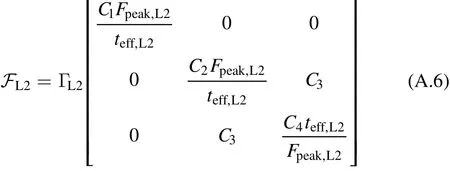
The Fisher matrix in Equation(12)can then be written as

where FL2and FLeoare both 3×3 matrices.
Penny et al.(2019)performed numerical simulations for the Roman microlensing campaign and found that most of the Roman microlensing events,especially those with planetary signals,should haveH?23,for which the photometric noises are dominated by the source flux(roughly 16–23 mag;see the dashed curve in Figure 1).We can therefore assume that the magnitude uncertaintyσm∝F-1/2.The Fisher matrix given in Equation(A.5)is then integrable,with

and

HereΓL2andΓLEOare the observation cadences at L2 and LEO,respectively,andCk(k=1,2,3,4,5,6,7,8)are constants that do not depend on the lensing parameters.Then the covariance matrix Cijcan be given by

with

The covariance matrix of the vectorΛcan be expressed as

and

Here we have assumed thatu0,L2≈u0,LEO.With the de finition ofχ2given by Equation(13),we thus have

 Research in Astronomy and Astrophysics2022年2期
- Research in Astronomy and Astrophysics的其它文章
- A Study of Magnetized White Dwarf+Helium Star Binary Evolution to Type Ia Supernovae
- Development of Pulsar Digital Backend Based on RFSoC
- Ensemble Numerical Simulations of Realistic SEP Events and the Inspiration for Space Weather Awareness
- Identi fications of RR Lyrae Stars and Quasars from the Simulated Data of Mephisto-W Survey
- Studies on the Equatorial Spot of G-type Contact Binary UV Lyn
- Search for the Metal-weak Thick Disk from the LAMOST DR5
