A novel method for identifying influential nodes in complex networks based on gravity model
Yuan Jiang(蔣沅) Song-Qing Yang(楊松青) Yu-Wei Yan(嚴玉為)Tian-Chi Tong(童天馳) and Ji-Yang Dai(代冀陽)
1School of Information Engineering,Nanchang Hangkong University,Nanchang 330063,China
2School of Automation,Nanjing University of Technology,Nanjing 210094,China
Keywords: influential nodes,gravity model,structural hole,K-shell
1. Introduction
With the rapid development of network information technology, studies on complex networks has attracted attention in many fields.[1–4]As one of the core elements of a complex network, influential nodes have a significant impact on the structure and function of the network and are widely studied and applied, such as inhibiting disease spreading,[5]rumor controlling,[6]information dissemination,[7]and traffic network analysis.[8]
In different research backgrounds, scientists have proposed many measures to identify the influence of nodes. At present, degree centrality[9]is the commonly used measure,which is simple but not accurate. Betweenness centrality[10]and closeness centrality[11]are based on the number of shortest paths between nodes and the average shortest distance respectively, however, the information flow does not always transmit through the shortest path and its time complexity is high. Brockmanet al.[12]proposed a probabilistically motivated effective distance to replace the shortest distance,which can effectively mine the dynamic interaction information between nodes. Kitsaket al.[13]proposed the K-shell decomposition method to determine the locations of nodes in the network, which has low time complexity, however its discrimination is too coarse. To improve the discrimination, Zenget al.[14]proposed a mixed degree decomposition method,which decomposes K-shell based on the mixing degree of the remaining neighbors and the deleted neighbors in the network.Bae and Kimet al.[15]introduced the concept of neighborhood coreness in their improvement of the K-shell method,using the sum of K-shell values of nodes and their neighbors to identify the influence of nodes in the network. Wanget al.[16]proposed a vector centrality method based on the number of multi-order neighbor shells,using the form of vectors to represent the relative influence of nodes in a network. Burtet al.[17]proposed the theory of structural holes and designed the network constraint index to quantify the constraints that nodes are subjected to when they form structural holes,which can identify the bridging nodes in a network. Suet al.[18]proposed a method based on the structural holes of nodes and their neighbors,which considers both the degree centrality and topology of nodes and their neighbors and can effectively identify influential nodes in a network. Yanget al.[19]quantified the complexity of the network based on Tsallis entropy and combined the structural holes and global location information of nodes to identify influential nodes in the network.
Gravity model is derived from Newton’s law of gravitation, which can represent the interaction between nodes in a complex network. If a node has more interaction with others, the node should be more influential. Based on gravity model, Liet al.[20]considered both neighborhood information and path information to identify influential nodes. Maet al.[21]proposed a gravity model that regards the K-shell value of each node as its mass. Yanet al.[22]proposed a method to identify influential spreaders based on entropy weight method and gravity law.
Based on the above research works, we propose a novel method for identifying influential nodes in complex networks based on gravity model, called EGMS. The EGMS method considers both the local topology and the global location of nodes in a network. In the EGMS method, the K-shell centrality is used to reflect the global location of nodes and the structure hole characteristics are used to represent the local topology of nodes. At the same time, to simplify the spatiotemporal complexity of a network and mine the implicit dynamic information in a network, the shortest distance is replaced by a probabilistically motivated effective distance.Then this method fully considers the influence of nodes and their neighbors from the aspect of gravity. By using the monotonicity index, susceptible-infected-recovered (SIR) model,and Kendall’s tau coefficient as evaluation criteria, we compare the proposed method with seven existing identification methods on eight real-world networks. The experimental results show the excellent performance of the proposed method and the relationship between different methods.
The structure of this paper is as follows. In Section 2,we briefly introduce several existing identification methods and the concept of effective distance. In Section 3,a novel method for identifying influential nodes in complex networks based on gravity model is then proposed and presented.In Section 4,the details and results of experiments are then presented. Finally,conclusions will be given in Section 5.
2. Preliminaries
Given a complex networkG=(V,E),whereVandErepresent the set of nodes and edges inGrespectively.nandmare the number of nodes and edges. The adjacency matrix of networkGis denoted asAn×n=(ai j)n×n, whereai j=1 if there is a connective relationship between nodeviand nodevj,andai j=0 otherwise.
2.1. Degree centrality
Degree centrality[9](DC)is a simple measure for identifying influential nodes. The more DC a node possesses, the more influential it is. It is defined as follows:

wherekiis the degree of nodevi. Hence nodevi’s degree of next-nearest neighbors isQ(i)=∑ω∈Γ(i)kω,whereΓ(i)is the set ofvi’s nearest neighbors.
2.2. Betweenness centrality
Betweenness centrality[10](BC)focuses on the degree of clustering of the shortest path through a node. It is defined as follows:

2.3. Closeness centrality
Closeness centrality[11](CC)is defined as the reciprocal of the sum of the shortest distances between a node and all other nodes in the network. It is expressed as follows:

wheredijdenotes the shortest distance between nodesviandvj.
2.4. Mixed degree decomposition method
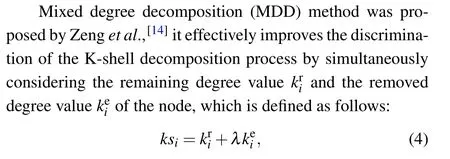
whereλis an adjustable parameter in range[0, 1], the MDD is consistent with the K-shell decomposition method ifλ=0,and it is equivalent to degree centrality ifλ=1. In this paper,we set the parameterλ=0.7 consistent with Ref.[11].
2.5. Structural holes theory
Structural hole theory was put forward by Burt in 1992 when he studied the competitive relationship in social networks.[17]In social networks,structural holes refer to nonredundant relationships between individuals,and there is a gap in complementary information. In order to quantify the control of the structural hole nodes on these relationships, Burt uses the network constraint index (NC) to measure the constraints formed by the nodes in the structural hole. The node is more likely to form structural holes if the index is smaller,and the influence of the node is greater. The network constraint index of nodeviis defined as follows:
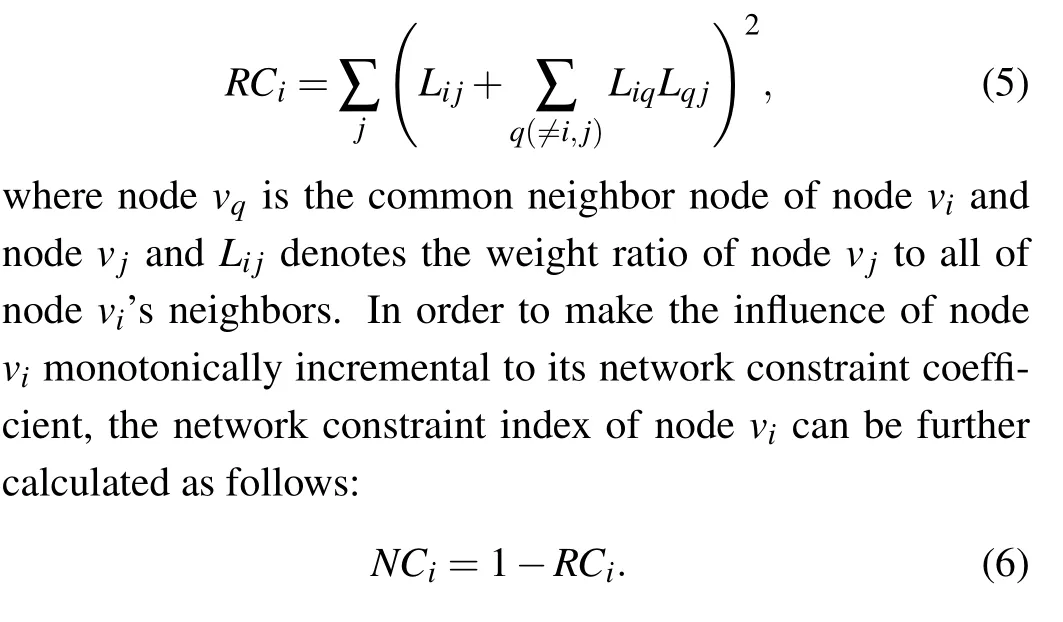
When calculating the network constraint index of nodevi,considering the degree of the node and its neighbors,as well as the topological structure of the node, the weight ratioLijcan be defined as follows:

2.6. Gravity model
Gravity model[20](GM) is inspired by Newton’s law of gravity,and it identifies influential nodes by considering both degree centrality and the shortest distance,which is defined as follows:

2.7. Effective distance
Effective distance[12](Edis)was proposed by Brockmann and Helbing in 2013 when studying the impact of complex networkdriven on the spreading process of epidemic diseases.Unlike conventional geographic distance and the shortest path distance,effective distance is a probabilistically motivated abstract distance. In the network where information flow is the interaction,it can effectively measure the mutual influence between nodes. The effective lengthdj|ifrom nodevito a directly connected nodevjis defined as follows:

wherePj|idenotes the ratio of information flow from nodevito nodevj,which can be calculated as follows:

wherekidenotes the degree of nodeviin the undirected network and the out-degree of nodeviin the directed network,ai jis the element in the adjacency matrixAn×n. For indirectly connected nodeviand nodevj,the effective length between them will be transmitted along the shortest path,e.g.,dj|i=dk|i+dj|klike form.
The effective distance is defined by the shortest one of all effective lengths from nodevito nodevj, which is expressed as follows:

whereλ(Γ) andΓdenote the set of all effective lengths and the sum of all the probably paths from nodevito nodevjrespectively. Usually,in the real-world networks,thedj|i/=di|jandDj|i/=Di|j.
3. Proposed method
3.1. The EGMS method
Based on the gravity model, a novel method is proposed for identifying influential nodes in terms of the local topology and the global location,called EGMS.The EGMS method comprehensively examines the structural hole characteristics and K-shell centrality of nodes,replaces the shortest distance with a probabilistically motivated effective distance,and fully considers the influence of nodes and their neighbors from the aspect of gravity. A flowchart of the proposed method is shown in Fig.1,and the further details are as follows:
Step 1 Calculating the joint K-shell centrality of node pairs
K-shell centrality is a global measure describing the location of a node in a network,it can reflect both the relationship between each node and the whole network as well as the interaction between distinct nodes. In this paper, the K-shell centrality of each node is obtained by the MDD method mentioned in Subsection 2.4, and the joint K-shell centrality of node pairs can be obtained as follows:

Step 2 Calculating the joint network constraint index of node pairs
The network constraint index in structural hole theory is an identification metric based on local topological information of the network,it can be calculate by Eqs.(5)–(7),and the joint network constraint index between nodeviand nodevjcan be calculated as follows:

Step 3 Calculating the effective distance between all node pairs
In our proposed EGMS method, the shortest distance is replaced by the probabilistically motivated effective distance to simplify the spatiotemporal complexity of a network and mine the implicit dynamic information in a network. The effective distance from one node to another node can be obtained using Eqs.(9)–(11).
Step 4 Calculating the combined forces of nodes
By comprehensively considering the K-shell centrality,network constraints and effective distances, the interaction forces between node pairs can be obtained. Thus, the combined force of nodeviis defined as follows:

Step 5 Getting the final influence of nodes
Bae and Kim[15]introduced the concept of neighborhood coreness (Cnc+) in improving the K-shell method, which measures the influence of nodes in a network by summing the K-shell values of their neighbors. In this paper, we borrow this concept and fully consider the influence of nodes’neighbors from the aspect of gravity. Based on the above,the final influence of nodevican be calculated as follows:

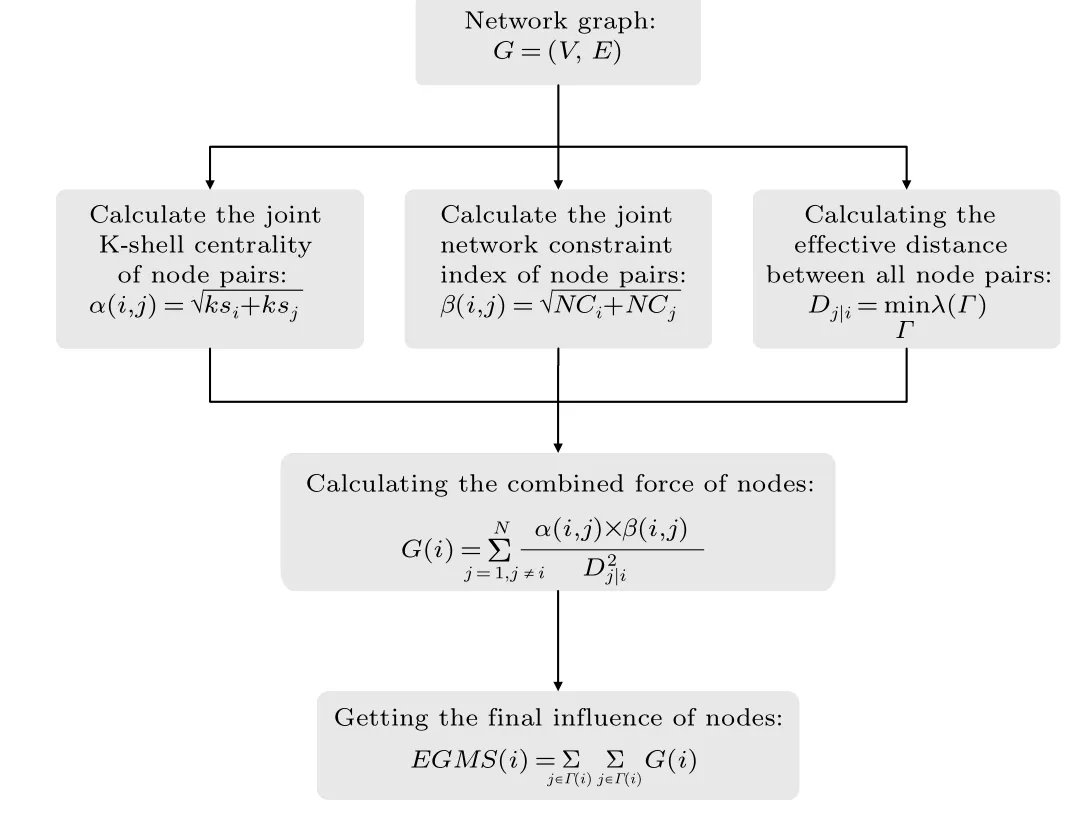
Fig.1. The flow chart of our proposed EGMS method.
3.2. A simpe example
To better illustrate how the EGMS method works and to initially assess its validity and accuracy,a simple example network with 10 nodes and 14 edges is given in Fig.2,and some properties of each node in the example network are shown in Table 1.
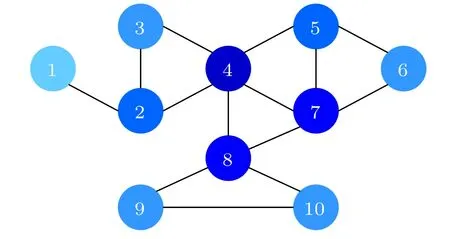
Fig.2. A simple example network with 10 nodes and 14 edges. Nodes with larger degrees have darker colors.
Firstly, we calculate the joint K-shell centrality of node pairs by Eq. (12) and the joint network constraint index of node pairs by Eq. (13) respectively. The joint K-shell centrality and the joint network constraint index between nodev4and nodev9can be obtained as follows:

Secondly, by using Eqs. (9)–(11), the effective distance between nodev4and nodev9can be obtained as follows:

The above results clearly show thatD4|9andD9|4are not equal, as mentioned in Subsection 2.7. The results of the effective distance from nodev4to the others are shown in Table 2.

Table 1. Properties of each node in the example network,including DC,MDD,and NC.

Table 2. Effective distance from node v4 to the others in the example network.

Table 3. The combined forces of nodes in the example network.

Table 4. The final influence of nodes in the example network.
Then,the combined force of nodev4can be obtained by Eq.(14)as follows:
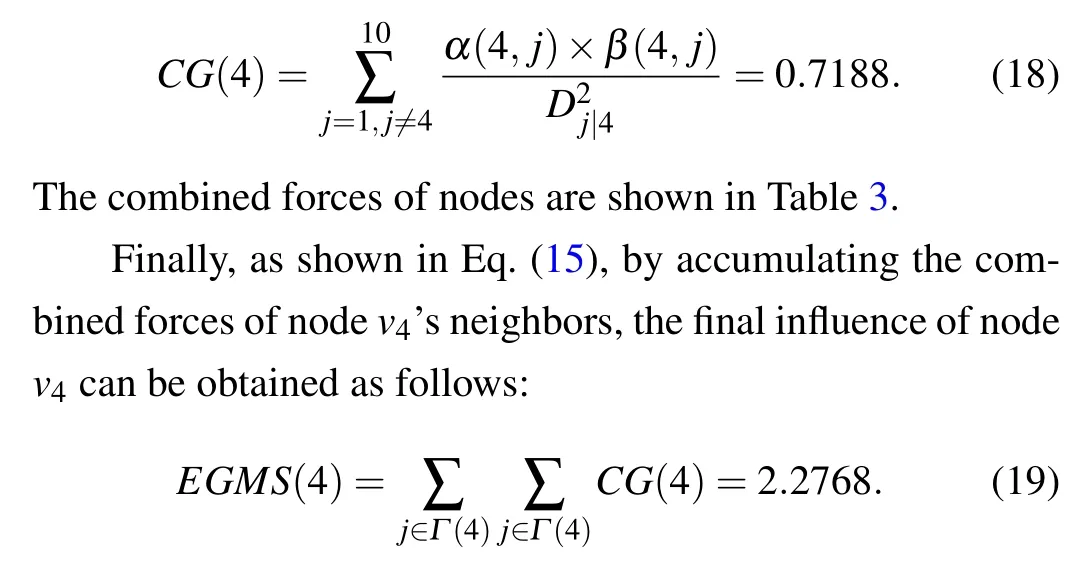
The final influence of nodes are shown in Table 4.
According to Table 1 and Table 4, the ranking lists of nodes in the example network measured by different methods are shown in Table 5. As shown in Table 5, the ranking lists of nodes measured by the EGMS method is is similar to other methods, indicating that the EGMS method can effectively identify the influence of nodes. Compared with DC and MDD,the influence of nodev7and nodev8is further discriminated in the EGMS method. And compared with NC,nodev2and nodev6are re-ranked in the EGMS method by considering the influence of their neighbors. Based on the above, the validity and accuracy of EGMS method is initially verified.

Table 5. The ranking lists of nodes in the example network measured by different methods.
4. Experimental analysis
4.1. Dataset
In this section, eight real-world networks from different fields are chosen for experiments, including the Dolphins,[23]Polbooks,[24]Jazz,[25]USAir,[26]NetScience,[27]C.Elegans,[28]Email,[29]PowerGrid.[30]The statistical characteristics of eight real-world networks are shown in Table 6. The table includes information on the number of nodesn, the number of edgesm, the average degree〈k〉,the clustering coefficientc,the average shortest path length〈d〉, the epidemic thresholdβthin SIR model, and the fixed infection probabilityβ.
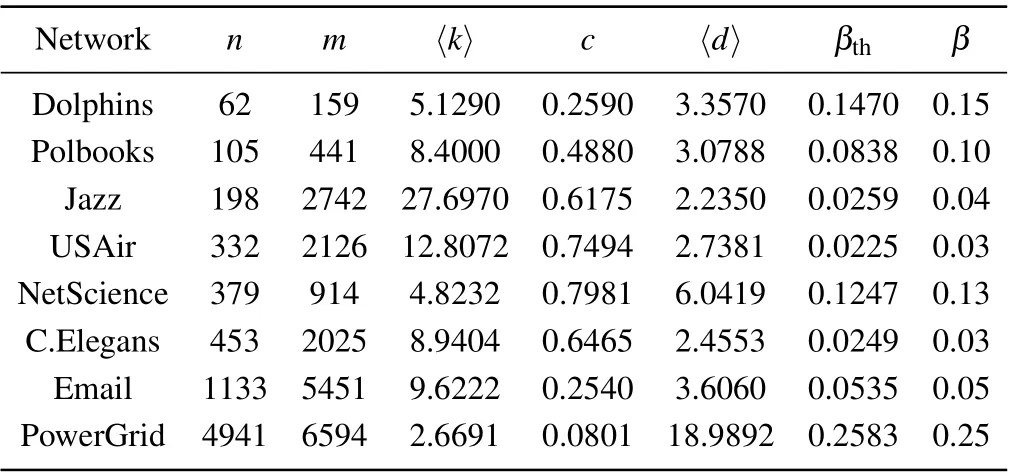
Table 6. Statistical characteristics of eight real-world networks.
4.2. Comparison methods
To verify the validity and accuracy of our proposed EGMS method, seven methods are used as comparisons,including degree centrality (DC),[9]betweenness centrality(BC),[10]closeness centrality (CC),[11]mixed degree decomposition method (MDD),[14]network constraint index(NC),[18]neighborhood coreness (Cnc+),[15]and gravity model(GM).[20]
4.3. Evaluation criteria
To evaluate the performance of difference methods, several evaluation criteria are presented in this section,including monotonicity index,[15]susceptible–infected–recovered(SIR)model,[31]and Kendall’s tau coefficient.[32]
The monotonicity indexM(R)is used to quantify the resolution of different identification methods,which is defined as follows:

whereRis the influence ranking vector of each node obtained by the influence identification method,nis the total number of nodes,andnris the number of nodes with the same influence.The value ofM(R)in range[0,1],which will be higher if the identification method can better distinguish the influence of all nodes in the network.
The SIR model[31]is used to examine the spreading ability of nodes. In this model, each node in the network can be in one of the following three states: susceptible, infected, or recovered. In the initial stage of spreading,only one infected node in the network, and all other nodes are susceptible. In each timestamp, each one infected node to infect its susceptible neighbors with the infection probabilityβ. At the same time,the infected node recovers with probabilityμ. This process is repeated until there are no susceptible nodes in the network. At the end of SIR spreading process, the number of recovered nodes is regarded as the spreading ability of nodes.For simplicity, the value of the recovery probability is set toμ=1. The spreading process cannot be carried out normally if the infection probabilityβis too small or too large, do the spreading ability of each node cannot be measured accurately.Therefore, we set the epidemic threshold isβth≈〈k〉/〈k2〉,where〈k〉and〈k2〉denote the average degree and average second-order degree of the nodes respectively. The value ofβis set nearβth. As show in Table 6,theβthandβfor different networks are given.
In order to evaluate the accuracy of the identification method, Kendall’s tau coefficient[32]is used to measure the correlation between the ranking list of nodes’ influence obtained by each identification method and the ranking list of nodes’ spreading ability obtained from the SIR model. Suppose there are two sequencesXandYcontainingnnodes,whereX=(x1,x2,...,xn)andY=(y1,y2,...,yn),and the elements in sequenceXand sequenceYare constructed into a new sequenceXY=((x1,y1),...,(xi,yi),...,(xn,yn)). For any pair of elementsXYi=(xi,yi)andXYj=(xj,yj)in the sequenceXY,if(xi >xjandxi >yj)or(xi <xjandxi <yj),the pair is considered to be concordant.On the contrary,if(xi >xjandxi <yj)or(xi <xjandxi >yj),this pair is considered to be discordant. If (xi=xjandxi=yj), it is considered that the pair is neither concordant nor discordant. Kendall’s tau coefficientτis defined as wherencandndare the numbers of concordant pairs and discordant pairs respectively.The value ofτin range[-1,1].The two sequences are completely positively correlated ifτ=1,that is to say, the closer the value ofτis to 1, the higher the accuracy. On the contrary, the two sequences are completely negatively correlated.

4.4. Experiments
4.4.1. Examining the resolution of different identification methods
In this experiment, the monotonicity index[13]Mis used to examine the resolution of the seven identification methods and our proposed EGMS method,i.e.,the ability to distinguish the influence of nodes. Table 7 records the resolution of the different methods in eight real-world networks, and figure 3 shows the difference more intuitively. As shown in Fig.3,the EGMS method performs very well in the eight networks. In addition, the resolution of CC and GM is also good. Compared with others, the EGMS method gives a higherMvalue in most cases, and the value ofM(EGMS) is very close to or even equal to 1 in all cases. Therefore,the EGMS method performs excellent in distinguish the influence of nodes.
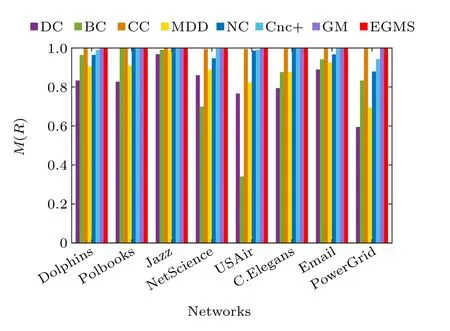
Fig. 3. The monotonicity index M of eight identification methods in eight real-world networks.

Table 7. The monotonicity index M of different identification methods.
4.4.2. The comparisons of different identification methods and SIR model
In this experiment, the SIR model is used to obtain the spreading ability of nodes and Kendall’s tau coefficient is used to quantify the correlation between the spreading ability and influence of nodes in the networks. The stronger the correlation,the more accurate the identification method is.Due to the randomness of the spreading process of the SIR model,this experiment repeats the spreading process for each node and then takes the average value. For networks|V|<100, the independent experiment is executed 104times; for|V|<103, the independent experiment is executed 103times. Table 8 shows Kendall’s tau coefficient between different identification methods and the SIR model with the fixed infection probability in eight real-world networks, whereσdenotes the ranking lists of the spreading ability of nodes in the networks. The values of the fixed infection probability are shown in Table 6.
In order to further verify the accuracy and reliability of the proposed method,a series of Kendall’s tau coefficients between different identification methods and SIR model can be obtained by changing the infection probabilityβ. The results are shown in Fig. 4, where the black dashed line denotes the epidemic thresholdβth. From which we can see, the EGMS method outperforms all the methods when the infection probabilityβtakes values near the epidemic thresholdβth. This indicates that the influence of nodes identified by the EGMS method has a significant correlation with the spreading ability of nodes. When the infection probability is far greater than or far less than the epidemic threshold,DC,MDD and GM show better correlation than EGMS in six networks except USAir and PowerGrid. In addition, Cnc+ performed slightly worse than EGMS in most networks and BC performed worst in all cases.According to the above analysis,the EGMS method can identify the influence of nodes more accurately and reliably.

Table 8. Kendall’s tau coefficient between different identification methods and SIR model with the fixed infection probability.
4.4.3. Kendall’s τ coefficient for different identification methods to varying scales of topranking nodes
In this experiment, the scale of nodes examined by Kendall’s tau coefficient is adjusted, which is changed from whole nodes to partial nodes. The correlation results between the top nodes in different scales obtained by different identification methods and the ranking list of the spreading ability of nodes are further studied. The scale of topranking nodes is denotes asL,which is set to 0.05–1.Figure 5 shows the values of Kendall’s tau coefficient for different identification methods to varying scales of topranking nodes nodes. As shown in Fig.5,the EGMS method performs well at various scales of topranking nodes and performs better than all other methods at higher values ofL.
4.4.4. The relationship between EGMS and other identification methods
In the final experiment, the relationship between the EGMS method and other identification methods is analyzed.The results are shown in Fig. 6, where each point denotes one node in the network, the color of each point denotes the spreading ability derived by the SIR model,and the horizontal and vertical axes are denote the values of nodes’influence in the network obtained by the EGMS method and other methods respectively. The EGMS method has a strong correlation with one method if the nodes in the figure are linearly distributed.As shown in the distribution of the nodes in Fig. 6, strong correlations are found between EGMS and DC, CC, MMD,and NC, respectively. This indicates that the EGMS method not only takes into account the degree centrality, location information and the closeness between nodes sufficiently, but also has the ability to identify bridging nodes in the network.Moreover,the apparent linear relationship between EGMS and Cnc+and GM indicates that the node rankings are overall similar, and it also demonstrates that EGMS can identify the influence of nodes effectively. From Fig.6,it can also find that some nodes have large values of BC,but their spreading ability is not very strong, so it is not accurate enough to identify the influence of nodes by BC alone.Therefore,the EGMS method is more advantageous than other methods in identifying the influence of nodes in the network.
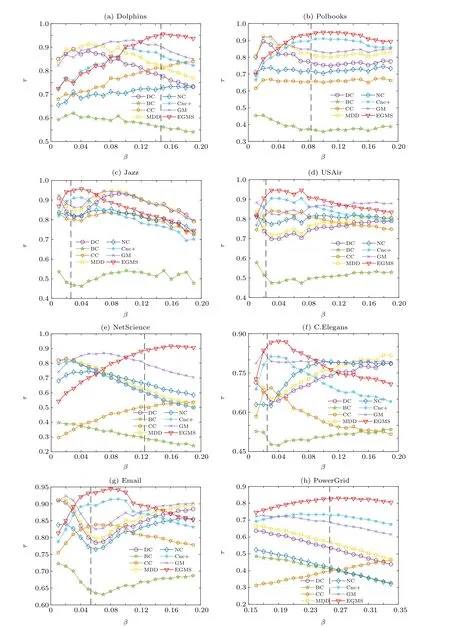
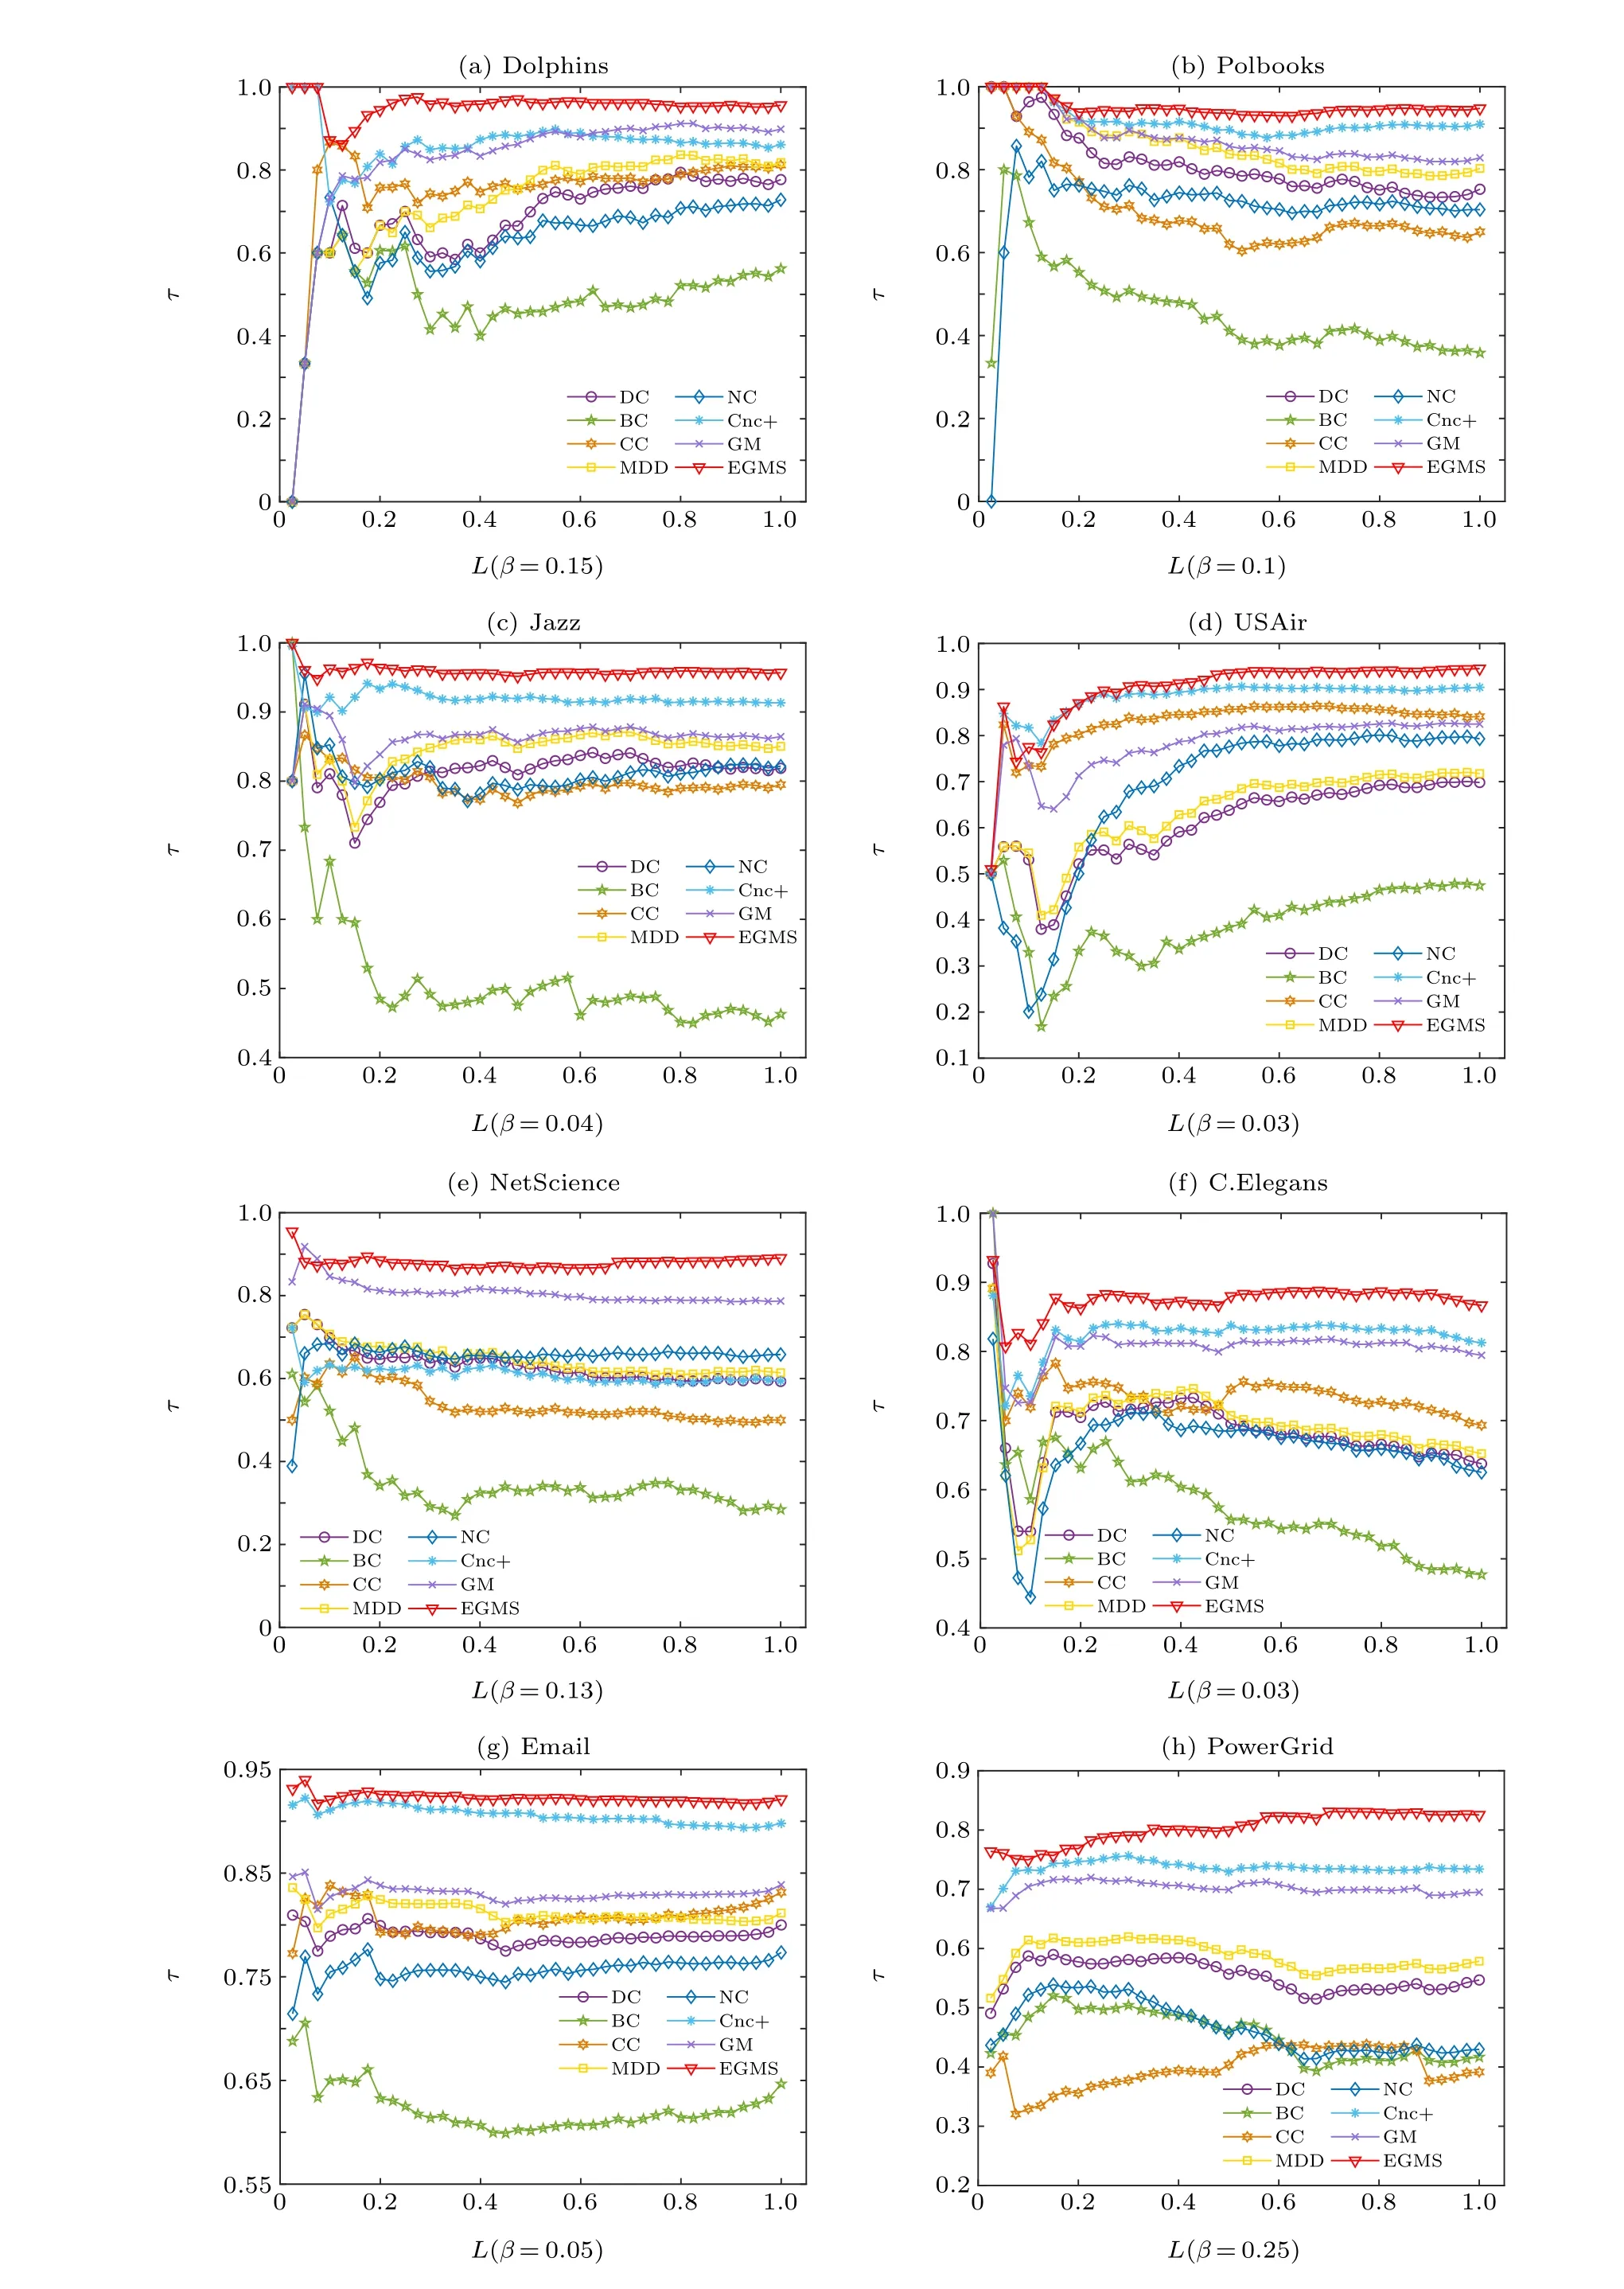
Fig.5. Kendall’s τ coefficient for different identification methods to varying scales of top-ranking nodes: (a)Dolphins;(b)Polbooks;(c)Jazz;(d)USAir;(e)NetScience;(f)C.Elegans;(g)Email;(h)PowerGrid.

Fig. 6. The relationship between EGMS and other identification methods: (a1)–(a7) Dolphins, β =0.15; (b1)–(b7) Polbooks, β =0.1; (c1)–(c7)Jazz,β =0.04;(d1)–(d7)USAir,β =0.03.
5. Conclusions and discussion
In this paper,we proposed a novel method for identifying influential nodes in complex networks based on gravity model,called EGMS. For the shortcoming that the existing methods concentrate only on only one aspect,the EGMS method considers both the local topology and the global location information,comprehensively examines the structural hole characteristics and K-shell centrality of nodes At the same time,the shortest distance is replaced by a probabilistically motivated effective distance to simplify the spatiotemporal complexity of a network and mine the implicit dynamic information in a network. Then the EGMS method fully considers the influence of nodes and their neighbors from the aspect of gravity to optimize the utilization of available resources. In addition,the EGMS method also has the ability to identify bridging nodes in the network. From the experimental results, the EGMS method can better distinguish differences in the influence of nodes than other identification methods. Further, the EGMS method performs excellent in identifying influential nodes at various scales of topranking nodes. Finding a more effective method combining network topology and propagation dynamics to identify influential nodes in the network is still an open issue. How to improve our proposed EGMS method to reduce its time complexity is our future work.
Acknowledgment
Project supported by the National Natural Science Foundation of China(Grant Nos.61663030 and 61663032).
- Chinese Physics B的其它文章
- Erratum to“Boundary layer flow and heat transfer of a Casson fluid past a symmetric porous wedge with surface heat flux”
- Erratum to“Accurate GW0 band gaps and their phonon-induced renormalization in solids”
- Voter model on adaptive networks
- A novel car-following model by sharing cooperative information transmission delayed effect under V2X environment and its additional energy consumption
- GeSn(0.524 eV)single-junction thermophotovoltaic cells based on the device transport model
- Investigation of the structural and dynamic basis of kinesin dissociation from microtubule by atomistic molecular dynamics simulations

