Variation of soil physical-chemical characteristics in salt-affected soil in the Qarhan Salt Lake, Qaidam Basin
HUI Rong, TAN Huijuan, LI Xinrong, WANG bingyao
Shapotou Desert Research and Experiment Station, Northwest Institute of Eco-Environment and Resources, Chinese Academy of Sciences, Lanzhou 730000, China
Abstract: Soil salinization has adverse effects on the soil physical-chemical characteristics. However, little is known about the changes in soil salt ion concentrations and other soil physical-chemical characteristics within the Qarhan Salt Lake and at different soil depths in the surrounding areas. Here, we selected five sampling sites (S1, S2, S3, S4, and S5) alongside the Qarhan Salt Lake and in the Xidatan segment of the Kunlun Mountains to investigate the relationship among soil salt ion concentrations, soil physical-chemical characteristics, and environmental variables in April 2019. The results indicated that most sites had strongly saline and very strongly saline conditions. The main salt ions present in the soil were Na+, K+,and Cl-. Soil nutrients and soil microbial biomass (SMB) were significantly affected by the salinity (P<0.05).Moreover, soil salt ions (Na+, K+, Ca2+, Mg2+, Cl-, CO32-, SO42-, and HCO3-) were positively correlated with electrical conductivity (EC) and soil water content (SWC), but negatively related to altitude and soil depth. Unlike soil salt ions, soil nutrients and SMB were positively correlated with altitude, but negatively related to EC and SWC. Moreover, soil nutrients and SMB were negatively correlated with soil salt ions. In conclusion, soil nutrients and SMB were mainly influenced by salinity, and were related to altitude, soil depth, and SWC in the areas from the Qarhan Salt Lake to the Xidatan segment. These results imply that the soil quality (mainly evaluated by soil physical-chemical characteristics) is mainly influenced by soil salt ions in the areas surrounding the Qarhan Salt Lake. Our results provide an accurate prediction of how the soil salt ions, soil nutrients, and SMB respond to the changes along a salt gradient. The underlying mechanisms controlling the soil salt ion distribution, soil nutrients, and SMB in an extremely arid desert climate playa should be studied in greater detail in the future.
Keywords: salinization; soil salt ions; soil physical-chemical characteristics; soil microbial biomass; soil nutrient; Qarhan Salt Lake
1 Introduction
Soil salinization refers to the accumulation of soluble salts on the surface or near-surface, mainly including K+, Na+, Ca2+, Mg2+, Cl-, SO42-, CO32-, and HCO3-(Shrestha, 2006). Salinization is one of the most important factors limiting the growth of plants and microbes, and adversely affecting soil quality (Munns and Tester, 2008; Zhao et al., 2017). Soil salinization is a widespread and serious soil degradation phenomenon, which is caused by climate change and poor management of water and soil resources (Zhang, 2010). More than 7% of the Earth's surface is affected by soil salinization (Rozema and Flowers, 2008), with approximately 4.0×10⁸hm2of cultivated land severely limited by soil salinization (Bot et al., 2000). In China, about 1.0×10⁸hm2of the land area is affected by different degrees of soil salinization (Li et al., 2014). Numerous studies have demonstrated that soil salinization has been accelerated in arid and semi-arid regions of China (Li et al., 2007).
The Qaidam Basin is the largest basin on the northern edge of the Tibetan Plateau. It covers a total area of 2.75×10⁵km2(Jia et al., 2011), and is characterized by inland saline lake facies. It is located in a hyper-arid region of northwestern China, with low annual precipitation and high salinity (Jiao et al., 2015). The problem of soil salinization has become increasingly serious in the Qaidam Basin, and now affects about 42.5% of the agricultural land in the basin. Furthermore,soil salinization has a negative impact on plant growth, and worsens the soil physical-chemical properties (Paul and Lade, 2014). Wang et al. (2016) reported that the accumulation of salt in the soil induced by long-term saline water irrigation resulted in a loss of spring maize yield. Wong et al. (2008) indicated that soil salinization changed the soil aggregate structure, restricted the availability of soil nutrients, and reduced soil permeability. Previous studies on the effects of soil salinization in the Qaidam Basin have mostly focused on plant metabolism, photosynthesis,enzyme activity, nutrient absorption, and crop yields (Li et al., 2019a; Zhang et al., 2019). Li et al.(2019a) showed that soil salinization increased the amounts of osmotic substances and antioxidant enzymes ofLycium ruthenicum, but photosynthesis remained suppressed, which influenced crop yields. Zhang et al. (2019) also found that the photosynthetic properties ofElaeagnus angustifoliawere more sensitive to salinity than those ofLycium barbarum. However, these studies mostly involved the impacts of soil salinization on plants (i.e., the main economic crops and sand-fixation plants), whereas the effects of soil salinization on soil development, such as the salt ion distribution, soil nutrients, and soil microbial biomass (SMB), have been ignored.
Soil salinization causes high levels of soluble salt ions. The dominant salt ions in most soils are K+, Na+, Ca2+, Mg2+, Cl-, SO42-, CO32-, and HCO3-(Young et al., 2015); however, Na+and Clare the most prevalent salt ions and have been the focus of most research work (Tavakkoli et al.,2010). Munns and Tester (2008) showed that excessive Na+and Cl-concentrations critically affected biochemical processes and then reduced plant growth. However, high levels of one or several salt ions inevitably resulted in variances in the contents of the other balancing ions in the soil, and the effects of different salt ions on plants may differ (Tavakkoli et al., 2010). Genc et al.(2010) reported that changes in the Ca2+and K+concentrations may affect salinity responses. It is necessary to study the salt ion distribution in soils to better understand the mechanisms controlling the soil ecosystem response to salinization.
Soil salinization has adverse effects on the soil physical-chemical characteristics. Tejada and Gonzalez (2005) showed that an increase in electrical conductivity (EC) had a negative impact on soil structural stability, permeability, and bulk density. Mavi et al. (2012) demonstrated that soil dissolved organic matter was strongly affected by the salt-affected soils. Soil salinization also affected soil microbial communities and their activities due to the resulting variations in osmotic and matric potential of soil solution (Rietz and Haynes, 2003). SMB refers to the total number of soil microorganisms, such as bacteria, fungi, and protozoa, and is one of the most sensitive indicators of ecosystem stability (An et al., 2009). It is both a source and sink of available nutrients, and plays a crucial role in nutrient transformation in terrestrial ecosystems (Singh et al.,1989). Studies of SMB have become a common way to explore soil functions in response to soil environmental change (Holden and Treseder, 2013). The variation of SMB may impact on the turnover of soil organic matter. Lehmann et al. (2011) observed that increased SMB can influence soil nutrient cycling and soil organic carbon (SOC) mineralization. Liang et al. (2012) also reported that SMB was important in planting, fertilization, and other agricultural management activities. Therefore, studies of SMB dynamics with changes in the salt gradient will contribute to a better understanding of the dynamic changes of soil organic matter.
The Qarhan Salt Lake in the eastern Qaidam Basin, Qinghai-Tibet Plateau, is the largest salt lake and the largest potash and magnesium deposit production base in China (Xiang et al., 2021).The Golmud River is the major water supply to the Dabsan Lake, which is the largest saline lake in the Qarhan Salt Lake system (Wang et al., 2015). In recent years, the local environments and ecosystems had been exposed to high potential ecological and health risks due to industrial mining activities in the salt lake, agricultural development, and urbanization of the Golmud River (Xiang et al., 2021). Oasis agriculture is developing rapidly in the eastern Qaidam Basin. In this region,the light and heat conditions are conducive to the growth and development of crops, with spring wheat, oilseed rape, highland barley, potato, beans, and wolfberry being the main crops (Wang et al., 2019). In the region of eastern Qaidam Basin, soil degradation takes the form of salinization and alkalization, and has occurred mainly near the oasis borders and at lower elevations in the non-oasis regions where effective soil moisture might have been reduced by a warming-induced increase in evapotranspiration during 1990-2003 (Wang et al., 2003, Zeng and Yang, 2008). In this study, we clarified the relationship among soil water content (SWC), soil salinity, and distance from the Qarhan Salt Lake. Specifically, we investigated the dynamic changes in salt ion concentrations and other soil physical-chemical characteristics, assessed the differences in SWC,salt ion concentrations, and physical-chemical properties among five sampling sites, and analyzed the variation in salt ion concentrations and soil nutrients among the five sites. An evaluation of soil quality in the areas surrounding the Qarhan Salt Lake based on soil physical- chemical characteristics will be of great value in the adjustment of local economic strategies.
2 Materials and methods
2.1 Study area
The Qarhan Salt Lake (36°37′36″-37°12′33″N, 94°42′36″-96°14′35″E) is situated in the center of the southern Qaidam Basin, northern China (Fig. 1), with an elevation of 2675 m. The lake is 168 km long from west to east and 20-40 km wide from north to south, with a gross area of 5856 km2,making it the largest playa in the eastern Qaidam Basin (Huang and Han, 2007). The Qarhan Salt Lake has an extremely arid desert climate, where the mean annual precipitation is less than 30 mm, and the annual potential evaporation is more than 3000 mm (Li et al., 2015). The average wind speed is 4.3 m/s, with winds predominantly from the west to the northwest (Li et al., 2015).In the region of Qarhan Salt Lake, the precipitation declines from around the mountains to the center of the region. The precipitation is mainly concentrated in May-September, which accounts for more than 80% of annual rainfall (Zhang et al., 2012). The soil type in the Qarhan Salt Lake is saline sand, with a mean particle size of 164.50-186.08 μm (Li et al., 2019b). The naturally dominant plants in the Qaidam Basin are shrub/semi-shrub desert vegetation, includingHaloxylon ammodendron,Salsolaspp.,Ceratoides lateens,Ephedra przewalskii,Tamarixspp.,Calligonumspp.,Nitrariaspp., andArtemisiaspp. (Fan et al., 2014). Inflows to the Qarhan Salt Lake are mainly from perennial river water and spring water (Zhang et al., 1993), and perennial river water from the eastern Kunlun Mountains into the Qarhan Salt Lake (Fan et al., 2015). The Xidatan segment lies to the northern side of the Kunlun Mountains, with an elevation of about 4350 m.The climate in this region is semi-arid. According to meteorological records from the local weather station, annual mean temperature is -3.7°C in this region. The lowest temperature is recorded in January, with a mean value of -20.0°C, and the highest temperature is recorded in July, with a mean value of 14.0°C. Mean annual precipitation is about 400 mm, most of which falls from May to September (Luo et al., 2018). In this region, the dominant species areCarex moorcroftii,Stipa purpurea, and other cushion plants, such asAndrosace tapeteandArenaria kansuensis(Yang et al., 2013).
2.2 Soil sample collection
This study was conducted in April 2019 in the Qaidam Basin, northwestern China. In order to evaluate the soil salinity distribution and chemical processes, we collected soil samples and measured the related parameters, including SWC, pH, EC, ion concentrations, SOC, total nitrogen(TN), total phosphorus (TP), total potassium (TK), microbial biomass carbon (MBC), microbial biomass nitrogen (MBN), and microbial biomass phosphorus (MBP).
We selected five sampling sites (S1, S2, S3, S4, and S5) alongside the Qarhan Salt Lake and the Xidatan segment of the Kunlun Mountains (Fig. 1). Their distances from the Qarhan Salt Lake followed the order of S1, S2, S3, S4, and S5. We summarized the general characteristics of each sampling site based on the results of a field investigation in Table 1. At each site, we established three quadrats (10 m×10 m) and collected five soil samples using a soil auger along the diagonal of each quadrat at depths of 0-5, 5-10, 10-20, 20-40, 40-60, 60-80, and 80-100 cm. Five replicate soil samples from the same depth were evenly mixed into a composite sample of each quadrat. Thus, a total of 105 soil composite samples were collected at five sampling sites. All soil composite samples were randomly divided into three parts. One part was used to determine the SWC; the other part was air dried, ground, and then passed through a 2 mm-mesh sieve to measure salt ion concentrations (including Na+, K+, Ca2+, Mg2+, Cl-, CO32-, SO42-, and HCO3-)and other physical-chemical properties (pH, EC, SOC, TN, TP, and TK); and the rest part was kept in liquid nitrogen and used to analyze MBC, MBN, and MBP. In addition, we dug a hole about 0.50 m deep and 0.25 m square in each 10 m×10 m quadrat to measure the salt crust thickness directly using a steel tape.
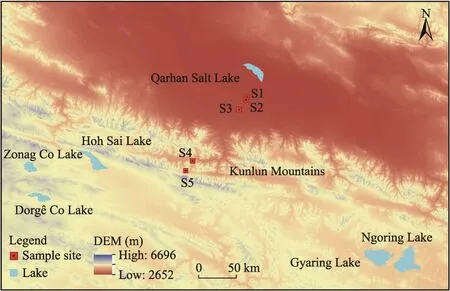
Fig. 1 Overview of the study area and sample sites. DEM, digital elevation model.

Table 1 General characteristics of the five sampling sites
2.3 Sample analysis
The SWC was determined by the gravimetric method, in which the soil samples were oven-dried for 48 h at 105°C to a constant weight (Nanjing Institute of Soil Research, CAS, 1980). The pH and EC were measured by a pH meter and a portable conductivity meter, respectively (Chen et al., 2017).The SOC was estimated using wet oxidation with K2Cr2O7and a titration with ferrous ammonium sulfate following the methods described by Li et al. (2010). The TN was determined by the Kjeldahl method, the TP was assessed by spectrophotometry after a perchloric acid-sulfuric acid digestion,and the TK was measured by flame photometry (Gammon, 1951; Olsen and Sommers, 1982).
Salt ion concentrations were determined based on the soil diluted extract method. The K+and Na+concentrations were measured by flame photometry, while the Ca2+and Mg2+concentrations were determined by an EDTA titration, the Cl-concentration was determined by a silver nitrate titration, the SO42-concentration was determined by an EDTA complexometric titration, and the CO32-and HCO3-concentrations were determined by the acid-alkali neutralization titrimetric method (with a pH of about 4.8) (Yang et al., 2014; Chen et al., 2019).
Each fresh soil sample was divided into six equal subsamples for MBC, MBN, and MBP estimation using the fumigation extraction method (Brookes et al., 1982, 1985). Carbon and nitrogen were extracted from fumigated (with ethanol free CHCl3) and non-fumigated samples with 50 mL 0.5 mol/L K2SO4, shaken for 30 min at 200 r/min, and filtered (Dijkstra et al., 2015).The MBC and MBN were calculated as the difference between the carbon and nitrogen extracted from fumigated and non-fumigated samples, using extraction efficiencies of 0.38(Jiang et al., 2006) and 0.54 (Brookes et al., 1985), respectively. The MBP was analyzed calorimetrically with a spectrophotometer (Xue et al., 2014). Fumigated soil samples were extracted by 0.5 mol/L NaHCO3in an oscillator, and then Mo-Sb sepetrochrometry solution was added for color development. A simultaneous extraction of non-fumigated soil samples was also conducted. After 30 min, the color intensity was analyzed with a spectrophotometer at a wavelength of 700 nm. The difference between the phosphorus extracted from fumigated and non-fumigated samples was converted into the MBP using an extraction efficiency of 0.4(Brookes et al., 1985).
2.4 Statistical analysis
All data were expressed as the mean±standard deviation (SD), with three biological replications.A one-way analysis of variance followed by a Duncan's test was used to evaluate the differences in SWC, salt ion concentrations, and physical-chemical properties among the five sites. Data was log-transformed to normalize distributions. A significance level ofP<0.05 was defined. Statistical analyses were conducted using the SPSS 16.0 software (SPSS Inc., Chicago, IL, USA). A redundancy analysis (RDA) was applied to explore how salt ion concentrations and soil nutrients varied among environmental variables of sampling sites (altitude, SWC, EC, and soil depth). The data were initially analyzed by a detrended correspondence analyses (DCA) to assess the gradient length, which confirmed that a linear model RDA was an appropriate approach (SD<3) (Rubino and McCarthy, 2003). The DCA and RDA analyses were conducted in R 3.5.1 software using the vegan package.
3 Results
3.1 Soil water content (SWC), pH, and electrical conductivity (EC)
SWC, pH, and EC displayed diverse tendencies at the different sampling sites and soil depths(Table 2). Within the 0-100 cm soil depth, SWC first increased and then decreased with distance from the Qarhan Salt Lake, reaching a maximum at S3, especially in the upper 0-10 cm soil depth.There was no obvious trend in the variation of soil pH from S1 to S5, which ranged between 8.03 and 8.88. The average EC significantly decreased with distance from the Qarhan Salt Lake. At S1,which was the site closest to the Qarhan Salt Lake, the value of EC within the 0-5 cm soil depth reached 25.2 dS/m, but it was only 6.6 dS/m at S5, which was the site farthest from the Qarhan Salt Lake (Table 2). Soil depth also affected the SWC, pH, and EC. Other than at S5, SWC rapidly increased with soil depth from the soil surface to the 40 cm soil depth, and remained constant in the 40-100 cm soil depth, while pH values gradually decreased with soil depth.Similarly, EC also decreased with soil depth at all the five sampling sites. The mean EC values in the 80-100 cm soil depth were 6.9, 7.0, 7.7, 3.7, and 4.2 dS/m at S1, S2, S3, S4, and S5,respectively, with the reductions of 72.62%, 71.19%, 63.85%, 43.08%, and 36.36% compared with that in the 0-5 cm soil depth, respectively (Table 2). These results indicated that the distance from the Qarhan Salt Lake had little effect on soil pH, but did influence the SWC and EC. In addition, soil depth also affected SWC, pH, and EC at all the sampling sites except S5.
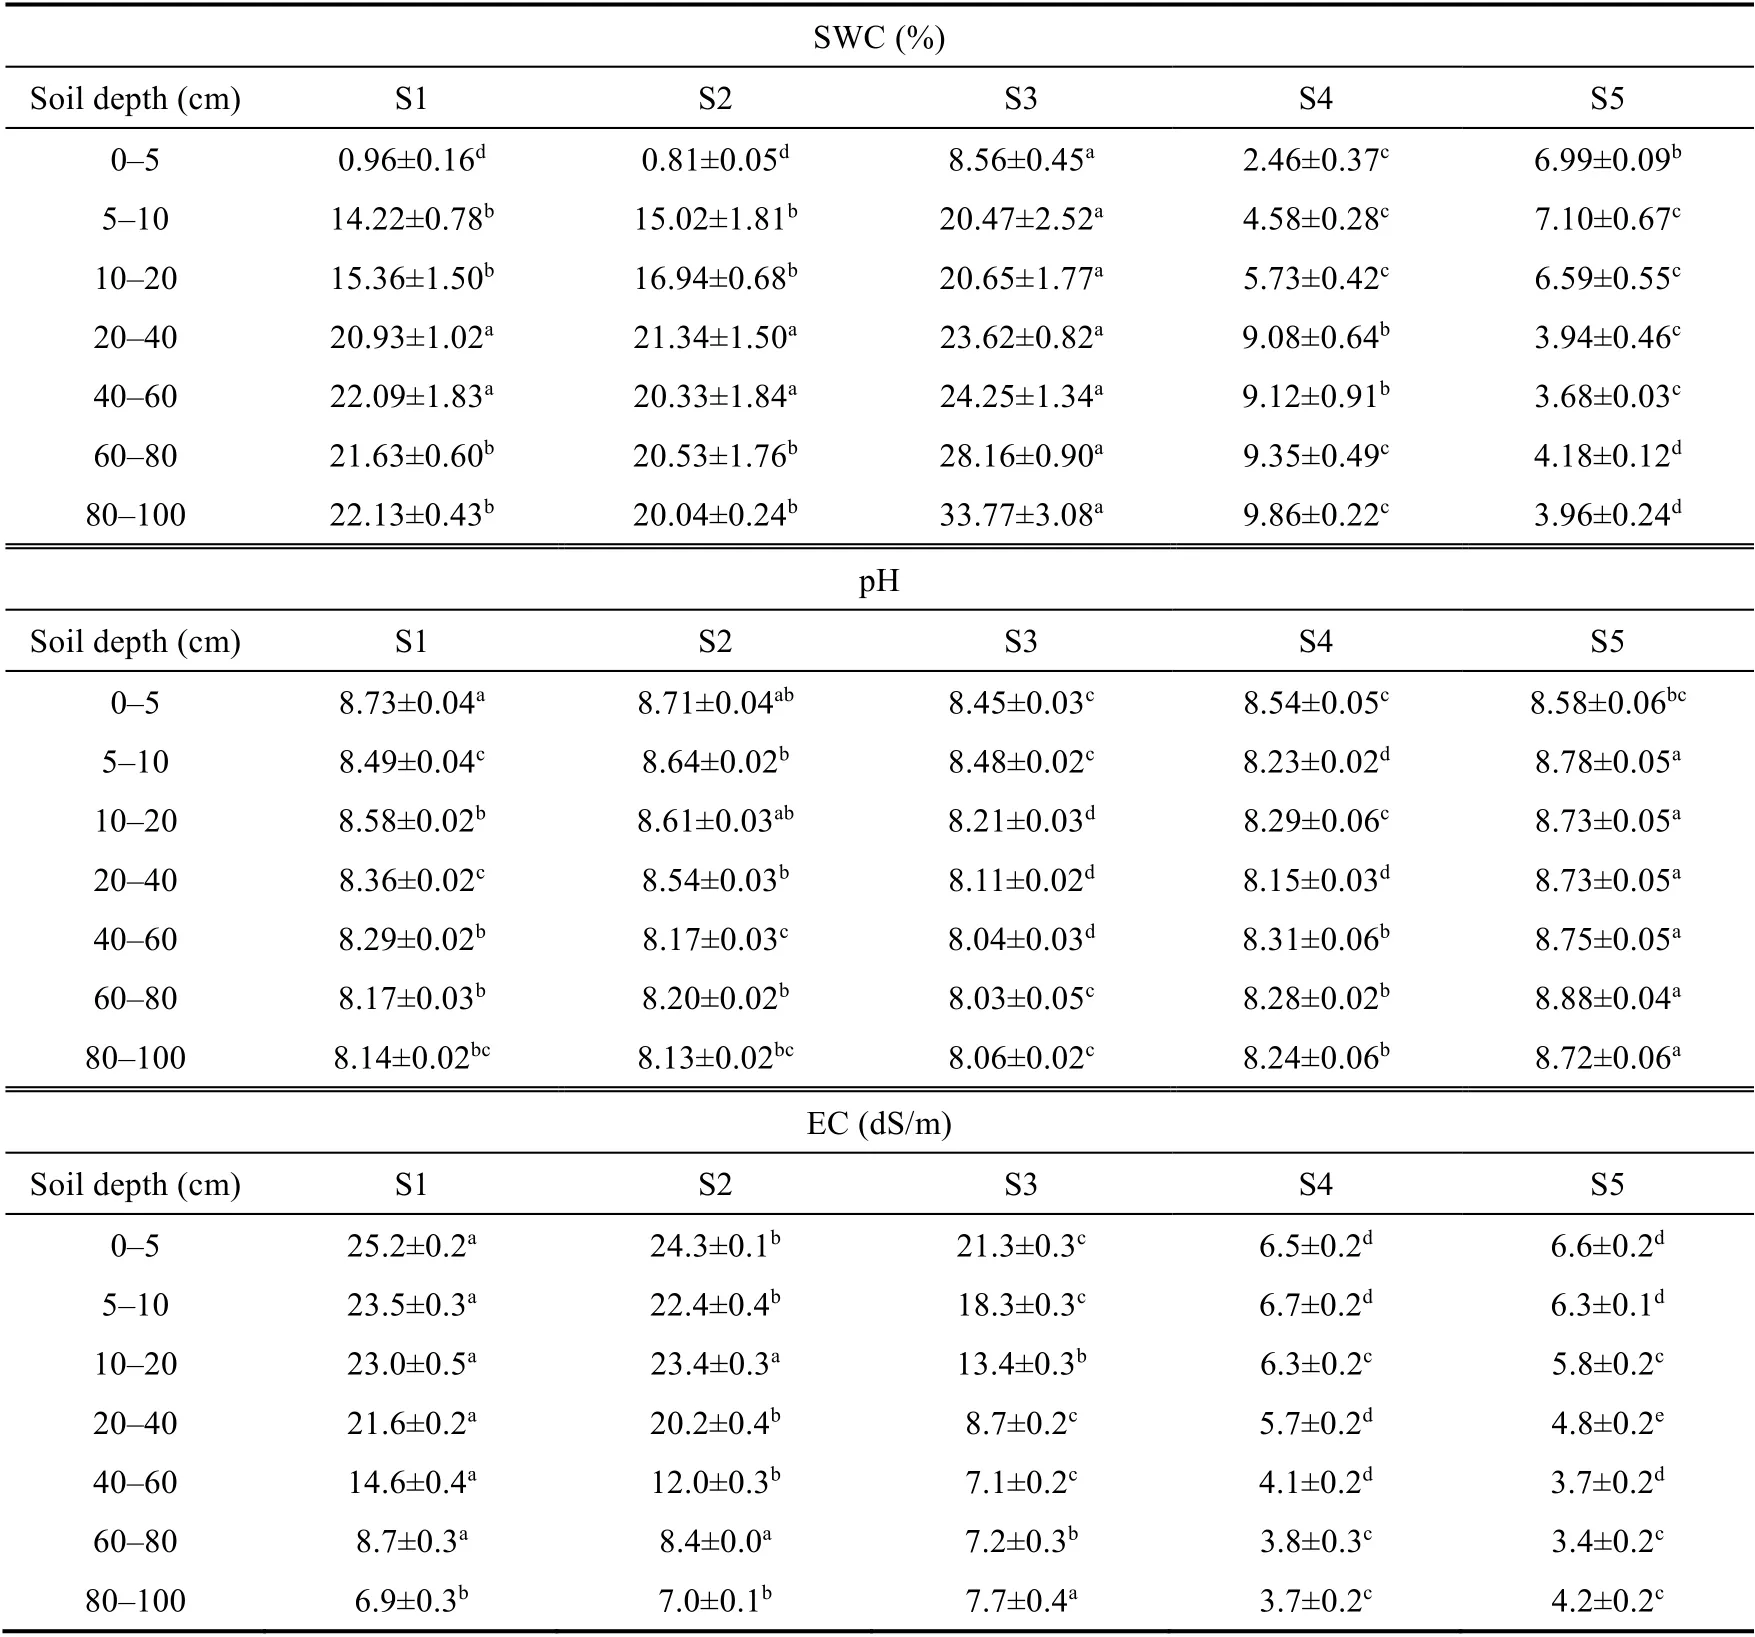
Table 2 Soil water content (SWC), pH, and electrical conductivity (EC) at different soil depths in the five sampling sites
3.2 Soil nutrient contents
Soil nutrient contents were affected by the distance from the Qarhan Salt Lake and soil depths.The SOC significantly increased from S1 to S5, and the increase amplitude became larger with increasing distance from the Qarhan Salt Lake. For S2 to S5, the SOC increased substantially by 0.3%, 15.4%, 43.2%, and 61.5%, respectively, in the 0-5 cm soil depth, and by 5.7%, 18.7%,48.5%, and 70.2%, respectively, in the 20-40 cm soil depth, compared with S1 (Table 3).However, soil nutrient concentrations decreased gradually with soil depth at S1-S5, and reached a minimum value when the soil depth reached 80-100 cm. The increase in soil depth caused a reduction in the SOC of 3.5%, 13.2%, 30.8%, 39.3%, 38.6%, and 40.6% in the 5-10, 10-20,20-40, 40-60, 60-80, and 80-100 cm soil depths, respectively, compared with the SOC in the 0-5 cm soil depth at S3 (Table 3). Similar trends in TN, TP, and TK were observed. The SOC, TN,TP, and TK increased with distance from the Qarhan Salt Lake, but decreased with soil depth.
3.3 Soil salt ion concentrations

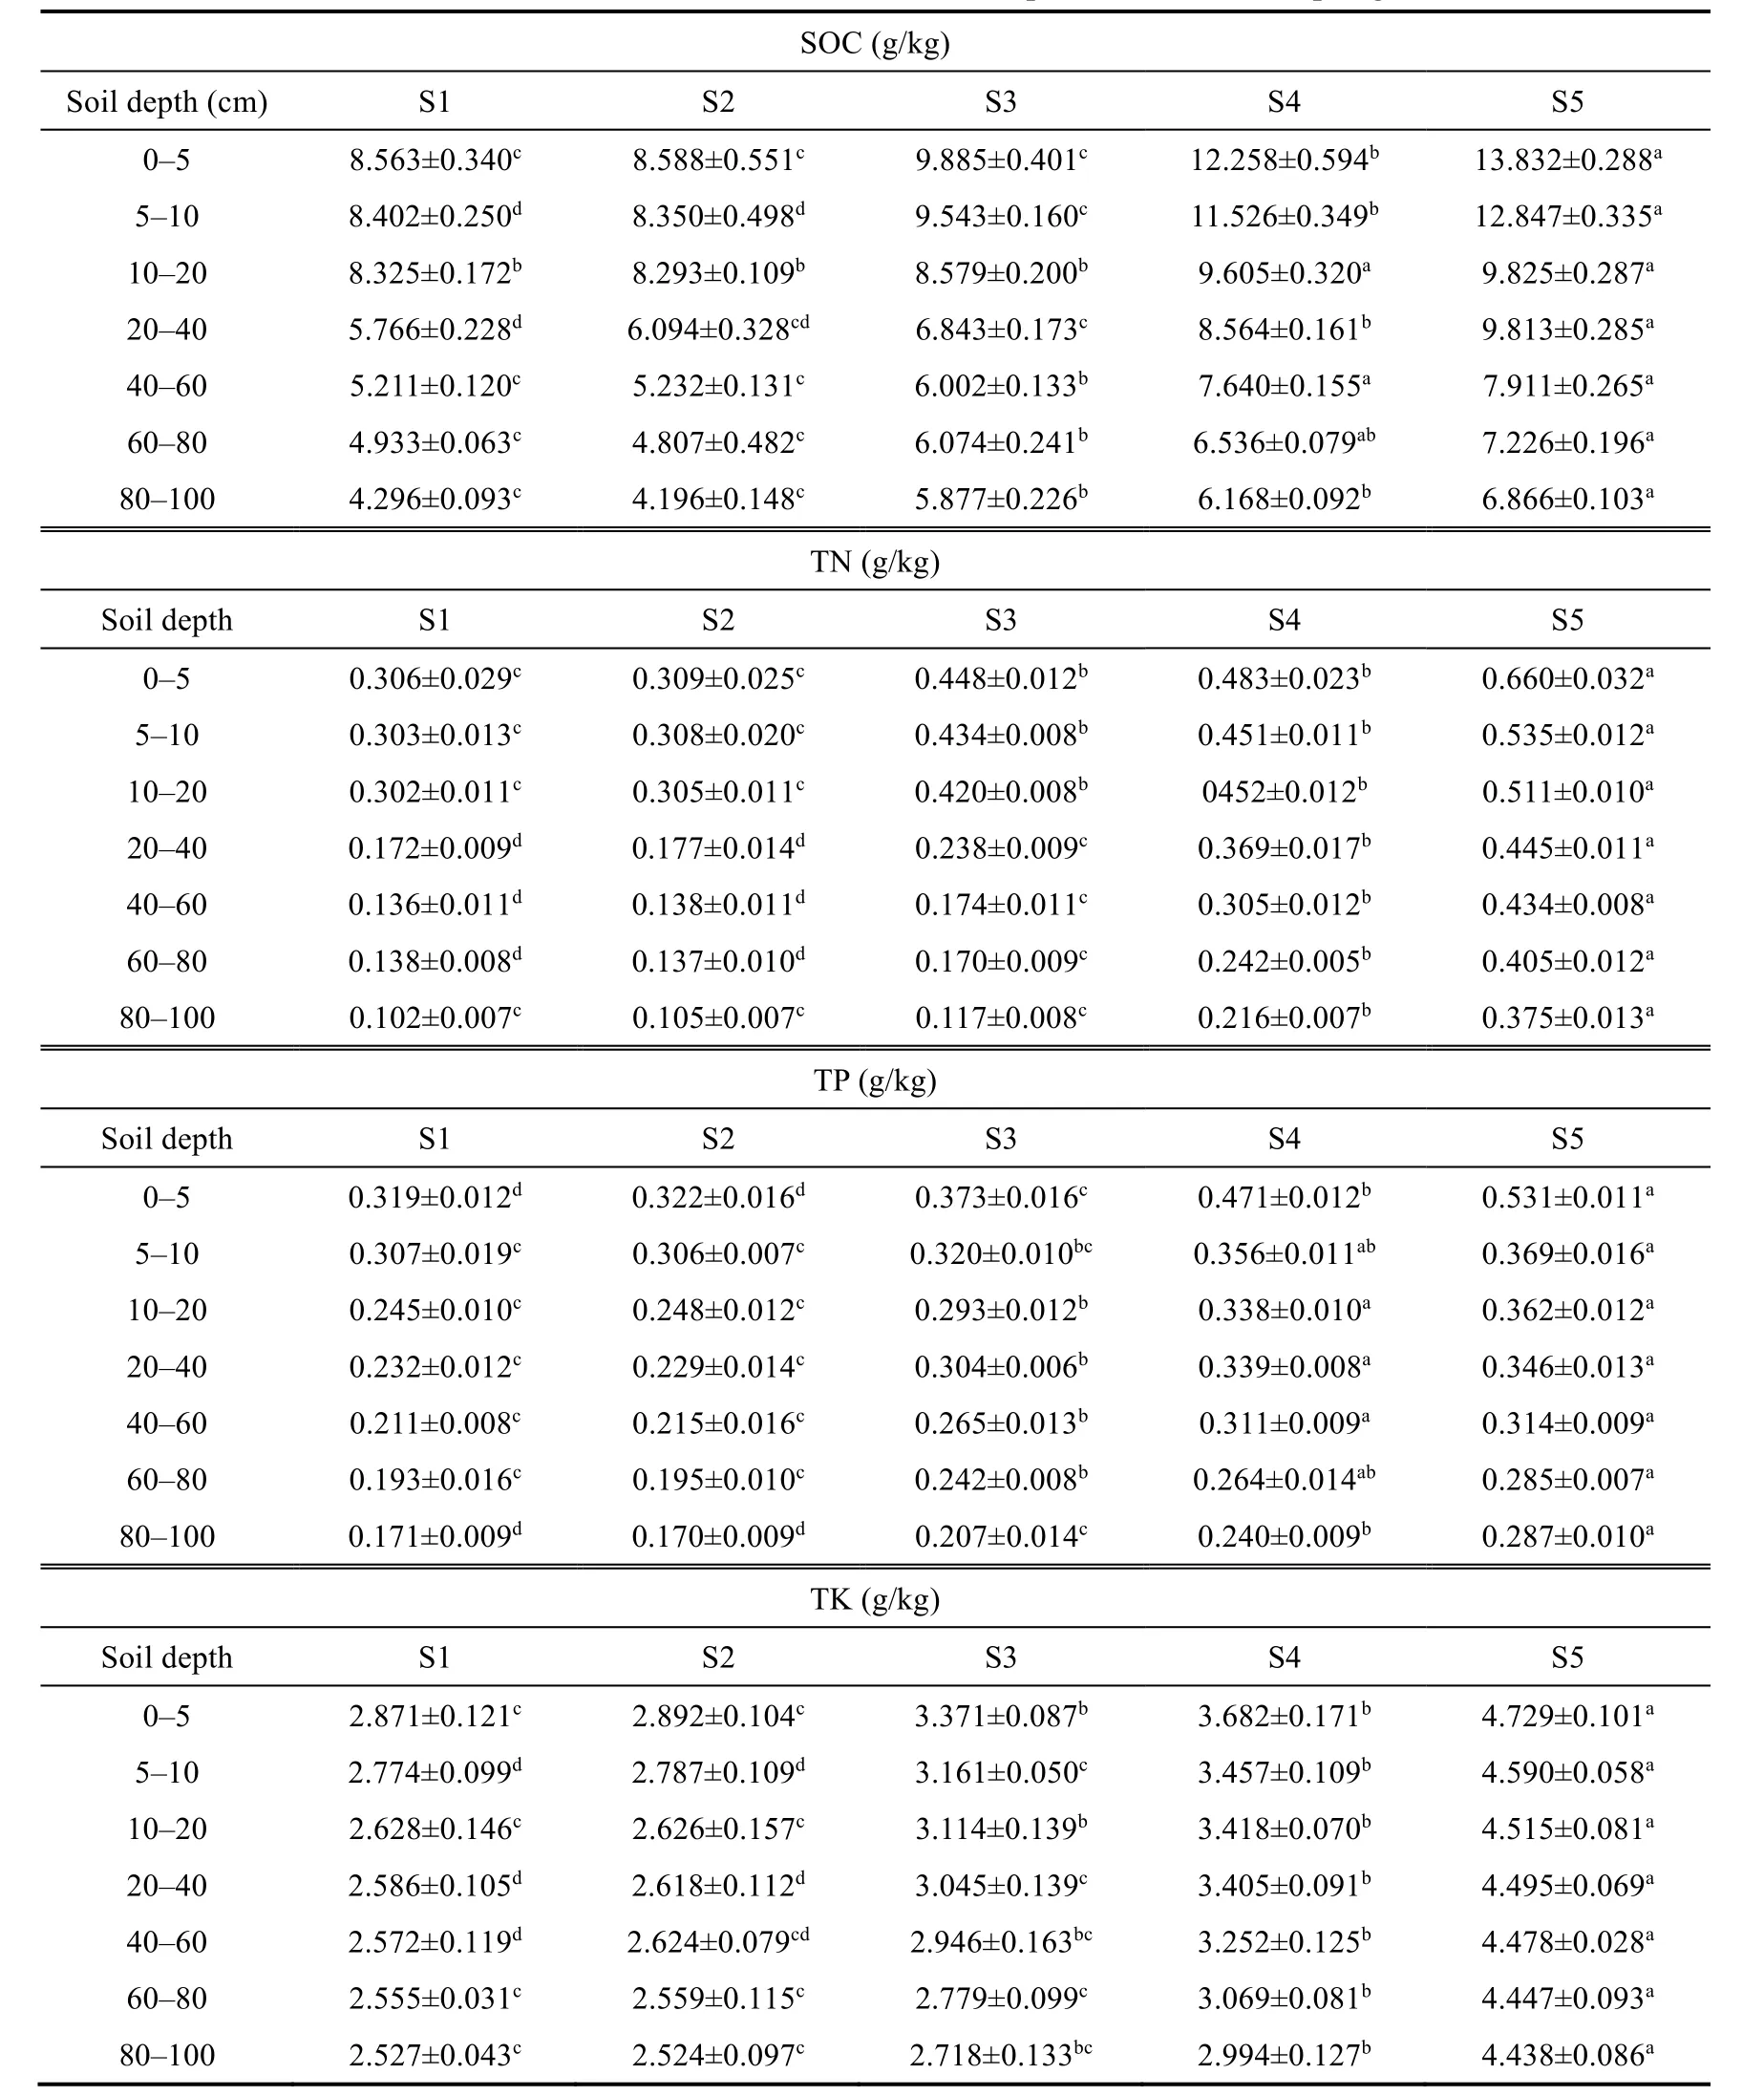
Table 3 Soil nutrient contents at different soil depths in the five sampling sites


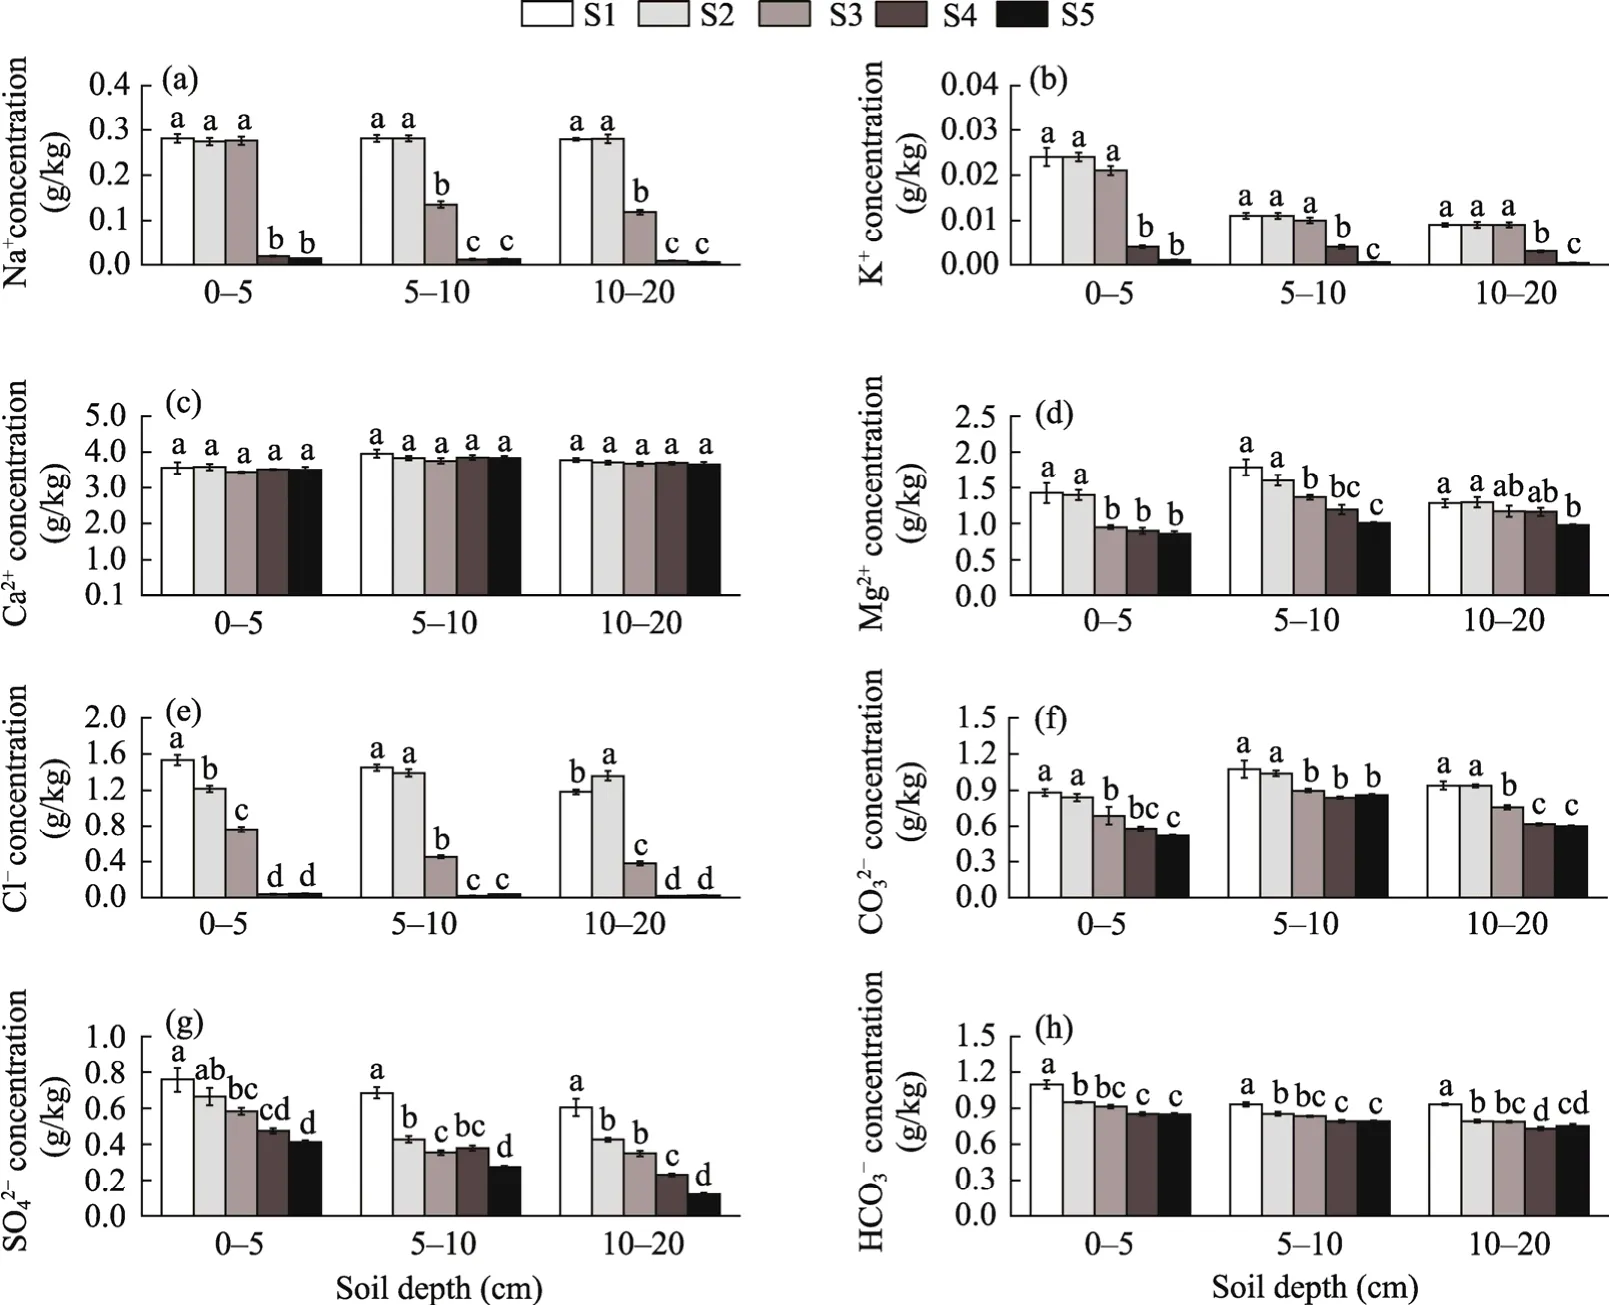
Fig. 2 Soil salt ions concentrations at different soil depths in the five sampling sites. S1-S5 are the five sampling sites. Different lowercase letters indicate significant differences among five sampling sites at same soil depth (P<0.05). Bars mean standard deviation. (a), Na+ concentration; (b), K+ concentration; (c), Ca2+ concentration;(d), Mg2+ concentration; (e), Cl- concentration; (f), CO32- concentration; (g), SO42- concentration; (h), HCO3-concentration.
3.4 Soil microbial biomass
SMB varied among the different sampling sites and soil depths. MBC, MBN, and MBP concentrations increased with distance from the Qarhan Salt Lake, and reached a maximum at S5.At S5, MBC, MBN, and MBP concentrations significantly increased by 66.3%, 72.4%, and 36.4%,respectively, in the 0-5 cm soil depth, and increased substantially by 72.6%, 62.7%, and 30.8%,respectively, in the 5-10 cm soil depth, and increased by 61.8%, 72.0%, and 65.1%, respectively,in the 10-20 cm soil depth, compared with S1 (Fig. 3). The variations in the MBC, MBN, and MBP concentrations in the different soil depths at the same site were complicated. MBC concentration tended to decrease with soil depth, and reduced to a minimum level in the 10-20 cm soil depth (Fig. 3a). Similarly, MBN concentration fell to a minimum value of 9.53, 9.66, 9.96,11.11, and 16.05 mg/kg in the 10-20 cm soil depth at sites S1-S5, respectively, and decreased by 20.8%, 21.0%, 45.5%, 42.3%, and 29.2% compared with the concentrations in the 0-5 cm soil depth (Fig. 3b), respectively. MBP concentration was highest in the 5-10 cm soil depth, followed by the 10-20 cm soil depth, and was lowest in the 0-5 cm soil depth (Fig. 3c). These results indicated that the distance from the Qarhan Salt Lake significantly influenced SMB, and there was variability among the different soil depths.
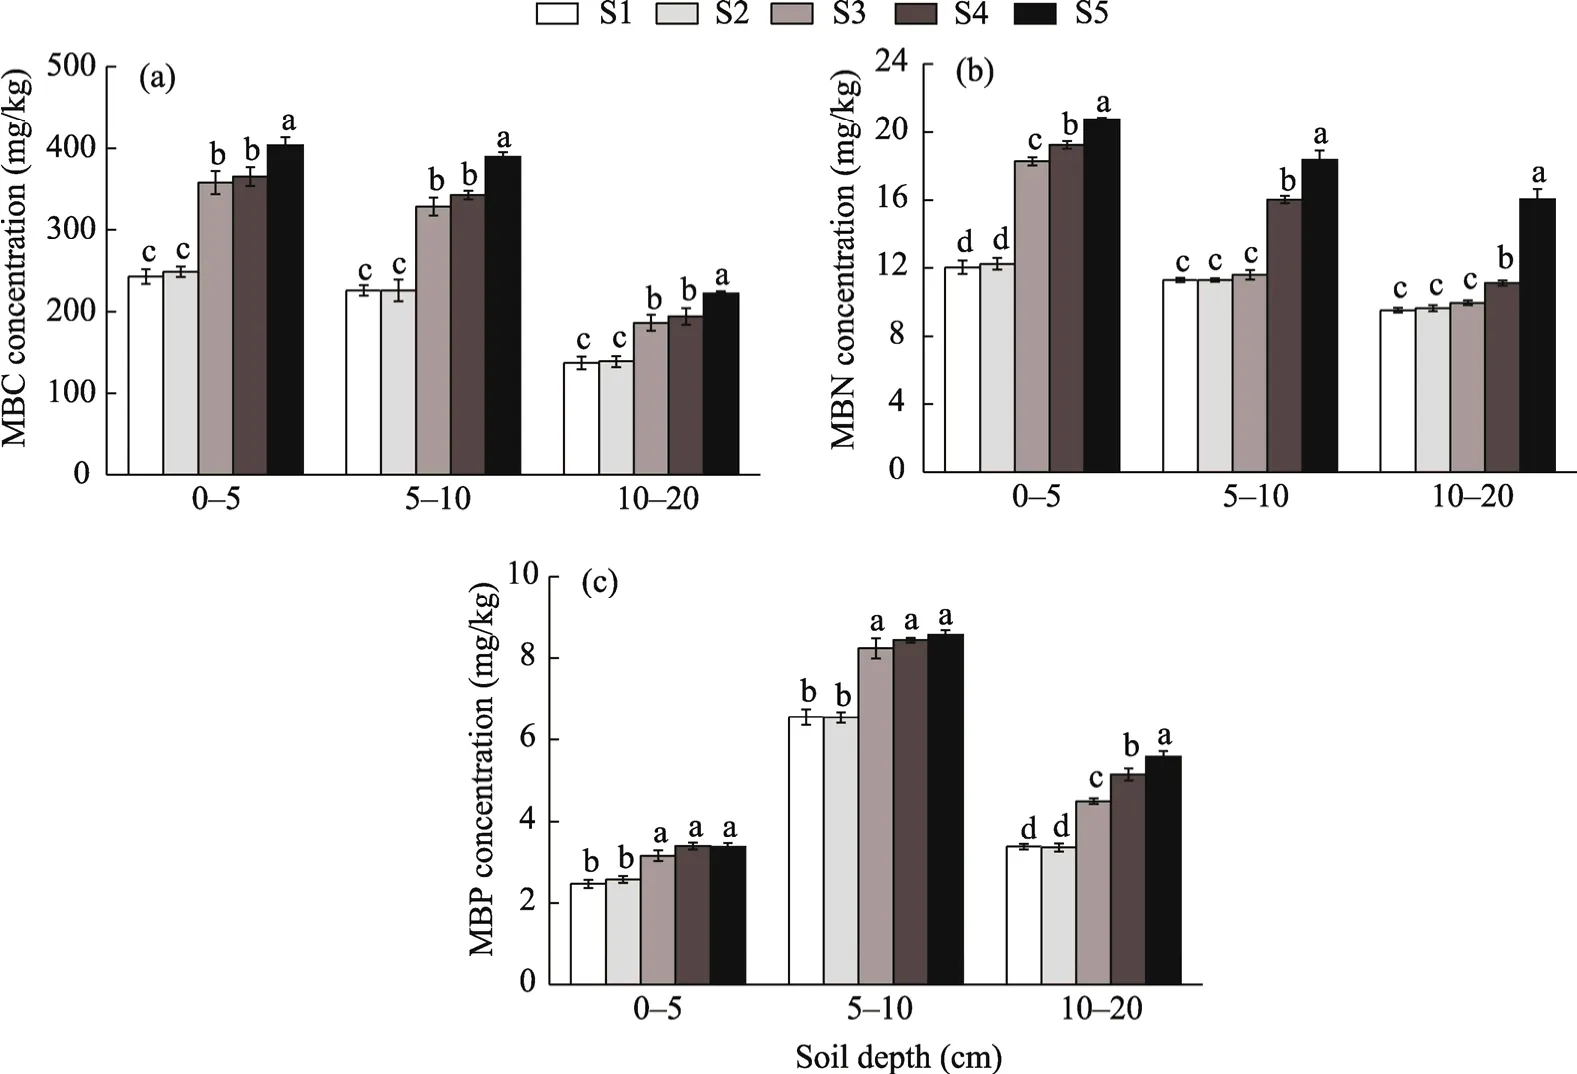
Fig. 3 Soil microbial biomass concentrations at different soil depths in the five sampling sites. S1-S5 are the five sampling sites. Different lowercase letters indicate significant differences among five sampling sites at same soil depth (P<0.05). Bars mean standard deviation. (a), microbial biomass carbon (MBC) concentration; (b),microbial biomass nitrogen (MBN) concentration; (c), microbial biomass phosphorus (MBP) concentration.
3.5 The relationship between environmental variables and soil physical-chemical properties
As shown in Figure 4, 58.18% of the cumulative variation in soil physical-chemical proprieties was explained by the first axis and 23.72% was explained by the second axis. According to the permutation test, the first (F=239.93,P<0.001), second (F=97.82,P<0.001), and third (F=34.37,P<0.01) canonical axes were highly significant in terms of soil physical-chemical properties(Table 4). Soil salt ions (Na+, K+, Ca2+, Mg2+, Cl-, SO42-, and HCO3-) were positively correlated with EC and SWC, but negatively correlated with altitude and soil depth (Fig. 4a). Unlike soil salt ions, soil nutrients and SMB concentrations (BMC, BMN, and BMP) were positively correlated with altitude, but negatively correlated with EC and SWC. The first axis explained 77.60% of the cumulative variation in soil nutrients and SMB concentrations, while only 2.34% was explained by the second axis (Fig. 4b). According to the permutation test, the first canonical axis was highly significant for soil nutrients and SMB concentrations (F=149.06,P<0.001; Table 4). Soil nutrients and SMB concentrations were negatively correlated with soil salt ions, with Cl-, Na+, K+, and SO42-having more influence than Ca2+, Mg2+, CO32-, and HCO3-on soil nutrient and SMB concentrations (Fig. 4b).
4 Discussion
EC can be used to compare different soils and is classified depending on the salinity hazard and its effects on the yield of field crops (Rengasamy, 2010). Our results indicated that most of sites were strongly saline (EC=8-16 dS/m) or very strongly saline (EC>16 dS/m), with the degree of salinity deceasing with distance from the Qarhan Salt Lake and soil depth. The decrease in salinity with distance from the Qarhan Salt Lake may be related to environmental factors (such as rainfall,temperature, altitude, and evaporation). The influence of soil depth may be due to salt accumulation.Salt accumulation tended to occur in the topsoil (0-20 cm), with some salt leaching downwards to the bottom of the soil (80-100 cm) (Yu et al., 2007; Zlotopolski, 2017). As with previous studies,pH results of this study indicated that the soil was likely to be saline-alkaline (pH>8.5) (van Beek and Tóth, 2012).
Our results indicated that distance from the Qarhan Salt Lake had a large influence on soil salt ion concentrations. Closer to the Qarhan Salt Lake, there was a greater salt ion accumulation in the soil. This may be related to water inflows into the Qarhan Salt Lake containing high levels of salt. Near the Qarhan Salt Lake (S1-S3), the lower altitude results in more perennial river water and spring water inflows into the lake or flowing through the soil (Zhang et al., 1993), which means that more salt will accumulate in these sites (Fan et al., 2015). The differences in climatic conditions (S1-S3 and S4-S5 have extremely arid desert and semi-arid climates, respectively) (Li et al., 2015; Luo et al., 2018) may also influence soil salt ion concentrations. The low annual mean temperature and high mean annual precipitation likely restricted the soil salt ion concentrations in the high altitude sites (S4 and S5). Hu et al. (2018) indicated that cation exchange and mineral dissolution/precipitation were key factors in the variation of the dynamic characteristics and evolution of brine, with evaporation and enrichment being the main mechanisms of underground brine evolution in a salt lake. Salt bearing rocks and eolian migration of salts were present in salt-affected locations with a deficit of moisture, but precipitation resulted in the redistribution of salts in the profiles of automorphic salt-affected soils (Pankova and Konyushkova, 2013). An increase in precipitation was usually accompanied by a decrease in the intensity of weathering and initial accumulation of salts, where salts entered low altitude regions with the runoff caused by precipitation. Our study showed that Na+, K+, Ca2+, Mg2+, Cl-, SO42-,and HCO3-were the main salts in the soil. This was due to rock salt (NaCl), sodium carnallite,gypsum (CaSO4?2H2O), calcite (CaCO3), feldspar (KAlSi3O8-NaAlSi3O8-CaAl2Si2O8), sylvine(KCl), and dolomite (CaMg(CO3)2) being the base minerals of the halide layer in the salt lake of the Qaidam Basin (Ye et al., 2015). The pattern of soil salt ion formation may have been affected by palaeoclimatic conditions, where the alternation of a dry climate and a relatively humid climate with wet events over the last millennium have significantly influenced the soil salinity(Chen et al., 2009). Soils differed in their percentage salt content as well as the degree and chemistry of salinization. The distribution of salts in the soil was mainly determined by the presence and properties of the salt bearing rocks and the eolian migration of salts (Hu et al.,2018).
Salinization can cause soil degradation, which had numerous negative effects on ecological and non-ecological soil functions (Daliakopoulos et al., 2016), especially the soil nutrient content.Our results showed that the SOC, TN, TP, and TK concentrations increased with distance from the Qarhan Salt Lake, while they decreased with soil depth. The salt content decreased with distance from the Qarhan Salt Lake and soil depth. There were several reasons why the soil nutrient content decreased with an increase in the soil salt content. First, the degree of salinity (salt content, salt composition, and salt crust thickness in the top layer of soil was higher in low altitude regions than that in high altitude regions due to the lower precipitation, higher evaporation, and more potential sources of saline ions with runoff or river water from high altitude regions (Li et al., 2015; Song et al., 2017; Luo et al., 2018). Generally, higher saline ion concentrations had an adverse impact on the improvement of soil qualities. Second, the nutrient cycling of soil would be inhibited due to the adverse effect of salinity on plants. As one of the most brutal environmental factors, salinity limited the productivity of plants, with most plants being sensitive to high salt concentrations in the soil, and the area of land affected by salt was increasing daily (Shrivastava and Kumar, 2015). A saline growth medium has been shown to affect almost all aspects of plant development and growth (Ashraf, 2004), and thus limits nutrient fixing, conversion, and storage in plants, which then degrades the soil quality. Third, soil salinity has affected the overall pattern of vegetation distribution in the Qaidam Basin, with the harsh climatic conditions and unique geographical location already being considerable environmental stresses on vegetation growth (Wang et al., 2018a). The vegetation distribution pattern was to some extent influenced by the nutrient status of the soil. The adverse impacts of increased salinity on soil nutrients could also occur through a decrease in soil biodiversity and microorganism activity (Singh, 2015). Soils were sensitive to salinity, with losses of carbon reported after both short- and long-term exposure (Servais et al., 2019). Depending on its form and stage of development, salinization seriously degraded the fertility of soil, ultimately eliminating all vegetation (JRC et al., 2012; Trnka et al., 2013). The SOC loss due to salinization had a negative feedback on soil fertility, microbial activity, and enzyme activities, which increased the dispersion of clay particles and led to higher wind and water erosion rates, therefore having a direct or indirect influence on soil nutrients (De la Paix et al., 2013; Singh, 2015).
Salinity can also regulate nitrogen cycling by significantly shaping the community structure of both nitrifiers and denitrifiers (Wang et al., 2018b). Our results also showed that the SMB was significantly affected by the salinity, with the microbial biomass decreasing in high-salt conditions. This reflected the fact that soil microorganisms were influenced by salinity. Rath et al.(2016) indicated that a range of microbial processes in soil were strongly inhibited by salinity,despite fungal growth being found to be less influenced by salts than bacterial growth. With an increase in salinity, the redox potential, electron acceptor availability, osmotic stress, and organic substrate quantity and quality will change, which will affect microbe-mediated biogeochemical processes (Chambers et al., 2014; Servais et al., 2019). The variation of these processes may ultimately influence soil nutrients (Flower et al., 2017) and the species composition of microbial communities (Ikenaga et al., 2011). Moreover, soil salinization was closely related to soil physicochemical properties, and soil nutrients were considered to be the key factor influencing the differences in soil salinization (Xie et al., 2019). Our results indicated that salinization had a negative effect on the content of soil available nutrients. One explanation of this negative effect was the decrease in soil organic matter under saline conditions, where plant inputs decreased due to scarce vegetation cover, while the enhancement of the activity of carbon-degrading extracellular enzymes and microbial decomposition rates will negatively affect soil available nutrients (Morrissey, 2014). In fact, a saline soil was likely to have a low organic matter content because of the decreased plant input rather than the increased decomposition (Setia et al., 2013).
5 Conclusions
Our results indicated that most of the sites from the Qarhan Salt Lake to the Xidatan segment were strongly saline or very strongly saline. The main salt ions present in the soil were Na+, K+,and Cl-. Comparative data collected along salt gradients from the Qarhan Salt Lake to the Xidatan segment suggested that salinity decreased with increasing altitude and soil depth. The SOC, TN,TP, and TK concentrations increased with altitude. SMB were influenced by salinity, with SMB concentration decreasing under high-salt conditions and being significantly affected by the salinity. In the future, there is a need to determine how the diversity and composition of microorganisms vary across salinity gradients within the extremely arid desert climate playa(Qarhan Salt Lake) in the center of the southern Qaidam Basin, northern China. Specifically, there is a need to understand how the salt ions, soil nutrients, and SMB work together so that we can understand the relationships among them.
Acknowledgements
This work was jointly supported by the National Natural Science Foundation of China (41621001,32061123006) and the Fund of Ningxia Independent Innovation on Agriculture Science and Technology, China (NGSB-2021-14-04).
- Journal of Arid Land的其它文章
- Erratum to: Dieback intensity but not functional and taxonomic diversity indices predict forest productivity in different management conditions: Evidence from a semi-arid oak forest ecosystem
- Erratum to: Predicting of dust storm source by combining remote sensing, statistic-based predictive models and game theory in the Sistan watershed,southwestern Asia
- Effects of vegetation near-soil-surface factors on runoff and sediment reduction in typical grasslands on the Loess Plateau, China
- Effects of climate change and land use/cover change on the volume of the Qinghai Lake in China
- Adjustment of precipitation measurements using Total Rain weighing Sensor (TRwS) gauges in the cryospheric hydrometeorology observation (CHOICE)system of the Qilian Mountains, Northwest China
- Identifying water vapor sources of precipitation in forest and grassland in the north slope of the Tianshan Mountains, Central Asia

