Effects of climate change and land use/cover change on the volume of the Qinghai Lake in China
WANG Hongwei, QI Yuan, LIAN Xihong, ZHANG Jinlong, YANG Rui, ZHANG Meiting
1 Key Laboratory of Remote Sensing of Gansu Province, Northwest Institute of Eco-Environment and Resources, Chinese Academy of Sciences, Lanzhou 730000, China;
2 School of Resource and Environmental Sciences, Wuhan University, Wuhan 430079, China;
3 Qinghai Ecological and Environmental Monitoring Center, Xining 810007, China
Abstract: Qinghai Lake is the largest saline lake in China. The change in the lake volume is an indicator of the variation in water resources and their response to climate change on the Qinghai-Tibetan Plateau(QTP) in China. The present study quantitatively evaluated the effects of climate change and land use/cover change (LUCC) on the lake volume of the Qinghai Lake in China from 1958 to 2018, which is crucial for water resources management in the Qinghai Lake Basin. To explore the effects of climate change and LUCC on the Qinghai Lake volume, we analyzed the lake level observation data and multi-period land use/land cover (LULC) data by using an improved lake volume estimation method and Integrated Valuation of Ecosystem Services and Trade-offs (InVEST) model. Our results showed that the lake level decreased at the rate of 0.08 m/a from 1958 to 2004 and increased at the rate of 0.16 m/a from 2004 to 2018. The lake volume decreased by 105.40×10⁸ m3 from 1958 to 2004, with the rate of 2.24×10⁸ m3/a, whereas it increased by 74.02×10⁸ m3 from 2004 to 2018, with the rate of 4.66×10⁸ m3/a. Further,the climate of the Qinghai Lake Basin changed from warm-dry to warm-humid. From 1958 to 2018, the increase in precipitation and the decrease in evaporation controlled the change of the lake volume, which were the main climatic factors affecting the lake volume change. From 1977 to 2018, the measured water yield showed an "increase-decrease-increase" fluctuation in the Qinghai Lake Basin. The effects of climate change and LUCC on the measured water yield were obviously different. From 1977 to 2018, the contribution rate of LUCC was -0.76% and that of climate change was 100.76%; the corresponding rates were 8.57% and 91.43% from 1977 to 2004, respectively, and -4.25% and 104.25% from 2004 to 2018,respectively. Quantitative analysis of the effects and contribution rates of climate change and LUCC on the Qinghai Lake volume revealed the scientific significance of climate change and LUCC, as well as their individual and combined effects in the Qinghai Lake Basin and on the QTP. This study can contribute to the water resources management and regional sustainable development of the Qinghai Lake Basin.
Keywords: climate change; land use/cover change; water yield; lake volume; contribution rate; Qinghai Lake Basin;Qinghai-Tibetan Plateau
1 Introduction
Lakes and other water resources are extremely sensitive to climate change due to global warming and increasing human activities (Adrian et al., 2009). These changes considerably affect the ecological environment protection and resource management (Ma et al., 2010; Duan and Xiao,2015; Satgé et al., 2017; Wang and Qin, 2017; Lehnherr et al., 2018; Qiao et al., 2019; Zhang et al., 2019; Yu et al., 2021). Over the past few decades, the levels of a large number of lakes around the world have dramatically declined, and even some lakes have dried up because of drought (Li et al., 2006; Sellinger et al., 2008; Satgé et al., 2017; Tal, 2019), which has adversely affected the security and biodiversity of lake ecosystem (da Costa et al., 2016). In China, lakes are rich in biodiversity but are unevenly distributed. The distribution pattern of lakes has been investigated in detail in various studies (Zhang et al., 2019). With climate change due to global warming and rapid economic development, the distribution pattern and area of China's lakes have changed,exhibiting divergent regional trends (Tao et al., 2020). Although several detailed surveys have been conducted, the factors responsible for causing these changes remain unknown (Zhang et al.,2019; Tao et al., 2020). Diverse factors can drive the changes in each lake either individually in the form of natural factors or in the form of human activities or in combination (Cui and Li,2016). Variations in the lake volume and lake level are the key indicators of the hydrological effects of climate change and land use/cover change (LUCC) (van der Kamp et al., 2008; Luo et al., 2020). Furthermore, considerable attention has been paid to the complexity of the interaction between climate change and land use/land cover (LULC) patterns (Piao et al., 2010). In the recent decades, the global climate has changed remarkably (Wang et al., 2018a), which includes changes in the intensity and frequency of precipitation, wind speed, and air temperature (Méndez-Tejeda et al., 2016). In addition, changes in LULC structures, which directly affect evapotranspiration, soil moisture, and groundwater supply, have led to seasonal or long-term imbalance between the inflow and outflow of the lake, thereby causing fluctuations in the lake volume (Rodriguez-Iturbe,2000; Zohary and Ostrovsky, 2011). Hydrological station observation and remote sensing technology are generally used to determine variations in the lake volume (Medina et al., 2010;Duan and Bastiaanssen, 2013; Wang, 2020). Lake volume change is estimated based on the difference between the inflow and outflow of the lake from hydrological station observation data(Méndez-Tejeda et al., 2016). Advanced remote sensing technology, especially satellite altimetry technology, has been widely used in the lake level monitoring in the regions where the hydrological station data are unavailable (Zhang et al., 2011a). The variation in the lake volume can be estimated by combining the lake area and water balance equation (Medina et al., 2010;Duan and Bastiaanssen, 2013; Zhang et al., 2018; Wang, 2020).
The Qinghai-Tibetan Plateau (QTP) is the highest in the world and referred to as "the roof of the world" and "the third pole". This region is sensitive to global climate change (Yao et al.,2000). The QTP serves the role of "the world's water tower" because water resources in this region are present in the forms of glaciers, snowpacks, lakes, and rivers (Xu et al., 2008). It is the headstream region of many large rivers that nourish hundreds of millions of people throughout Asia (Qiao et al., 2019). There are more than 1200 alpine lakes with an area greater than 1.00 km2on the QTP (Li et al., 2019). The variation in the lake volume is of great significance to the hydrological cycle, regional water security, and ecosystem healthy. However, the contributions of driving factors such as precipitation runoff, melt-water runoff, lake surface precipitation, and lake evaporation to the lake volume change vary significantly across different regions (Zhou et al.,2015, 2021; Zhong, et al., 2020).
The Qinghai Lake is the largest saline lake on the QTP and is also an important ecological security barrier in the northeastern part of the QTP. This lake provides not only a suitable habitat for precious birds, fish, and rare animals in China but also important economic, recreational, and aesthetic values to the human society (Xiao et al., 2018; Kraemer et al., 2020). Moreover, the water budget of the Qinghai Lake directly reflects the change in water resources and their response to climate change, and thus, it is an important indicator of the response to climate change. The decline in the lake level is a major ecological and environmental problem in the Qinghai Lake Basin, as the lake's ecosystem is extremely fragile and sensitive to global climate change and human activities (Li et al., 2009). Many studies have investigated the changes in the level, volume,and area of the Qinghai Lake, and the response of the lake to climate change (Li, et al., 2006; Jin et al., 2010, 2013; Zhu et al., 2014; Cui and Li, 2016; Wang et al., 2018b; Zhang et al., 2018; Su et al., 2019; Li et al., 2020). During 1961-2012, the Qinghai Lake level first decreased and then increased, and the change in the lake level was mainly affected by precipitation and evaporation(Cui and Li, 2016). The change in the lake level was strongly and positively correlated with surface runoff and precipitation and negatively correlated with evaporation. Moreover, water consumption due to human activities had a negligible effect on the decline in the lake level (Li et al., 2006). The changing trend of the lake area was consistent with that of the lake level, in which the lake area continued to decrease from 1986 to 2003 and increase from 2003 to 2017 (Han et al.,2019). During 2001-2016, the lake volume also showed an increasing trend that was driven by increased precipitation and decreased evaporation (Zhang et al., 2018).
However, long-term changes in the lake volume and the comprehensive effects of climate change and LUCC on the Qinghai Lake volume have not been investigated yet, which limited the comprehensive evaluation of the Qinghai Lake Basin, eventually affecting the ecological protection and restoration, as well as the management and sustainable utilization of regional water resources. In the present study, we focused on the changes in the level of the Qinghai Lake and its response to climate change, as well as the changes in the lake volume and lake area. Specifically,we analyzed and discussed the changes in local climate and LULC and their effects on the lake volume in the Qinghai Lake Basin based on the long-term observation data of the lake level and climate, as well as the multi-period LULC data. The main objectives of this study are as follows:(1) analysis of the characteristics of changes in the lake level and lake volume, climate, and LULC from 1958 to 2018 in the Qinghai Lake Basin and (2) quantitative assessment of the contribution rates of climate change and LUCC on the Qinghai Lake volume.
2 Materials and methods
2.1 Study area
Qinghai Lake is the largest saline lake in China and is located in the northeastern part of the QTP.The maximum depth of the lake is 25.5 m, and its volume is 716.00×10⁸m3(Zhang et al., 2011b).The Qinghai Lake Basin is located between 36°17?-38°19?N and 97°48?-101°11?E, with an average altitude of 3720 m and an area of 29,670.70 km2. Qinghai Lake is a closed lake, and more than 50 rivers flow into this lake, with the main rivers being Buha River, Shaliu River, Quanji River, Haergai River, and Heima River (Fig. 1). The Qinghai Lake Basin is characterized by a typical plateau continental climate, which is affected by the East Asian monsoon, Indian monsoon, and westerly atmospheric flow (Li et al., 2006). The basin has low air temperature and less precipitation. East wind or southeast wind prevails in the summer, whereas westerly wind prevails in the winter. The soil types are mountain meadow soil, chestnut soil, and boggy soil. The alpine meadow is the most widely distributed vegetation community in the basin, and the coldand drought-resistant warm grassland communities constitute the vegetation base zone of the basin. The forests and shrubs are distributed sporadically or in bands, with small area.
2.2 Data
2.2.1 Meteorological data
Meteorological data from 1958 to 2018 were obtained from the Gangca, Tianjun, Haiyan, and Gonghe meteorological stations in the four counties surrounding the Qinghai Lake Basin. In addition, the data of meteorological stations around the Qinghai Lake were collected as the input parameters of the Integrated Valuation of Ecosystem Services and Trade-offs (InVEST) model.The observational elements included daily air temperature, precipitation, evaporation, relative humidity, wind speed, and sunshine duration. The dataset was obtained from the China Meteorological Data Service Centre (http://data.cma.cn).
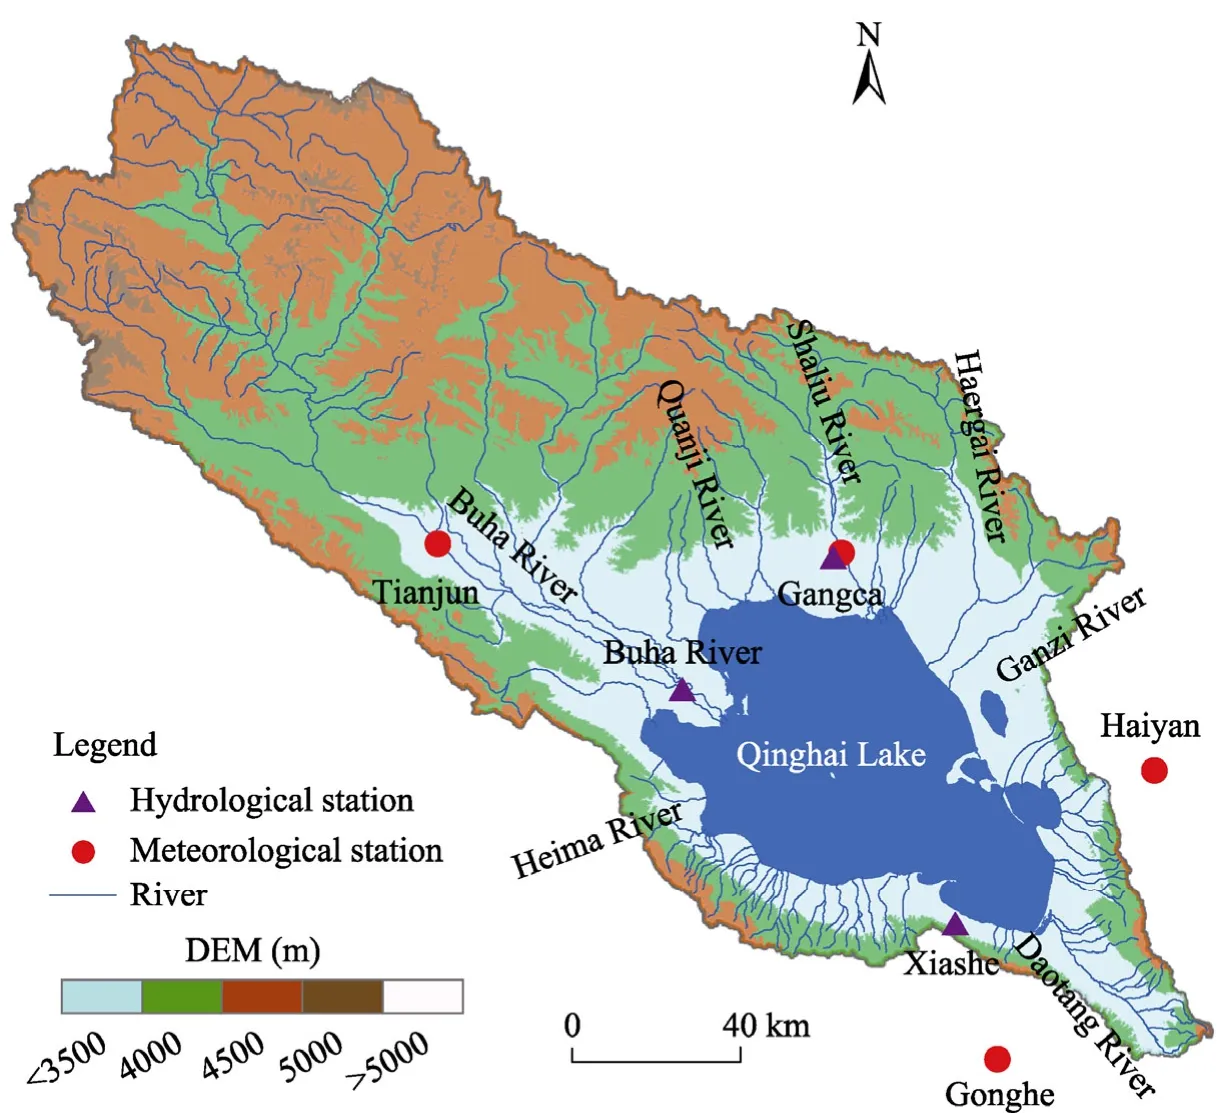
Fig. 1 Overview of the Qinghai Lake Basin. DEM, digital elevation model.
2.2.2 Hydrological data
Hydrological data were obtained from the hydrological stations, namely Buha River hydrological station, Gangca hydrological station, and Xiashe hydrological station. The observational data of the lake level from 1958 to 2018 were obtained from the Xiashe hydrological station. The dataset was provided by the Qinghai Hydrology and Water Resources Survey Bureau, China.
2.2.3 Land use/land cover (LULC) data
LULC data of multiple periods were obtained from the Landsat Thematic Mapper (TM),Enhanced Thematic Mapper (ETM), and Operational Land Imager (OLI) images through manual visual interpretation. The images were provided by the United States Geological Survey(https://earthexplorer.usgs.gov). Currently, LULC data in the Qinghai Lake Basin are available for a total of six periods (1977, 1987, 2000, 2004, 2010, and 2018) during 1977-2018, with the spatial resolution of 30 m. LULC types were divided into cultivated land, grassland, woodland,water bodies, construction land, and unused land, which constituted a total of six first-level categories and the corresponding 20 second-level categories.
2.2.4 Other data
The lake area data of 13 periods during 1977-2018 were from the lake dataset (1970s-2018) in the study of Zhang et al. (2019). The dataset was provided by the National Tibetan Plateau Data Centre(http://data.tpdc.ac.cn), with the spatial resolution of 30 m. Digital elevation model (DEM) data were based on the Shuttle Radar Topography Mission (SRTM) data published by the National Aeronautics and Space Administration (https://srtm.csi.cgiar.org), with a resolution of 30 m.
2.3 Methods
2.3.1 Water yield model
Water yield was simulated using the water yield module of the InVEST model, which calculated the annual water yield based on the Budyko hypothesis of water-energy coupled balance (Budyko,1974):
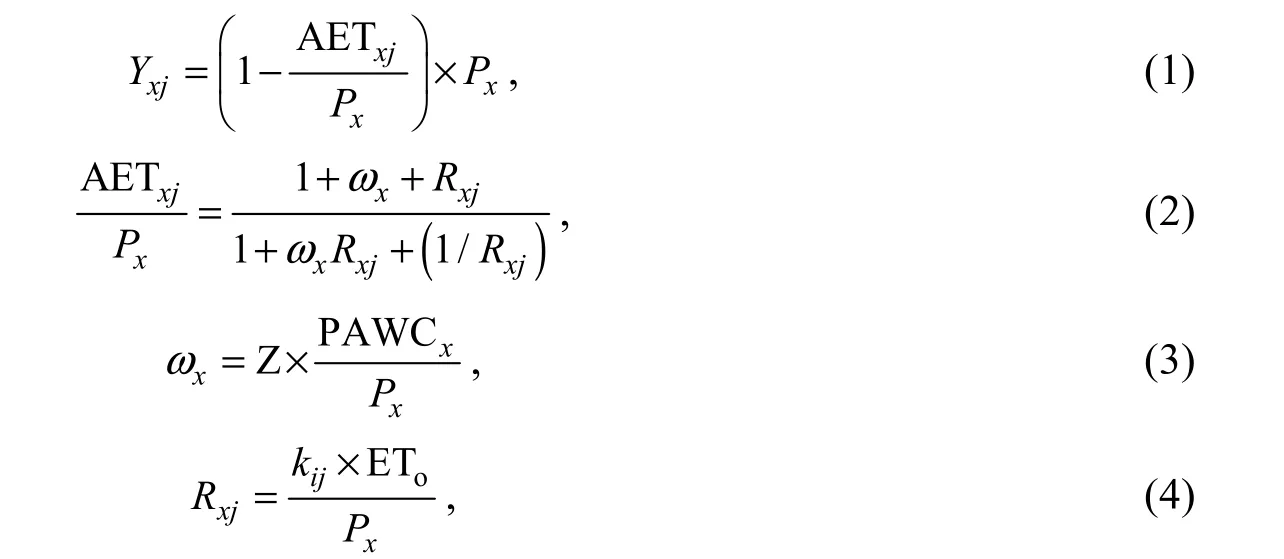
whereYxjis the average annual water yield of grid unitxon LULC typej(mm); AETxjis the actual evapotranspiration on gridxof LULC typej(mm);Pxis the annual precipitation on gridx(mm);Rxjis the Budyko dryness index of grid unitxon LULC typej;ωxis the ratio of available water of modified vegetation to expected precipitation; Z is an empirical parameter, and the Z value of the Qinghai Lake Basin is 8.5 (Lian et al., 2020); PAWCxis the available water content of vegetation on grid unitx(%);kijis the vegetation evapotranspiration coefficient; and ETois the reference evapotranspiration (mm). Based on the InVEST model, we simulated the water yield of the Qinghai Lake Basin in six periods (1977, 1987, 2000, 2004, 2010, and 2018) during 1977-2018. Relevant studies have been performed on the input parameter correction and result verification of the InVEST model (e.g., Lian et al., 2020). In this study, we verified the simulation results based on the water resources data provided by the Bulletin of Qinghai Province Water Resources, China.
2.3.2 Method for estimating the lake volume
The relationship between the lake level and lake area was fitted by combining the lake area of multi-phase remote sensing interpretation and the mean annual lake level observed by hydrological stations. Based on the fitted lake level-area relationship, we estimated the lake area using the observed lake level data. The variation in the lake volume was estimated using the improved water balance equation of the Qinghai Lake (Zhang et al., 2018).

whereAis the lake area (km2);His the lake level (m); a, b, and c are the lake level-area fitting coefficients; ΔVis the change value of the lake volume (m3);H1andH2are the lake levels in different periods from 1958 to 2018 (m); andA1andA2are the lake areas in different periods from 1958 to 2018 (km2).
2.3.3 Contribution rates of climate change and LUCC on the lake volume change
To quantitatively evaluate the effects of climate change and LUCC on the lake volume change, we determined the influences of climate change and LUCC on the water yield. Different scenarios were designed for analyzing the effects of climate change and LUCC on the annual water yield.Specifically, in Scenario 1, the climate data of different years and LULC data of 1977 were used to simulate the water yield of each period. In Scenario 2, the climate data of 1977 and LULC data of different years were used to simulate the water yield of each period. The contribution rates of climate change and LUCC to the water yield were calculated by combining the two scenarios, and the formulas are as follows (Lang et al., 2017; Yang et al., 2021):

whereRlis the contribution rate of LUCC (%);Rpis the contribution rate of climate change (%);ΔPis the change in the water yield of Scenario 1 (m3); and Δlis the change in the water yield of Scenario 2 (m3).
2.3.4 Mann-Kendall (M-K) test method
The M-K test method is a nonparametric test approach (Mann, 1945; Kendall, 1975) that is used to accurately determine the abrupt changes and trends of the overall time series. This method is widely used in time series trend analysis of environmental factors in different research fields,such as hydrology and meteorology (Yue et al., 2003). In this study, the abrupt change points of climatic factors and lake level were analyzed using the M-K test method.
3 Results
3.1 Changes in the level, area, and volume of the Qinghai Lake
The changes in the Qinghai Lake level were significant from 1958 to 2018 (Fig. 2). Specifically,from 1958 to 2004, the lake level continued to decrease, and the difference between the highest(3196.52 m in 1959) and lowest (3192.86 m in 2004) lake levels was 3.66 m. After 2004, the lake level began increasing and reached 3195.41 m in 2018, which was 2.55 m higher than that in 2004. As shown in Figure 2, the mean annual lake level was 3194.41 m during the whole study period. According to the M-K test, an abrupt change in the lake level occurred in 2004. From 1958 to 2004, the mean annual lake level was 3194.53 m, which decreased significantly at the rate of 0.08 m/a. From 2004 to 2018, the lake level increased at the rate of 0.16 m/a, with the mean annual lake level of 3193.91 m. The annual lake level was higher than the mean annual lake level from 1958 to 1979, lower than the mean annual lake level from 1979 to 2014, and again higher than the mean annual lake level from 2015 to 2018.
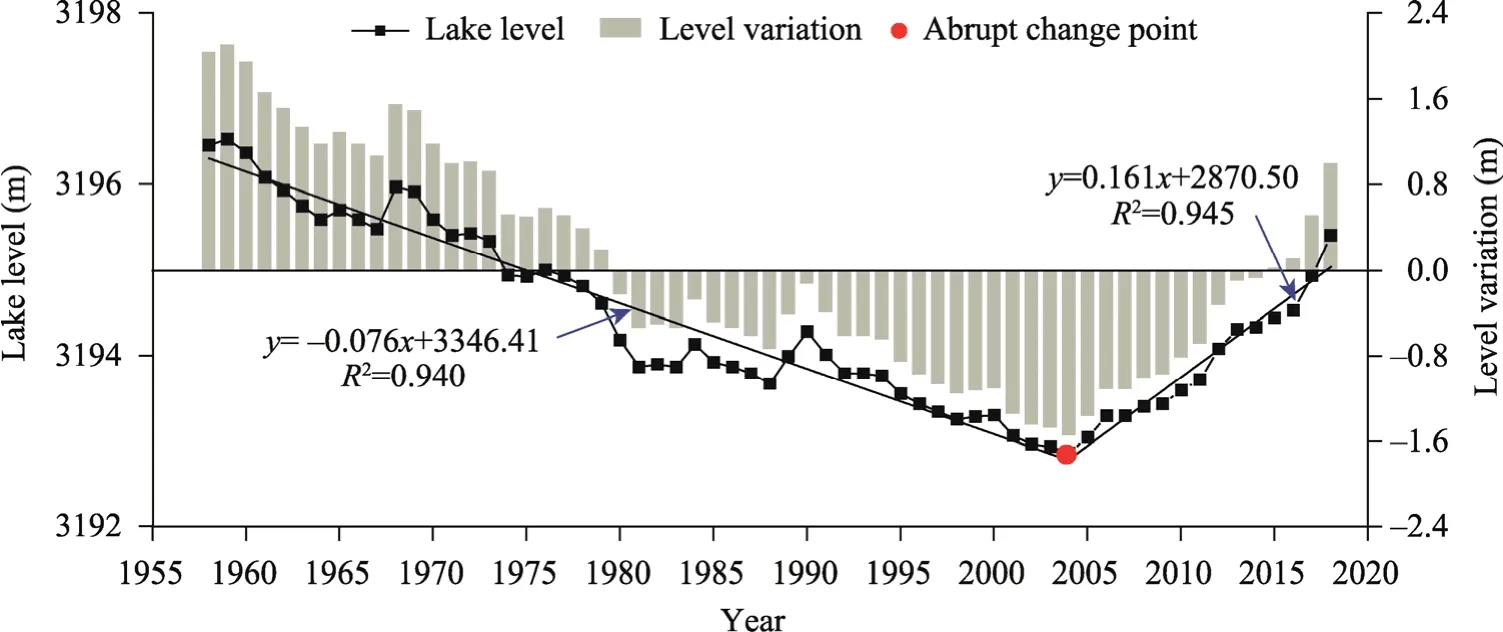
Fig. 2 Changes in the annual lake level of the Qinghai Lake from 1958 to 2018
Based on the lake area data of 13 periods during 1977-2018 and the mean annual lake level data in the corresponding years, we fitted the relationship between the lake level and lake area. As shown in Figure 3, the fitting accuracy was high (R2=0.925). Then, according to the fitted relationship between the lake level and lake area, we calculated the lake area of each year from 1958 to 2018 using the observed mean annual lake level data from the hydrological stations. The analysis showed that the lake area was the largest in 1958 (4621.96 km2). The area continued to shrink from 1958 to 2004 and decreased to 4117.51 km2in 2004, with the decreasing rate of 8.67 km2/a. After 2004, the lake area continued to increase at the rate of 14.56 km2/a and reached 4483.47 km2in 2018.
Using the lake level and lake area data, we calculated the cumulative and yearly changes in the lake volume from 1958 to 2018 using the improved calculation method of the lake volume (Eq.6). From 1958 to 2004, the cumulative lake volume changed significantly and decreased by 105.40×10⁸m3, with the rate of 2.24×10⁸m3/a (Fig. 4). After 2004, the lake volume began increasing, but it still decreased by 1.37×10⁸m3in 2018 compared with that in 1958; however, it increased by 74.02×10⁸m3in 2018 compared with that in 2004, with the increasing rate of 4.66×10⁸m3/a. The changes in the yearly lake volume fluctuated between -12.37×10⁸and 14.66×10⁸m3. The increase in the yearly lake volume was the highest during 1967-1968(14.66×10⁸m3), followed by that during 2017-2018 (14.11×10⁸m3). The decrease in the yearly lake volume was the highest during 1979-1980 (-12.37×10⁸m3), followed by that during 1973-1974 (-11.74×10⁸m3).
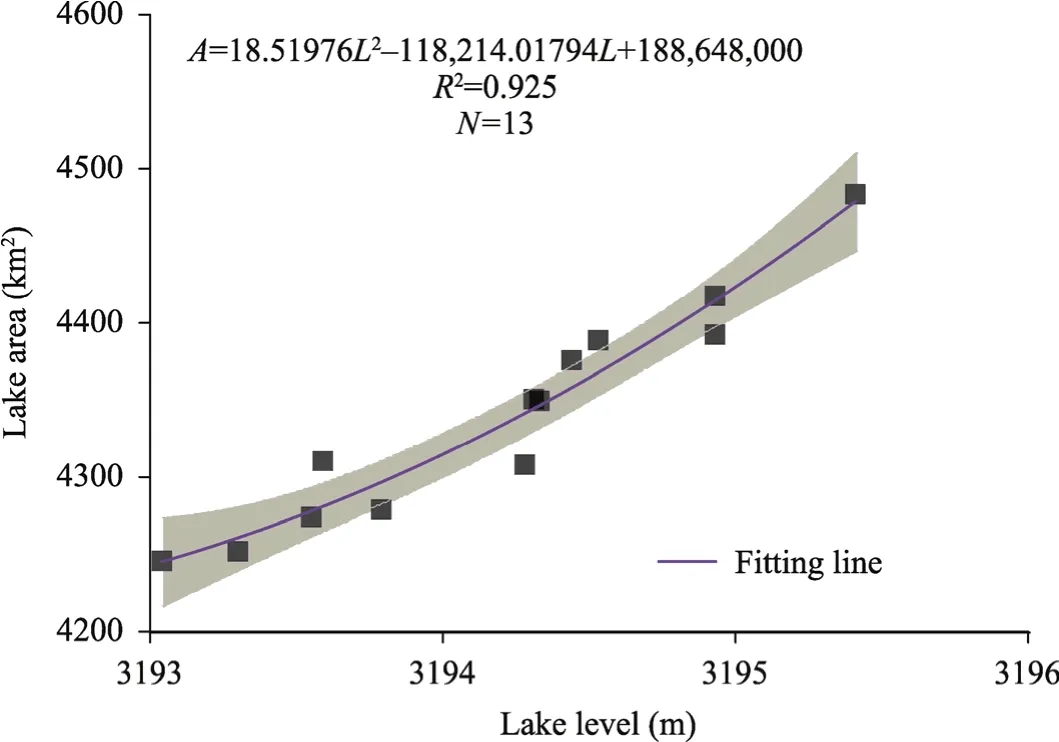
Fig. 3 Fitting curve of the relationship between the lake area and lake level of the Qinghai Lake. A, lake area; L,lake level; N, the number of years. Shaded areas represent 95% confidence intervals.
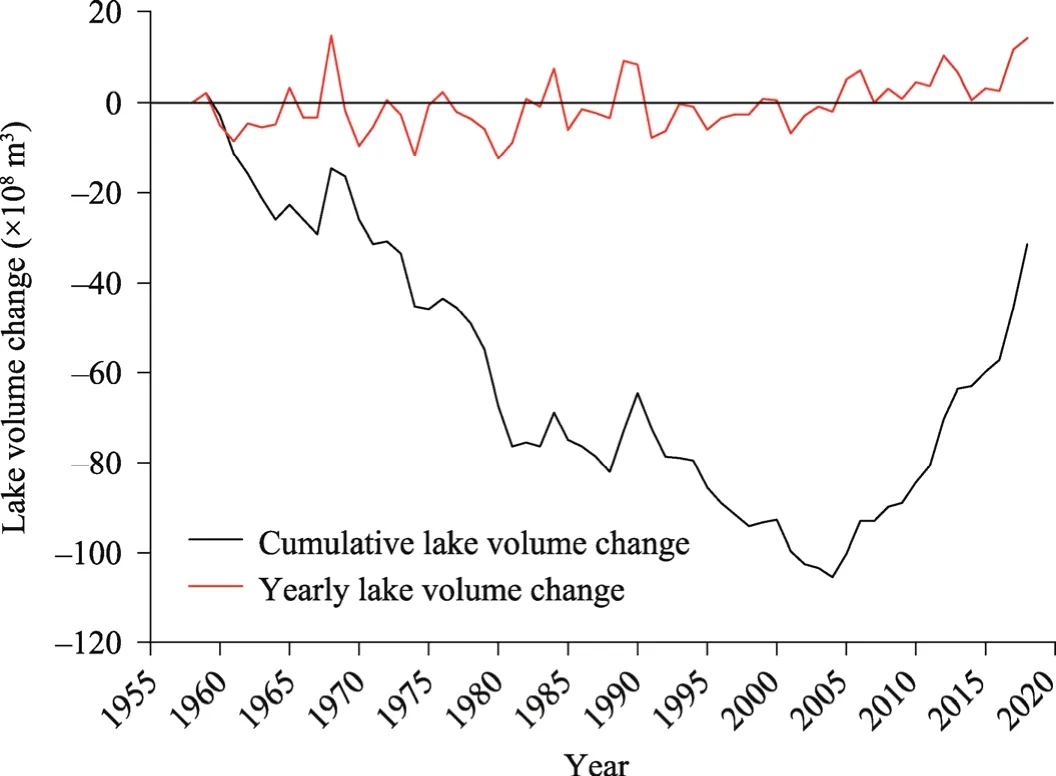
Fig. 4 Lake volume change curves of the Qinghai Lake from 1958 to 2018. The cumulative lake volume change is the change in the lake volume in every year relative to the year 1958. The yearly lake volume change is the change in the lake volume in every year relative to the previous year.
3.2 Climate change in the Qinghai Lake Basin
The mean annual air temperature in the Qinghai Lake Basin from 1958 to 2018 was -0.072°C.The lowest and highest annual temperature values were -1.440°C (in 1967) and 1.470°C (in 2016), respectively. The annual temperature increased significantly from 1958 to 2018, with the rate of 0.030°C/a (Fig. 5a). An abrupt change in the annual temperature (M-K test) occurred in 1997. The annual temperature increased from 1958 to 1996 (at the rate of 0.014°C/a), with the mean annual temperature of -0.466°C. Most of the annual temperature values during 1958-1996 were lower than -0.072°C. The annual temperature increased faster from 1997 to 2018 (at the rate of 0.039°C/a) than from 1958 to 1996 (at the rate of 0.014°C/a), with the mean annual temperature of 0.627°C. The annual temperature values were all higher than -0.072°C during 1997-2018, except for 2000.
Strangely, some thrushes have straight beaks51, despite the words of the princess in the tale. Thrushes are celebrated in literature for their song (Alsop III 592), but can also be a symbol of sorrow as in Whitman s When Lilacs Last in the Dooryard Bloomed or even wisdom as in The Hobbit.
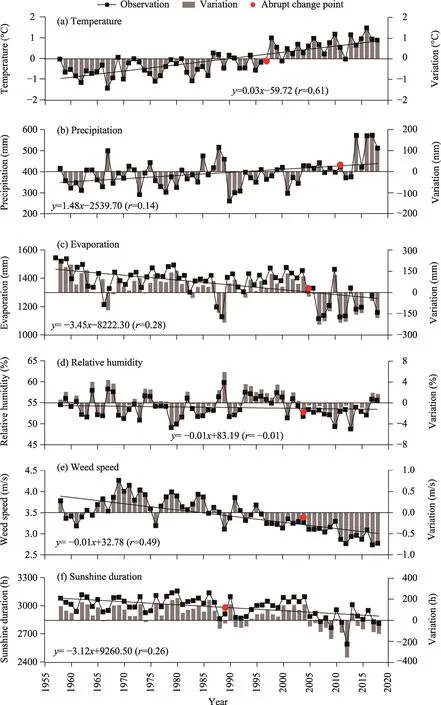
Fig. 5 Changes in the climatic factors of the Qinghai Lake Basin from 1958 to 2018. (a), temperature; (b),precipitation; (c), evaporation; (d), relative humidity; (e), wind speed; (f), sunshine duration.
The mean annual precipitation was 399.5 mm from 1958 to 2018, with the lowest annual precipitation being 260.1 mm (in 1990) and the highest precipitation being 572.3 mm (in 2017)(Fig. 5b). The annual precipitation increased from 1958 to 2018 at a rate of 1.5 mm/a. An abrupt change in the annual precipitation occurred in 2011. The mean annual precipitation was 380.8 mm during 1958-2010, with the increasing rate of 0.5 mm/a, whereas it was 477.3 mm from 2011 to 2018, with an increasing rate of 24.5 mm/a.
The mean annual evaporation was 1362.9 mm from 1958 to 2018, and the lowest and highest annual evaporation values were 1113.5 mm (in 2007) and 1544.5 mm (in 1958), respectively (Fig.5c). The annual evaporation decreased from 1958 to 2018 at the rate of 3.5 mm/a. An abrupt change in the annual evaporation occurred in 2005. During 1958-2004, the annual evaporation decreased at the rate of 1.0 mm/a; it was higher than 1362.9 mm during most of the years and the mean annual evaporation was 1400.2 mm during this period. The annual evaporation values in all years of 2005-2018 (with the exception of 2010) were lower than 1362.9 mm, with the mean annual evaporation of 1228.5 mm and the decreasing rate of 3.9 mm/a.
The mean annual relative humidity was 53.86% from 1958 to 2018, and the lowest and highest annual relative humidity values were 48.72% (in 2013) and 59.80% (in 1989), respectively (Fig.5d). The annual mean relative humidity decreased from 1958 to 2018 at the rate of 0.01%/a. An abrupt change occurred in 2004, and the mean annual relative humidity was 54.25% from 1958 to 2003 and 52.67% from 2004 to 2018.
The mean annual wind speed was 3.45 m/s from 1958 to 2018, and the minimum and maximum annual wind speed values were 2.74 m/s (in 2017) and 4.26 m/s (in 1969), respectively(Fig. 5e). From 1958 to 2018, the annual mean wind speed decreased significantly at a rate of 0.02 m/(s?a). An abrupt change occurred in 2004. From 1958 to 2003, the mean annual wind speed was 3.60 m/s and the decreasing rate was 0.01 m/(s?a), whereas from 2004 to 2018, the mean annual wind speed was 3.00 m/s and the decreasing rate was 0.03 m/(s?a).
The mean annual sunshine duration was 2985.0 h from 1958 to 2018, and the minimum and maximum annual sunshine duration values were 2588.6 h (in 2012) and 3154.7 h (in 1982),respectively (Fig. 5f). The annual sunshine duration decreased at the rate of 3.2 h/a from 1958 to 2018. An abrupt change occurred in 1989. The mean annual sunshine duration was 3035.9 h from 1958 to 1988, with the increasing rate of 0.4 h/a, whereas it was 2932.4 h from 1989 to 2018, with the decreasing rate of 5.6 h/a.
Because of the enhancement of monsoon and weakening of westerly circulation on the QTP (Li et al., 2020), air temperature and precipitation increased but evaporation and wind speed decreased. The sunshine duration was shortened and relative humidity was decreased. So, the climate in the Qinghai Lake Basin exhibited a warm and humid trend during the study period.
3.3 LUCC in the Qinghai Lake Basin
According to the six periods of LULC from 1977 to 2018, the main LULC type in the Qinghai Lake Basin was grassland, followed by water bodies and unused land, and the distribution of cultivated land, woodland, and construction land was relatively small (Fig. 6). The areas of moderate coverage grassland (coverage in the range of 20%-50%) and low coverage grassland(coverage in the range of 5%-20%) were larger, whereas the area of high coverage grassland(coverage higher than 50%) was relatively small (Table 1). The grassland area decreased from 1977 to 2018; specifically, the area was 18,806.62 km2in 1977, accounting for 63.38% of the total basin area, whereas it decreased to 18,586.17 km2in 2018, accounting for 62.64% of the total basin area. The area of high coverage grassland decreased from 1977 to 2000 and began increasing in 2004. The area of moderate coverage grassland continued to decrease and that of low coverage grassland continued to increase from 1977 to 2018.
Lakes were the main water bodies in the Qinghai Lake Basin, whereas graff, bottomland,glaciers, and snow-covered regions accounted for a minority of water bodies. The area of water bodies decreased at first and then increased from 1977 to 2018. In 1977, the area of water bodies was 5574.38 km2, accounting for 18.79% of the total basin area. In 2004, the area of water bodies decreased to the least (5326.47 km2), accounting for 17.95% of the total basin area, and then it increased to 5402.80 km2in 2018, accounting for 18.21% of the total basin area. For the water body types, the variation trend for the areas of lakes and graff was consistent with that for the areas of other water body types. The areas of glaciers and snow cover continued to decrease from 1977 to 2018 (with the exception of 2000), whereas the bottomland area first increased and then decreased.
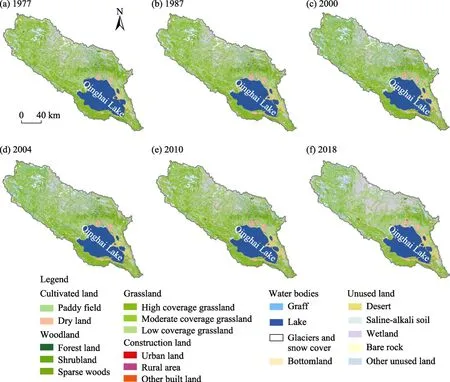
Fig. 6 Spatial distribution of land use/land cover (LULC) of the Qinghai Lake Basin in 1977 (a), 1987 (b), 2000(c), 2004 (d), 2010 (e), and 2018 (f)
With regard to unused land, the areas of wetland and other unused land types were the largest,followed by desert, saline-alkali land, and bare rock, which exhibited the least areas. The area of unused land first increased and then decreased; specifically, it was 4488.08 km2in 1977,accounting for 15.13% of the total basin area. In 2004, the area reached 4757.18 km2, accounting for 16.03% of the total basin area. The area began to decline from 2010 and decreased to 4680.64 km2in 2018, accounting for 15.78% of the total basin area. In terms of the other types of unused land, their areas continued to increase. The area of desert first increased and then decreased;however, the areas of saline-alkali land and bare rock did not change significantly.
Woodland was mainly dominated by shrubland, and the areas of forest land and sparse woods were relatively low. The woodland area first decreased and then increased. In 1977, the woodland area was 492.63 km2, accounting for 1.66% of the total basin area. In 2000, the woodland area decreased to 471.38 km2, accounting for 1.59% of the total basin area. The area began increasing in 2004 and reached 492.37 km2in 2018. In terms of the types of woodland, the area of shrubland changed significantly but the areas of forest land and sparse woods remained unchanged.
Cultivated land was dominated by dry land, and paddy land was scattered. The area of cultivated land continued to increase from 1977 to 2010, with an area of 301.62 km2in 1977 and 453.92 km2in 2010, accounting for 1.02% and 1.53% of the total basin area, respectively; further,it decreased to 450.54 km2in 2018, accounting for 1.52% of the total basin area. Construction land mainly included urban land, rural area, and other built land, among which the rural area had a relatively larger area. The area of construction land continued to increase from 7.41 km2in 1977 to 58.23 km2in 2018, with an increase of 50.82 km2.
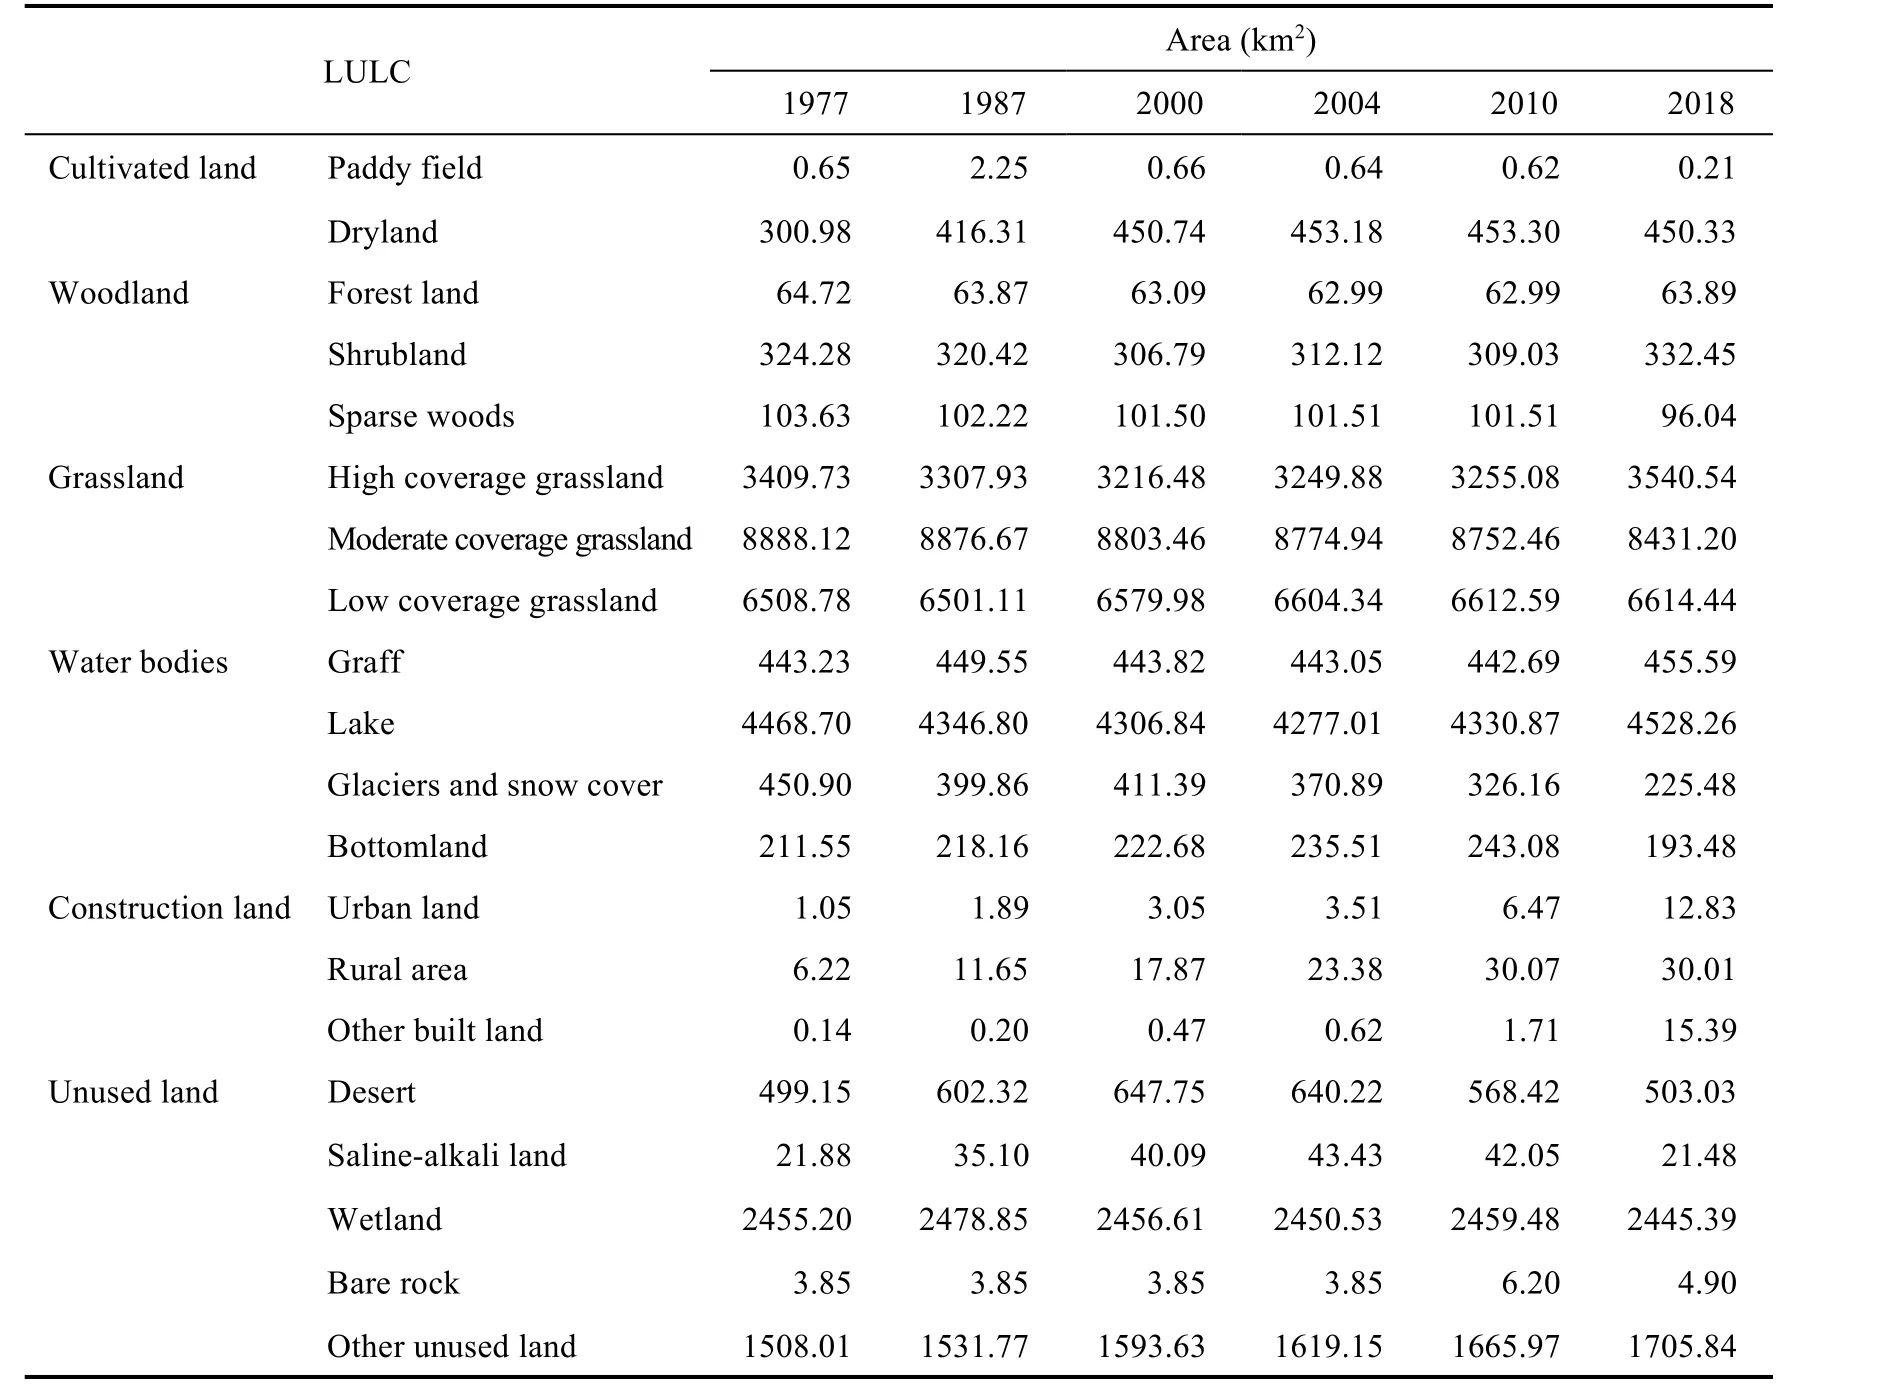
Table 1 Areas of the land use/land cover (LULC) types in the Qinghai Lake Basin in 1977, 1987, 2000, 2004,2010, and 2018
3.4 Combined effects of climate change and LUCC on the Qinghai Lake volume
Based on multi-period LULC data and meteorological data, we calculated the measured water yield of the Qinghai Lake Basin from 1977 to 2018 using the InVEST model (Fig. 7). The measured water yield showed an "increase-decrease-increase" fluctuation in the Qinghai Lake Basin from 1977 to 2018. In 1977, the measured water yield was 18.17×10⁸m3, which increased to 23.84×10⁸m3in 1987 and decreased to 19.03×10⁸m3in 2000. Further, it increased to 45.45×10⁸m3in 2018.
Scenarios 1 and 2 were used to analyze the contributions of climate change and LUCC to the water yield in the Qinghai Lake Basin and quantitatively evaluate the contribution rates of climate change and LUCC to the water yield of the lake volume. A comparison of the water yield under different scenarios with the measured water yield indicated that the water yield under Scenario 1 was close to the measured water yield (Table 2). An obvious difference was observed between the water yield under Scenario 1 and the measured water yield, although the change in the water yield between different years of Scenario 2 was not obvious. The contribution rate of LUCC to the measured water yield was the highest (9.22%) from 1977 to 1987, as evident from the contribution rates between adjacent years under different scenarios (Table 2). In the other years,the contribution rate of LUCC was negative, and the lowest rate was -22.11% from 1987 to 2000.The contribution rate of LUCC was 8.57% from 1977 to 2004 and the contribution of climate change was 91.43%. From 2004 to 2018, climate change was the key factor that played a major role, and its contribution rate reached 104.25%, whereas that of LUCC was -4.25%. From 1977 to 2018, the contribution rate of LUCC was -0.76% and that of climate change was 100.76%(Table 2).
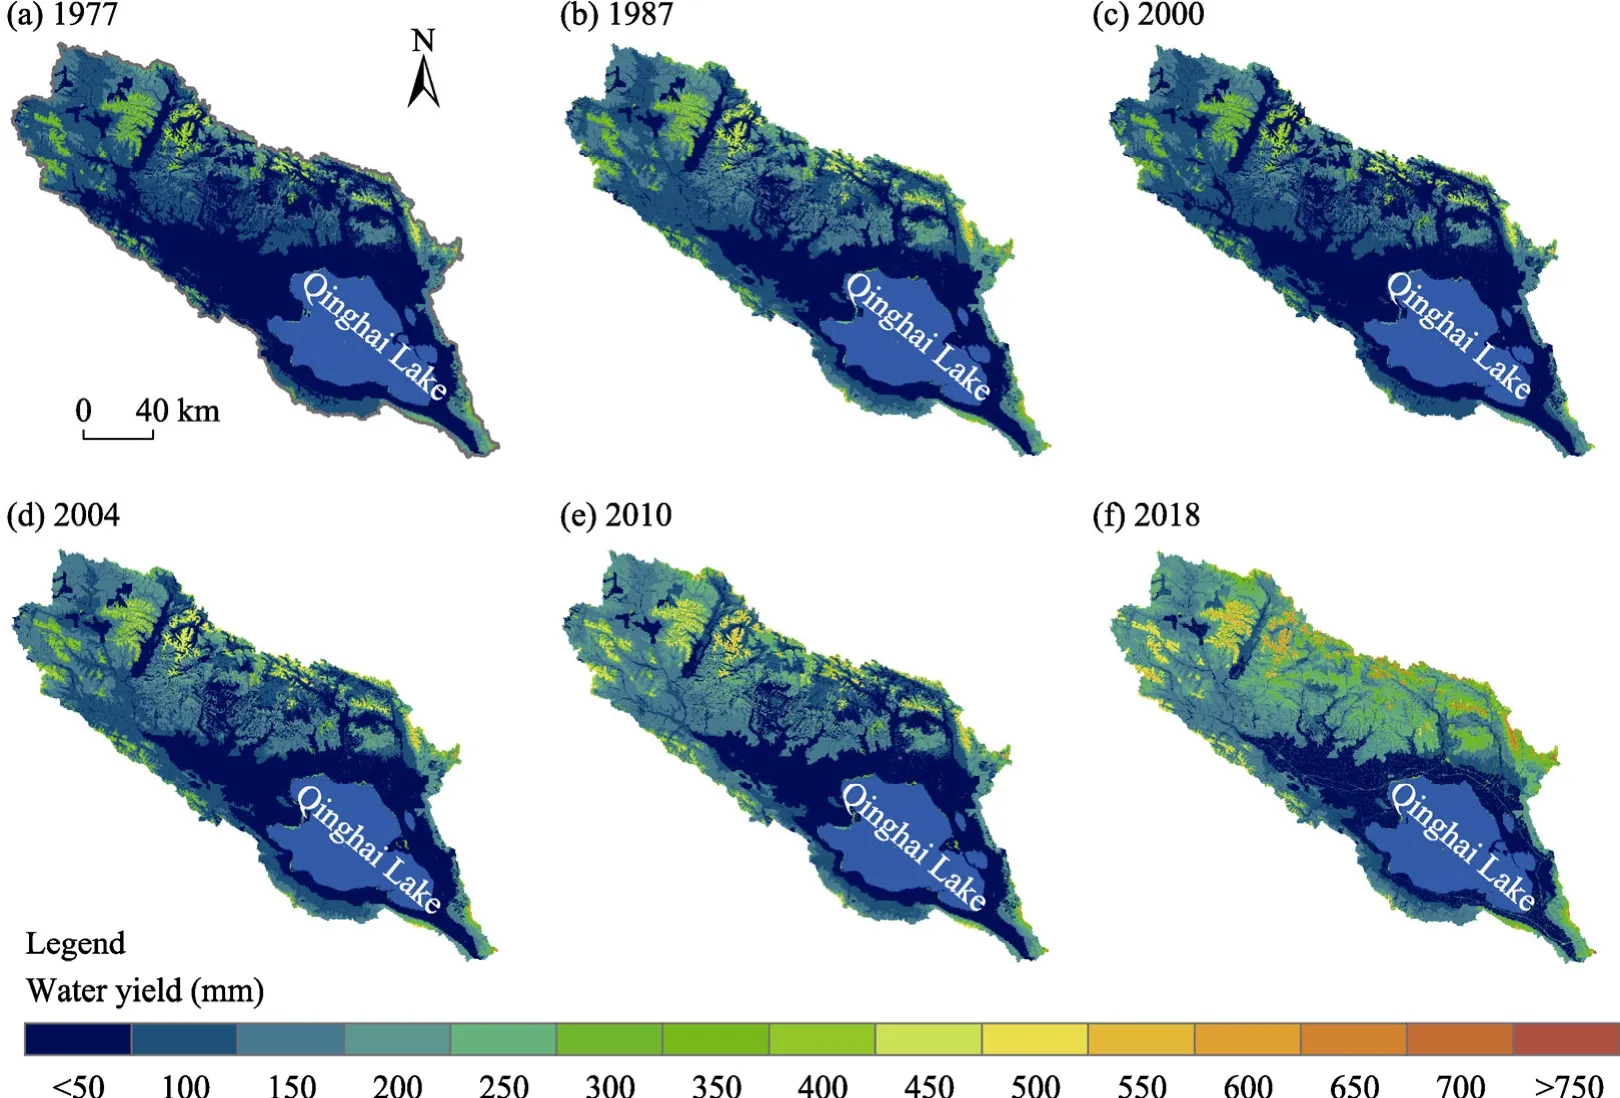
Fig. 7 Spatial distribution of the measured water yield of the Qinghai Lake Basin in 1977 (a), 1987 (b), 2000(c), 2004 (d), 2010 (e), and 2018 (f)
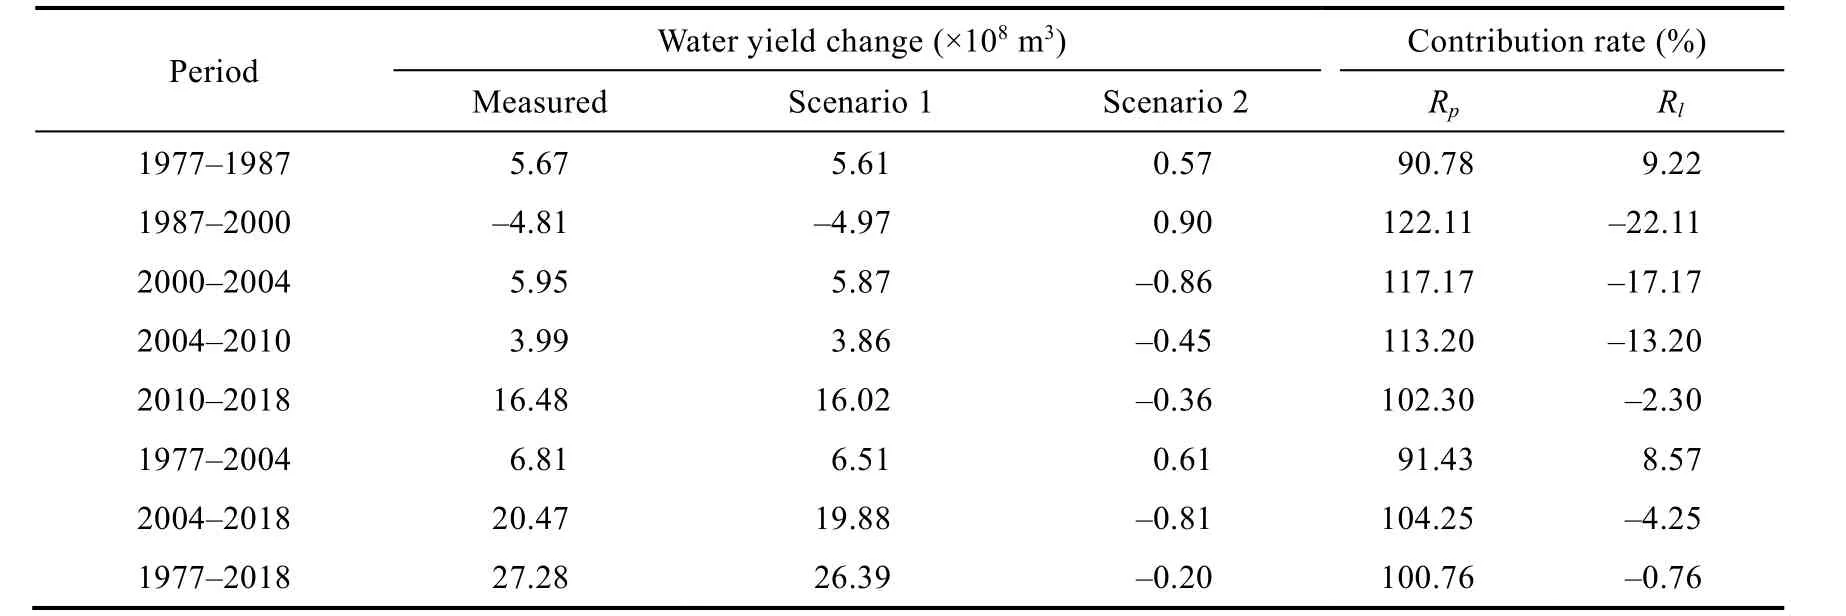
Table 2 Changes of the measured water yield under different scenarios and contribution rates of climate change and land use/cover change (LUCC) to the water yield of the Qinghai Lake Basin in different time periods
4 Discussion
4.1 Effects of climate change on the Qinghai Lake volume
The volume change in the closed-basin lakes is directly related to the balance among precipitation, runoff, and evaporation, and it is mainly controlled by the precipitation and evaporation in the short-term period (van der Kamp et al., 2008). In the Qinghai Lake Basin,among the different years, the effects of climatic factors on the lake volume change were the most significant from the 1960s to the 1980s and least significant in the 2000s and 2010s (Table 3). In the 1960s, the precipitation and evaporation had the most significant effect on the lake volume change, with the Pearson correlation coefficients of 0.78 (P<0.01) and -0.67 (P<0.01),respectively, followed by that in the 1980s, with the Pearson correlation coefficients of 0.69(P<0.05) and -0.88 (P<0.01), respectively. These factors were also affected by the mean wind speed and sunshine duration, with the Pearson correlation coefficients of -0.66 (P<0.05) and-0.81 (P<0.01), respectively.
Both the increase in precipitation and the decrease in evaporation affected the lake volume change from 1958 to 2014, and the corresponding Pearson correlation coefficients were 0.67(P<0.01) and -0.64 (P<0.01), respectively. The Pearson correlation coefficients of the lake volume change with the mean wind speed and sunshine duration were -0.31 (P<0.05) and -0.45(P<0.01), respectively. The decreases in the mean wind speed and sunshine duration can directly decrease the evaporation rate of the lake surface and indirectly affect the change in the lake volume (Xiao et al., 2018). Continuous decrease of relative humidity was positively correlated with the change in the lake volume (r=0.56,P<0.01). Low evaporation from the lake surface leads to less water vapour in the atmosphere, which restrains climate warming (Wang et al.,2017). In the Qinghai Lake Basin, air temperature exhibited no significant relationship with the lake volume change (r= -0.14). However, an increase in air temperature can lead to an increase in evaporation loss (van der Kamp et al., 2008; Méndez-Tejeda et al., 2016).Precipitation was the main climatic factor for the change in the lake volume from 2004 to 2018(r=0.58,P<0.05). Other climatic factors had no significant effects on the change in the lake volume. Lei et al. (2017) analyzed the seasonal changes in the lake volume of the QTP in the recent years. The lake water budget on the northeastern QTP was mainly controlled by monsoon precipitation (Lei et al., 2017). In this study, according to the analyses of climatic factors and lake volume change from 1958 to 2018, the Pearson correlation coefficients for the association of the lake volume change with precipitation and evaporation were 0.72 (P<0.01) and -0.66 (P<0.01),respectively. The mean wind speed and sunshine duration had significant negative correlations with the lake volume change (r= -0.55,P<0.01;r= -0.59,P<0.01, respectively). Air temperature and relative humidity had relatively weak effects on the lake volume change (r=0.29,P<0.05;r=0.30,P<0.05, respectively). During different time scales, the interaction among key climatic factors such as air temperature, wind speed, relative humidity, and sunshine duration could affect the lake evaporation (Wang et al., 2017; Xiao et al., 2018).

Table 3 Pearson correlation coefficients of the lake volume change with different climatic factors in the Qinghai Lake Basin in different time periods
4.2 Effects of LUCC and measured water yield change on the Qinghai Lake volume
LUCC affects infiltration, evaporation, surface runoff, and soil and water conservation because of changing soil conditions and underlying surface type; the influences of these processes on the lake volume are complex (Nosetto et al., 2005; Odongo et al., 2019). According to the relationships among the lake area, the measured water yield of different LULC types, and the lake volume change, the measured water yield of different LULC types exhibited obvious differences(Table 4). Because the soil of cultivated land is soft and the root system of plants is shallow, their ability to intercept precipitation is reduced and the crops need to absorb water, resulting in low measured water yield (Lang et al., 2017). A significant correlation was observed between the cultivated land area change and lake volume change (r= -1.00,P<0.05); however, no significant correlation was observed between the measured water yield and lake volume change. More than 85.00% of the woodland is shrubland and sparse woods in this area, which had lower precipitation interception capacity and higher water yield (Lian et al., 2020). The lake volume change exhibited no significant correlations with the area and annual water yield of woodland.

Table 4 Spearman correlation coefficients of the lake volume change with the area and measured water yield of different LULC types
The soil of grassland was harder, so it exhibited a stronger ability to intercept precipitation than the soil of cultivated land. Grassland area had a significant correlation with the lake volume change(r= -0.89,P<0.05); however, no significant correlation was observed between the measured water yield and lake volume change. Because of the formation of an impervious layer by construction land, precipitation can quickly form runoff on construction land, thereby increasing the measured water yield (Lang et al., 2017). The area and measured water yield change of construction land were significantly positively correlated with the lake volume change (r=0.89,P<0.05;r=0.90,P<0.05, respectively). Wetland and bare rock were the main types of unused land. Because wetland soil is saturated and the water infiltration of bare rock is low, the water yield in both wetland and bare rock is high. The area change of unused land was negatively correlated with the lake volume change (r= -1.00,P<0.05). The measured water yield of unused land exhibited no significant correlation with the lake volume change. Before 2004, grassland degradation was serious because of the effects of population growth, overgrazing, and policies in the Qinghai Lake Basin (Li et al., 2009).
The changing pattern of LULC from 1977 to 2018 was as follows: woodland changed to grassland, grassland changed to cultivated land, and water bodies changed to unused land,resulting in a decrease in the measured water yield. After 2004, with the implementation of ecological protection and restoration projects in the Qinghai Lake Basin, the ecological environment has been improved (Lian et al., 2020). The changing pattern of LULC was due to the changes from cultivated land to woodland, cultivated land to grassland, and unused land to water bodies, leading to an increase of the measured water yield. In the Qinghai Lake Basin, the conversion of LULC types could result in both positive and negative water yields, and the scale of LULC conversion was small; hence, the overall effect of LUCC remained unclear (Lang et al.,2017).
4.3 Effects of other factors on the Qinghai Lake volume
Climate change exerts strong effects on most large lakes (Kraemer et al., 2020). Qinghai Lake is located at the intersection of East Asian monsoon, Indian monsoon, and westerly atmospheric flow (Li et al., 2006). The mechanism of the effects of climate change on the lake volume is complex, and the seasonal difference in the lake volume is obvious (Lei et al., 2017).Nevertheless, the contributions of glaciers, snow, and permafrost to the lake volume remain to be further studied. A large area of continuous permafrost was distributed in the Qinghai Lake Basin.However, with global warming, permafrost has been undergoing rapid degradation. Analysis of the ground surface temperature indicated that the warming of the active layer was significant (Li et al., 2020). Li et al. (2019) estimated that the ground ice reserves of permafrost was 160.00×10⁸m3at the depth of 0-10 m in the Qinghai Lake Basin, and the volume of water released by the upper layer of permafrost ground ice thawing in the recent ten years was 27.20×10⁸m3. The distribution area of glaciers is relatively small in the Qinghai Lake Basin. The estimated glacial ice reserve was 49.00×10⁸m3in 2015, and the glacier loss was 2.94×10⁸m3in the past decade (Li et al., 2019). However, different views exist on glacier meltwater feeding rivers. According to Zhang et al. (2011b), the increase in the lake water level in 2004 could be attributed to the accelerated glacier and snow cover melting in the recent decades. By the study of hydrogen-oxygen isotope change, Jin et al. (2013) asserted that glacial melting is limited to river recharge. With the aggravation of the lack of water resources in the future, lakes are likely to become an important water resource. The lake levels are still likely to undergo changes because of climate change and human activities (Kraemer et al., 2020), and these factors can increase the risk of water resource crises in China (Tao et al., 2020). Therefore, the coupling mechanism of climate change and lake volume should be further studied. Quantitative analyses of the contributions of glaciers, permafrost, snow cover, and precipitation to lake water resources, as well as the risk due to human activities are crucial for the management and sustainable utilization of water resources in the Qinghai Lake Basin.
5 Conclusions
Based on the lake level data of the Qinghai Lake, we introduced an improved lake volume calculation method to analyze the long-term trends of the lake volume change. By using a combination of the long-term series climatic data and multi-period LULC data, we quantitatively evaluated the contributions of climate change and LUCC to the measured water yield of the Qinghai Lake, which indirectly reflected the effects of climate change and LUCC on the lake volume. The results indicated that the volume of the Qinghai Lake changed significantly from 1958 to 2018. Specifically, the lake volume decreased by 105.40×10⁸m3from 1958 to 2004, at the rate of 2.24×10⁸m3/a, and increased by 74.02×10⁸m3from 2004 to 2018, at the rate of 4.66×10⁸m3/a. The effects of climate change and LUCC on the lake volume of the Qinghai Lake were significantly different.
In this study, we quantitatively evaluated the effects of climate change and LUCC on the lake volume change but did not consider the effect of LUCC on climate regulation. In our further study, we will comprehensively consider the coupling effect between climate change and LUCC,the re-change of the lake volume by precipitation, permafrost ground ice, and groundwater, and the prediction study of the lake volume change under the background of global warming. It is our hope that this study can serve as a suitable scientific guide for the sustainable management and development of water resources in the Qinghai Lake Basin as well as on the QTP.
Acknowledgements
This study was funded by the Strategic Priority Research Program of the Chinese Academy of Sciences(XDA20100101), the National Key Research and Development Program of China (2019YFC0507404), and the Gansu Province Science Foundation for Youth, China (20JR5RA543). The authors also thank the anonymous reviewers for their helpful comments.
- Journal of Arid Land的其它文章
- Erratum to: Dieback intensity but not functional and taxonomic diversity indices predict forest productivity in different management conditions: Evidence from a semi-arid oak forest ecosystem
- Erratum to: Predicting of dust storm source by combining remote sensing, statistic-based predictive models and game theory in the Sistan watershed,southwestern Asia
- Effects of vegetation near-soil-surface factors on runoff and sediment reduction in typical grasslands on the Loess Plateau, China
- Variation of soil physical-chemical characteristics in salt-affected soil in the Qarhan Salt Lake, Qaidam Basin
- Adjustment of precipitation measurements using Total Rain weighing Sensor (TRwS) gauges in the cryospheric hydrometeorology observation (CHOICE)system of the Qilian Mountains, Northwest China
- Identifying water vapor sources of precipitation in forest and grassland in the north slope of the Tianshan Mountains, Central Asia

