Isolation and development of microsatellite markers for Tapinoma melanocephalum (Hymenoptera:Formicidae)
ZHENG Chun-Yan,YANG Fan,ZENG Ling,XU Yi-Juan,*
(1.Guangdong Laboratory for Lingnan Modern Agriculture,Guangzhou 510642,China; 2.Department of Entomology,South China Agricultural University,Guangzhou 510642,China)
Abstract:【Aim】 The aim of this study is to isolate microsatellite markers from Tapinoma melanocephalum genome,and to identify polymorphisms of the microsatellite loci.【Methods】 We developed microsatellite loci from the genomes of 11 geographic populations of T. melanocephalum from the mainland and islands of South China via 454 GS FLX pyrosequencing technology.We used 10 pairs of microsatellite primers selected from randomly designed 100 pairs of microsatellite primers to determine the polymorphisms of the 10 microsatellite loci and to analyze the population genetic diversity and population differentiation of four geographic populations including Dong′ao Island (DAD),Hebao Island (HBD),Meizhou (MZ)and Shanju (SJ)of T. melanocephalum.【Results】 We successfully developed and isolated 10 pairs of microsatellite primers from the genomes of the 11 geographic populations of T. melanocephalum.In populations DAD,HBD,MZ and SJ,seven of ten microsatellite loci showed high polymorphism and the 10 loci were significantly departed from Hardy-Weinberg equilibrium.The number of allele (A)per locus was 3.50-9.00,allele richness (AR)per locus in each population ranged from 1.992 to 12.938.The AR and expected heterozygosity (HE)from island geographic populations (DAD and HBD)showed no significant difference from those from mainland geographic populations (MZ and SJ).All of the four geographic populations exhibited higher level of genetic divergence (FST=0.15969).HBD and MZ populations showed higher genetic divergence (FST=0.185)and lower gene flow than other paired geographic populations,suggesting that the gene flow of the two populations was restricted.In addition,the genetic variation derived from between individuals within geographic populations.【Conclusion】 Newly screened microsatellite loci can offer an effective tool for researching on the colony structure and breeding structure of T. melanocephalum,so that its spread mechanism can be deeply understood.
Key words:Tapinoma melanocephalum;genome;microsatellite loci;genetic structure;geographic population;pyrosequencing
1 INTRODUCTION
The ghost ant,Tapinomamelanocephalum,is a well-known tramp species that is widely dispersed by commercial activity and human trade in tropical and subtropical latitudes worldwide even found in greenhouse in temperate latitudes (Nickersonetal.,1969).This species was first reported in China (Wheeler,1921).It currently inhabits several provinces (such as Guangdong,Guangxi,and Hainan)in China.Based on its ability of rapid dispersal and its biological characteristics,we would like to explore the population genetic structure of this species to learn about population rapid dispersal in changeable environment in short time,which may provide theoretical direction for preventing and controlling it.While the previous reports have mainly focused on the biological characteristics of the ghost ant (De Jesusetal.,2010)and its interference behavior in competition with another invasive species,Solenopsisinvicta(Luetal.,2012).The spatial distribution of genetic diversity and colonial structure ofT.melanocephalumhave rarely been reported (Zimaetal.,2016).Therefore,developing useful molecular markers to assess landscape genetic patterns is indispensable.
In this study,we utilized the shotgun 454 GS FLX platform to isolate SSR markers from the genome ofT.melanocephalum.We designed 100 pairs of optimized primers and successfully isolated 10 marker loci by screening the appropriate sequences among large quantities of read data of the genome ofT.melanocephalum.Then,we preliminarily analyzed the genetic diversity and population differentiation of four geographic populations ofT.melanocephalumto identify polymorphisms among these appropriate microsatellite loci.The genetic analysis of these ants will further facilitate the investigation of the population structure or phylogeography ofT.melanocephalumand provide insight into its spreading mechanism.
2 MATERIALS AND METHODS
2.1 Sample collection and DNA extraction
T.melanocephalumworkers were collected in 2015 from 11 localities in South China known to be associated with humans,such as orchards,buildings and agricultural areas (Table 1).These localities were dispersed over 50 km.Workers were attracted by using sausage (Shuanghui Group Co.,Ltd.,Wuhan)and preserved in 99% ethanol.No permissions were required to collect these samples from the field.All specimens were identified based on morphological characteristics through stereomicroscopic analysis.At least four individuals from each site were randomly selected for DNA extraction using a TIANamp Micro DNA Kit (TIANGEN Biotech Co.,Ltd.,Beijing).Twenty workers of one colony from Dong′ao Island,Hebao Island,Meizhou,and Shanju,respectively,selected randomly among 11 localities were used to test polymorphisms.The remaining samples were pooled together and employed for shotgun sequencing.DNA quantity was determined with a NanoDrop 1000 (Thermo Scientific,Waltham,USA).Each sample yielded 25 ng/μL DNA.
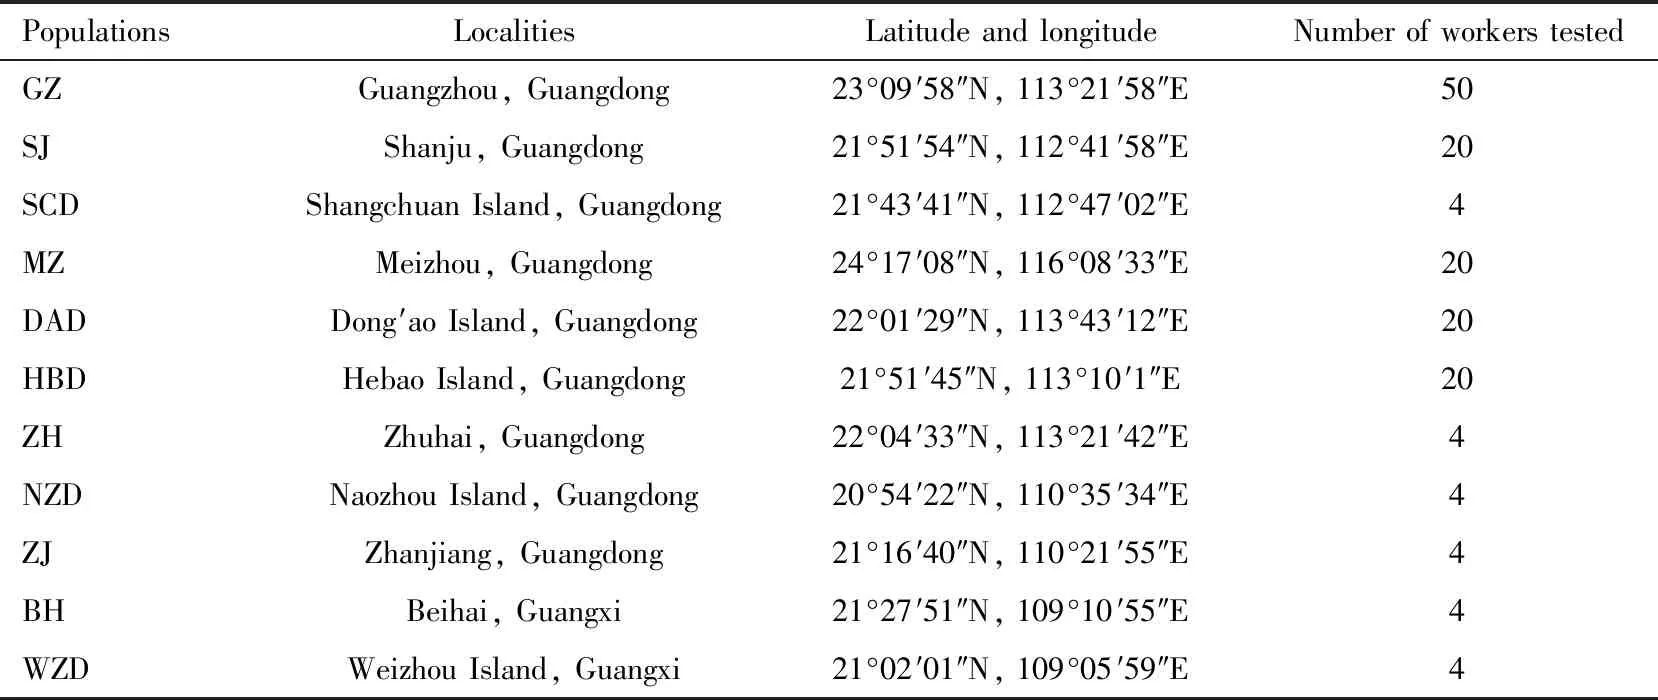
Table 1 Sampling data of Tapinoma melanocephalum workers used in this study
2.2 Pyrosequencing analysis and primer screening
One microgram of genomic DNA of 50 workers collected from Guangzhou populations ofT.melanocephalumwas used to develop microsatellite loci employing a shotgun library,following the 454 GS FLX+ library preparation protocol,with sequences being obtained using the 454 GS FLX+ system at Shanghai Personal Biotechnology Co.,Ltd.(http:∥www.personalbio.cn/.Shanghai).All microsatellite loci were identified with MISA software in all reads.We followed the guidelines (Faircloth,2008)for screening microsatellite markers.The screening parameters identified di-,tri-,tetra-,pentra-and hexanucleotide units with a minimum of 10 repeats.The maximum number of bases for the SSR loci was 100 bp.After aligning,repeat sequences and less than 20 bp for flanking sequences were filtered and discarded.
2.3 Primer identification
We designed 100 pairs of primers,which consisted of five tandem repeats of di-,tri-and tetramer units,based on the microsatellite loci in the genome of 11 geographic populations ofT.melanocephalum.The length of the PCR products ranged from 100 bp to 500 bp according to Primer 3_2.2.3 software.The primers were synthesized by Shanghai Sunny Biotechnology Co.,Ltd.(Shanghai),with lengths of 18-25 bp and an annealing temperature of 60℃.The DNA from 11 geographic populations ofT.melanocephalumwas pooled together and amplified with each primer.Each amplification reaction contained 25 ng of template DNA,1 μL of 10 mmol/L primers,2 μL of 10×buffer (containing Mg2+),0.5 μL of dNTP mixture (10 mmol/L)and 0.5 μL of Taq DNA polymerase (5 U/μL),with H2O added to 20 μL.The PCR program consisted of an initial denaturation at 95℃ for 5 min,followed by 35 cycles at 95℃ for 30 s,60℃ for 30 s and 72℃ for 30 s,with a final extension at 72℃ for 5 min and then storage at 4℃.A single main band was observed,and differences in migration rates were tested via 2.5% agarose gel electrophoresis.
Finally,we selected 10 pairs of primers (Table 2)based on stable and successful amplification in all the 11 geographic populations to detect polymorphisms and to genotype the 80 individuals from the four geographic populations DAD,HBD,MZ and SJ ofT.melanocephalum.A 25 μL PCR volume contained 25 ng of DNA,2.5 μL of 10×buffer (containing Mg2+),2 μL of dNTP mixture (10 mmol/L),1 μL of each primer (10 mmol/L),0.2 μL of Taq DNA polymerase (5 U/μL),and 16.3 μL of ddH2O.Each PCR run included initial denaturation at 94℃ for 5 min,followed by 35 cycles of denaturation at 94℃ for 30 s,annealing at the locus-specific annealing temperature for 30 s (Table 2),and extension at 72℃ for 30 s,with a final extension at 72℃ for 5 min and storage at 4℃.Then,the PCR products were all electrophoresed in 2.5% agarose gels.The single main band was genotyped via automatic capillary electrophoresis fragment analysis.The PCR amplification products were separated using the DNF-900 High Sensitivity Large Fragment Analysis Kit in a fragment analyzer (Advanced Analytical Technologies,Inc.,USA).Alleles were adjusted using PROSize 2.0 (Advanced Analytical Technologies,Inc.,USA).
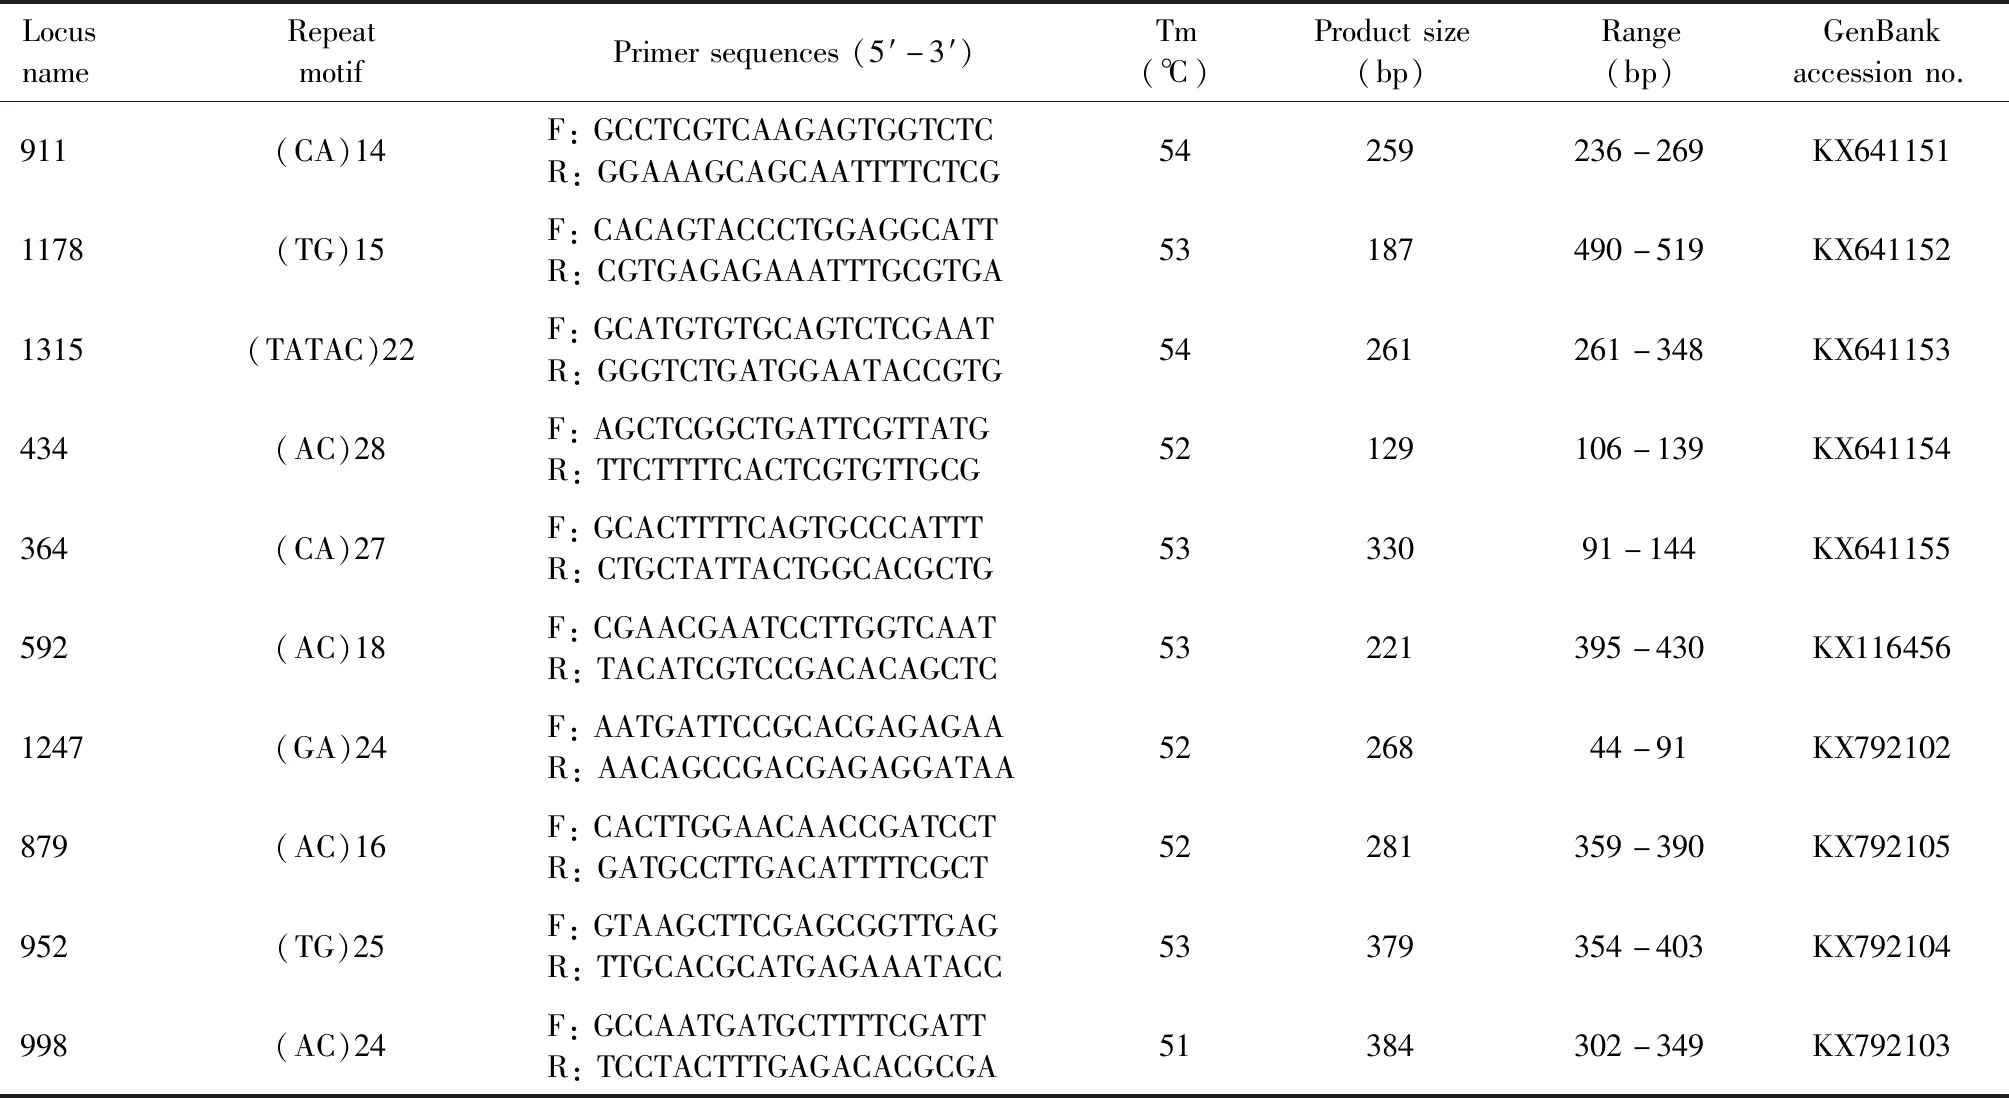
Table 2 Characteristics of ten microsatellite loci developed from the genomes of 11 geographic populations of Tapinoma melanocephalum
2.4 Analysis of genetic variation of populations
For genetic variation of the four geographic populations DAD,HBD,MZ and SJ ofT.melanocephalum,Genepop version 5.0 was used to test for deviations from Hardy-Weinberg equilibrium (HWE)and pairwise genotypic linkage disequilibrium (LD)with 10 000 dememorizations,1 000 batches and 10 000 iterations per batch (Raymond and Rousset,1995).The null allele of each locus was checked via the expectation maximization (EM)algorithm method using FreeNAS software (http:∥www.montepllier.inra.fr/URLB)(Chapuis and Estoup,2007).The observed number of alleles (A)and allele richness (AR)within each population at each locus and the degree of population differentiation were estimated with FSTAT version 2.9.3 (Goudet,1995),while the observed heterozygosity (HO),expected heterozygosity (HE),percentage of polymorphic loci (PIC)for markers,gene flow (Nem)and Shannon’s index (I)were calculated with GenAlEx 6.502 (Peakall and Smouse,2006).
Traditional fixation indices (F-statistics)using the methods of Weir and Cockerham (1984)were used for analyzing genetic structure or genetic divergence of the four geographic populations DAD,HBD,MZ and SJ ofT.melanocephalumbased on the microsatellite data.Two-level analysis of hierarchialF-statistics based on the four geographic populations DAD,HBD,MZ and SJ or hirerarchical molecular variance (AMOVA)was implemented by Arlequin version 3.5.1.3 software.The genetic variations among populations,among individuals within populations and within individuals in a population were tested using 10 000 permutations (Weir and Cockerham,1984;Excoffieretal.,2007).HEandARbetween mainland and island geographic populations were tested byt-test of SPSS 19.0 software (IBM SPSS Statistics,Chicago).Genetic similarity among the four geographic populations DAD,HBD,MZ and SJ based on the SSR markers was analyzed by principal coordinates analysis (PCoA)in GenAlEx6.5 (Peakall and Smouse,2012).
3 RESULTS
3.1 Sequencing results
A total of 174 252 unique reads of the genome of 11 geographic populations ofT.melanocephalumwere obtained after filtering low quality and short reads,totaling 74.1 Mb.The remaining 104 573 unique sequences were used for the screening of microsatellite loci.The sequence read archive was submitted to GenBank (GenBank SRA accession number:SRR4444910;BioProject:PRJNA344508;BioSample:SAMN05762028).Approximately 32.01% of sequences contained microsatellite loci.Among these sequences,140 873 sequences were dinucleotides,19 539 were trinucleotides,5 049 were tetranucleotides,112 were pentanucleotides,and 177 were hexanucleotides (Table 3).The results indicated that most of the repeats in the genome ofT.melanocephalumwere dinucleotide repeats.Additionally,similar to SSRs in most insect genomes,SSRs inT.melanocephalumshowed a lower GC content (48.065%)than AT content (51.935%).
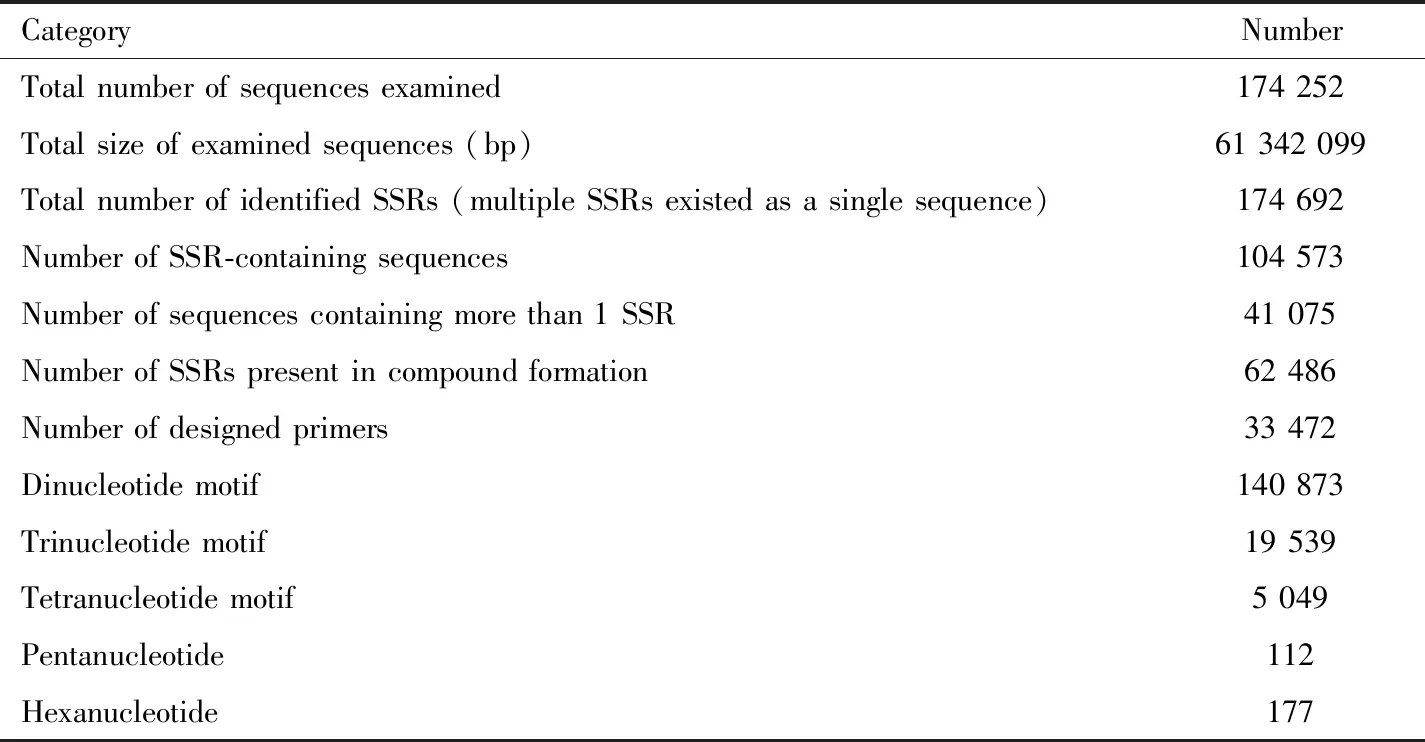
Table 3 Summary of 454 GS FLX pyrosequencing data of the genomes of 11 geographic populations of Tapinoma melanocephalum
3.2 Genetic diversity
Among the 100 pairs of microsatellite primers,10 pairs of primers met the requirements described above.And then,we tested 10 perfect units of di-,tri-or tetramers (GenBank accession numbers:KX641151-KX641155,KX116456,KX792102-KX792105)(Table 2)to be used for test and detection of polymorphic loci in the four geographic populations DAD,HBD,MZ and SJ ofT.melanocephalum.ThePICvalues of all loci except locus 879 were greater than 0.400,corresponding to moderate or high levels of polymorphism (thePICvalue of locus 879 was only 0.302)(Table 4).Seven of ten loci showed a high level of polymorphism,with thePICvalue of over 0.500.
We totally obtained 56 alleles in the four geographic populations DAD,HBD,MZ and SJ ofT.melanocephalumthrough 10 microsatellite loci.The number of alleles per locus ranged from 3.50-9.00,with a mean value of 6.05.TheHOof each locus ranged from 0.013 to 0.836,and theHEranged from 0.327 to 0.816.The averageHOandHEwere 0.2706 and 0.6246,respectively.HEwas higher thanHOin most of the 10 microsatellite loci (Table 4).The fixation indexFISof nine loci exceeded 0,apart from locus 1178 (FIS=-0.122),indicating the deficiency of heterozygosities in most loci.In addition,loci in all samples were significantly deviated from Hardy-Weinberg equilibrium (HWE)(P<0.01)(Table 5),locus 1178 exhibited excess of heterozygosity.Given that null alleles commonly appear in genetic analysis and affect HWE,we checked null alleles for ten loci from the four geographic populations DAD,HBD,MZ and SJ ofT.melanocephalumusing FreeNAS software to determine if high frequencies of null alleles (Na)occurred.TheNafor three loci (locus 998,locus 364 and locus 952)exceeded 0.300, while the rest of seven loci (locus 434,locus 911,locus 879,locus 592,locus 1178,locus 1315 and locus 1247)showed no null alleles or lower frequencies of null alleles (Na<0.300).When analyzing genotypic linkage equilibrium (LD),we found that one pair of loci (locus 998 and locus 879)showed significant genotypic linkage equilibrium (P<0.05),the other markers showed no significant linkage equilibrium (P>0.05),suggesting that the several loci (except for locus 998 and locus 879)could be independent for genetic analysis in this species.
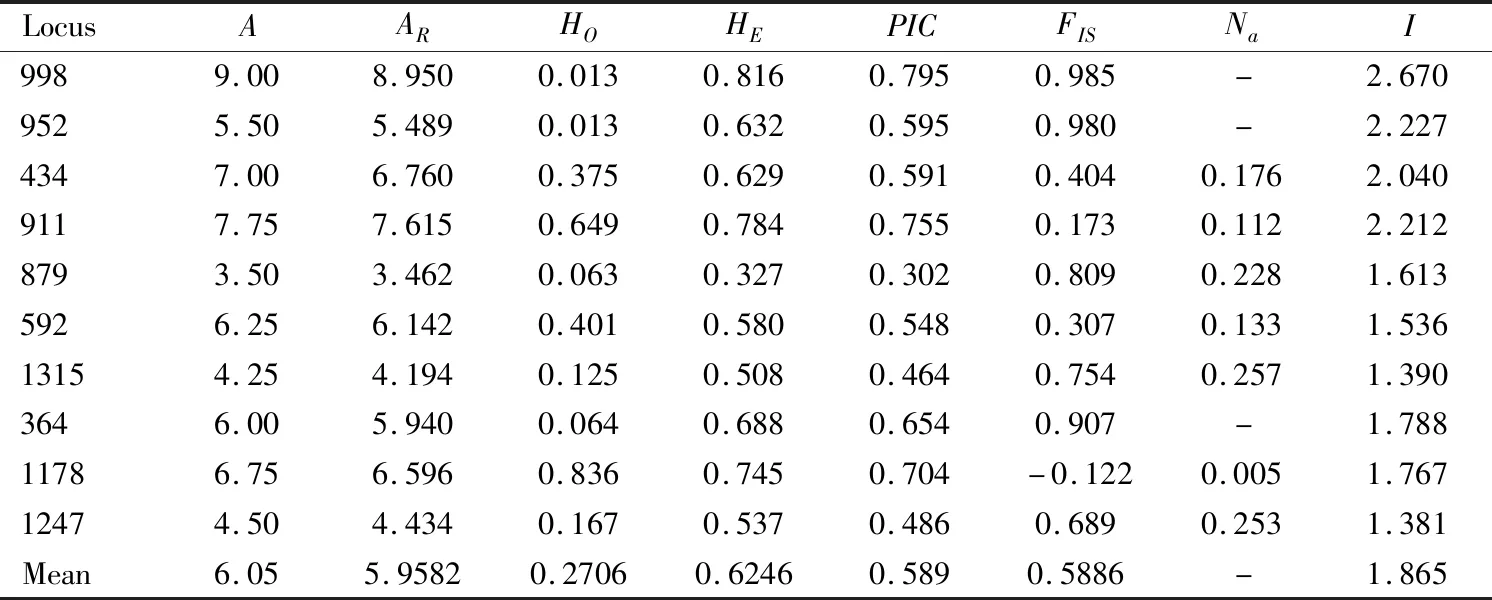
Table 4 Characteristics of the 10 microsatellite polymorphic loci of four geographic populations of Tapinoma melanocephalum
For the 10 microsatellite loci that exhibited genetic diversity among the four geographic populations DAD,HBD,MZ and SJ,theARof each population for each locus varied from 1.992 to 12.938 (Table 5).TheHOper population ranged from 0 to 0.950.TheHEranged from 0.095 to 0.900.TheARandHEvalues in the mainland populations (SJ and MZ)showed no significant difference from those of the island populations (HBD and DAD)(t-test,AR:t=0.492,df=38,P=0.670;HE:t=0.258,df=38,P=0.798).The Shannon’s index (I)ranged from 1.381 to 2.670 (Table 4).The results indicated that the four geographic populations DAD,HBD,MZ and SJ had different degrees of genetic diversity.There was no obvious difference in population genetic diversity between mainland (MZ,SJ)and island (DAD,HBD)areas in South China.
3.3 Population genetic structure
We estimated that genetic differentiation (FST)of the four geographic populations DAD,HBD,MZ and SJ ranged from 0.092 to 0.185 and gene flow (Nem)from 1.099 to 2.471 (Table 6).According to the classification of the degree of genetic divergence reported by Rousset (1997)and Botsteinetal.(1980),a low degree of genetic divergence corresponds to 0≤FST<0.05,an intermediate degree of genetic differentiation to 0.05≤FST<0.15,a high degree of genetic differentiation to 0.15≤FST≤0.25,and a very high degree of genetic differentiation toFST>0.25.The results showed a moderate level of divergence between populations DAD and SJ (FST=0.092).Populations MZ and HBD showed the highest differentiation (FST=0.185).Being separated by the greatest distance of 400 km,the gene flow between MZ and HBD (1.099)was lower than that between the other paired populations,demonstrating that there may exist lower or restricted gene flow between MZ and HBD populations due to the 400-km distance between them and their separation by a sea.
3.4 Population genetic differentiation
Moreover,traditional fixation indices (F-statistics)were used to investigate the population genetic differentiation.We found high degree of genetic differentiation in the total four geographic populations DAD,HBD,MZ and SJ (FST=0.15969,P<0.0001).Most of the total genetic variation was explained by individuals within populations (50.21900%),and the variation among populations and within individuals accounting for the total genetic variation were 15.96873% and 33.81227%,respectively (Table 7).

Table 6 FST (lower left matrix)and Nem (upper right matrix)values for pairs of four geographic populations of Tapinoma melanocephalum based on 10 microsatellite loci
3.5 Genetic similarity among populations
The result of PCoA based on the genetic similarity matrix among 80 samples from geographic populations DAD,HBD,MZ and SJ showed that the 80 samples were grouped into four groups Hebao Island,Dong′ao Island,Meizhou and Shanju,respectively (Fig.1),suggesting that these four populations have genetic divergence.
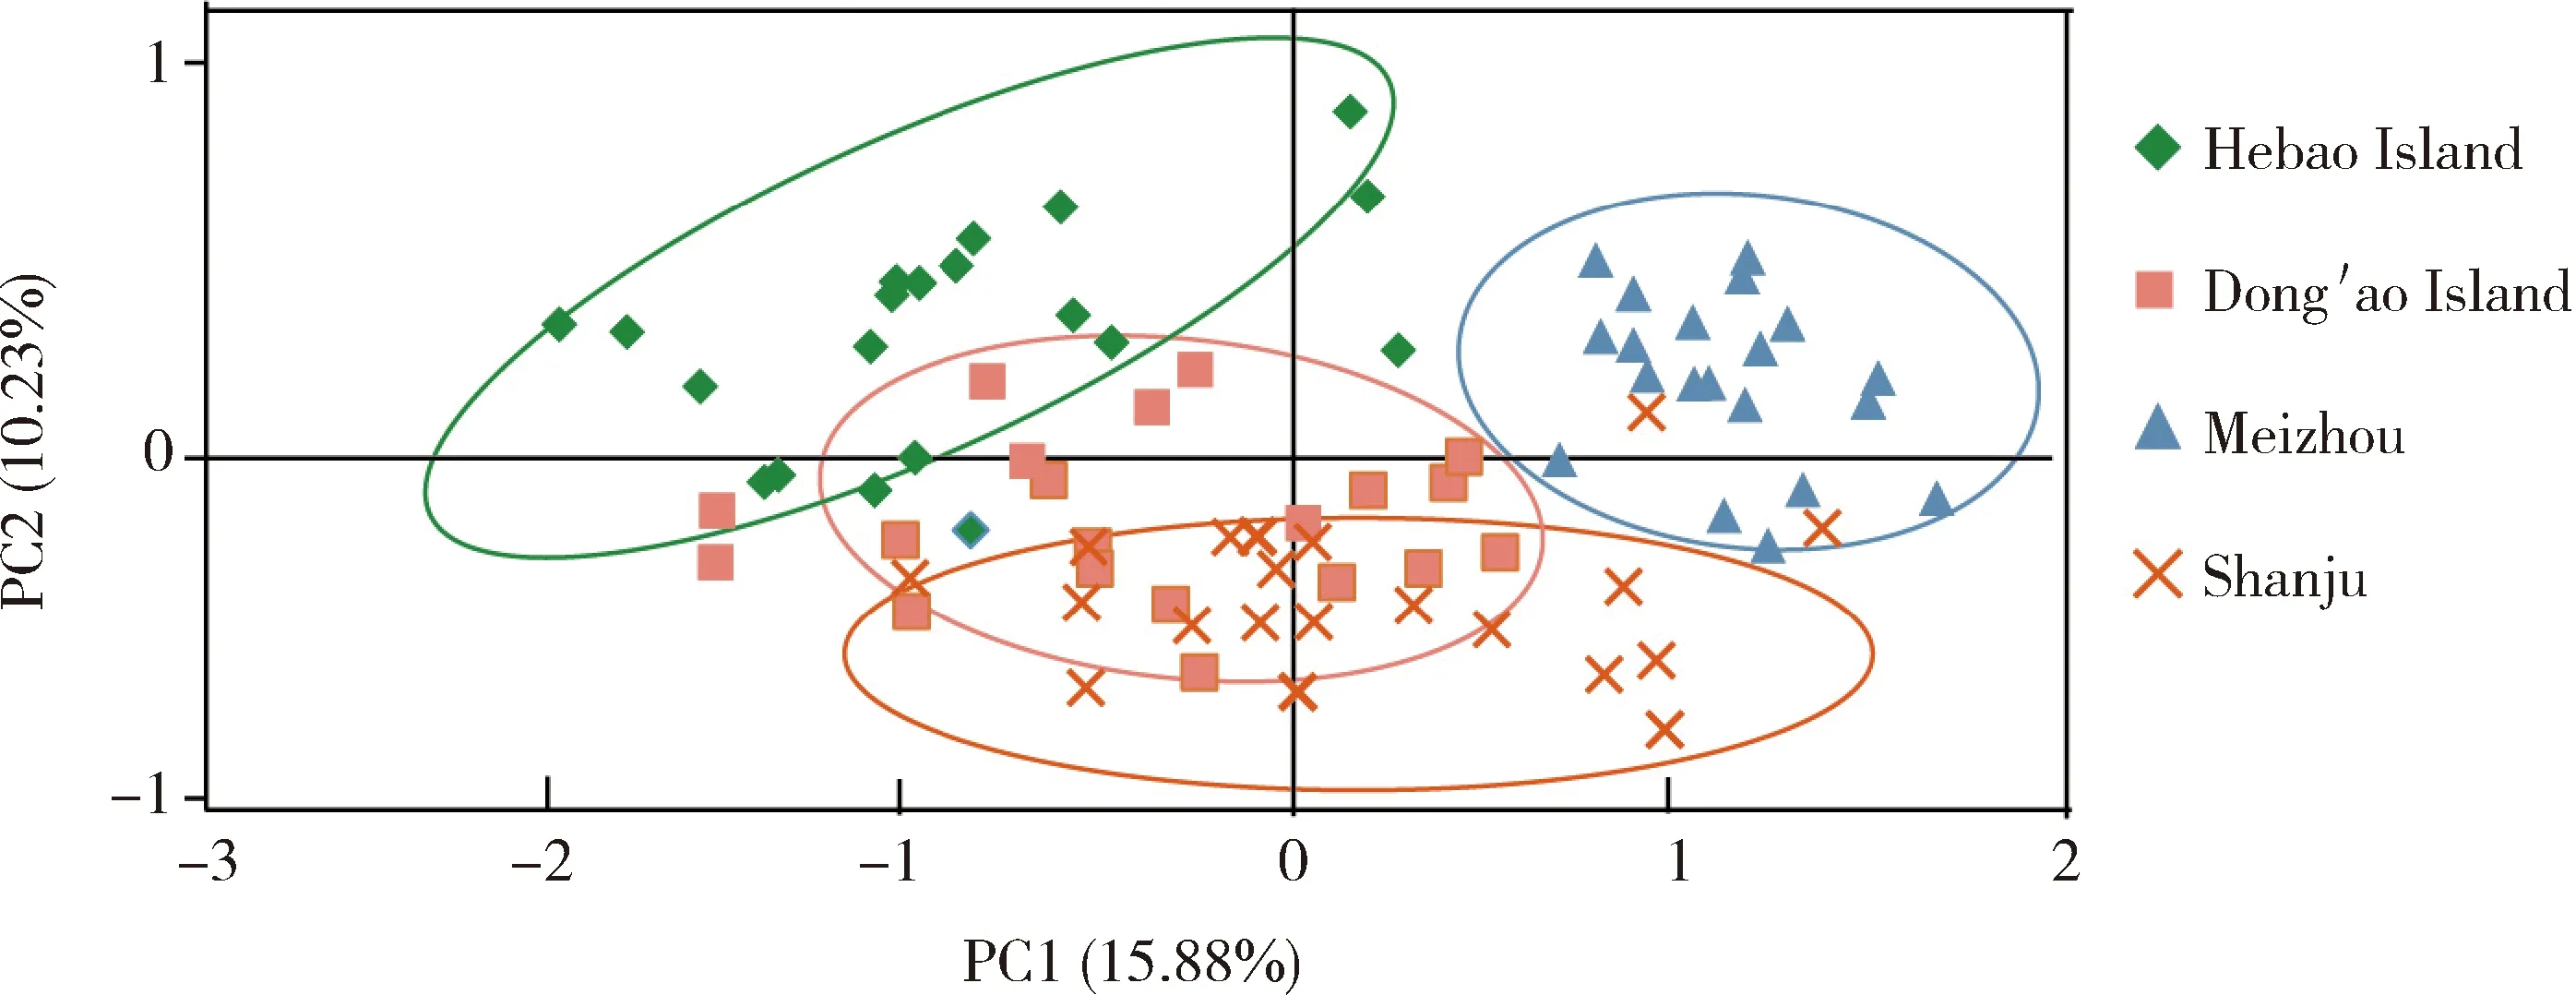
Fig.1 Principal coordinates analysis (PCoA)of four geographic populations of Tapinoma melanocephalum based on 10 microsatellite loci

4 DISCUSSION
4.1 454 GS FLX sequencing analysis
454 GS FLX not only have large capacity of raw data,but also can avert to miss other useful microsatellite loci and refrain from clonal deviation (Castoeetal.,2010;Andrews and Luikart,2014).In the present study,we obtained 104 573 unique sequences,which were employed to screen for microsatellite loci forT.melanocephalum.A set of 33 472 unique sequences was used for primer design.Eventually,among the identified SSR loci,10 microsatellite primer pairs were steadily amplified in all samples and selected to test the primer.ThePICvalues in seven of the 10 SSRs were higher than 0.500 (Table 4),indicating highly informative markers for studying population genetic structure.

Table 7 Analysis of molecular variance (AMOVA)from four geographic populations of Tapinoma melanocephalum based on 10 microsatellite loci
4.2 Hardy-Weinberg equilibrium and null allele
Except for locus 1178,theHOofT.melanocephalumin each locus for all samples was lower thanHEand displayed heterozygosity deficiency (Table 4).Thus,all loci were directly influenced by deficiency or excess of heterozygosity and could be considered to significantly deviate from Hardy-Weinberg equilibrium.The factors of causing heterozygosity deficiency mainly included the Wahlund effect,genotyping errors,against a certain allele and inbreeding ways and so on (Waples,2014).Additionally,the biological features of this invasive ant forms super colonies by intranidal mating and colony founding by budding.It is expected to produce more homozygotes than heterozygosity,which led to deviating HWE because of this reproduction ways (Wetterer,2009).Besides,the Wahlund effect may cause heterozygosity deficiency (Johnson and Black,1984;Nielsenetal.,2003).
Finally,heterozygosity deficiency may be ascribed to null alleles.Some results showed that when the frequency of null alleles (Na)was lower than 0.2,the lower null alleles frequency has slight effect on the population diversity,or “null”effects could be ignored the effect of population diversity.On the contrary,the frequency is over 0.2,null effects could be considered,and alleles could be discarded when assessed the population genetic diversity (Dakin and Avise,2004;Chapuis and Estoup,2007).It was also reported that null alleles were often tested in population genetic analysis and also high null allele frequencies existed in some biological classification (Meglécz and Solignac,2004;Chapuis and Estoup,2007).In Lepidoptera (Megleczetal.,2004),Diptera (Lehmannetal.,1997)insects,theNawas usually higher than 0.2,and supposed to relate with species biological characteristic (Pembertonetal.,1995).Similar result was found inPlutellaxylostellaand other studies (Endersbyetal.,2006),commonly suggesting high null frequency in microsatellite studies (Dakin and Avise,2004).In this study,theNafor four (locus 434,locus 911,locus 592 and locus 1178)out of ten loci ranged from 0.005 to 0.176 (Table 4),which met the requirement and could be used for population genetic structure analysis.The frequency of the rest of loci was over 0.200,and also could be well accepted to analyze population genetic diversity.Based on the perspective of DNA quality (Meglécz and Solignac,2004),we successfully amplified any individual and missed just one or several individuals using certain locus typing.Therefore,the higher frequency of null allele (Na>0.300)was not resulted from DNA quality.
In addition,we observed that Zimaetal.(2016)also reported excessive homozygosity and deviation from HWE in 12 pairs of polymorphism primers as well used these microsatellite for assessing genetic diversity in other ant species,such asAnonychomyrmascrutatorandPseudolasiusaustralis.He also explained that homozygosity excess might contribute to the Wahlund effect,bottleneck or biological process.As well,polymorphic loci were detected deviation from Hardy-Weinberg equilibrium,as similar with our results.Consequently,combining withPICof all loci in our study,the lowerNaof four loci (locus 434,locus 911,locus 592 and locus 1178)and higherNaof two loci (locus 1315 and locus 1247)(Table 4)were well worthy of further providing reliable information on the species’genome and helped to assess genetic diversity.
4.3 Population genetic diversity and genetic structure
Biological characteristic,sea isolation and inheritance were reported to be important factors which could impact on the population diversity and population growth in invasive species (Martínkováetal.,2013).Islands usually had discrete boundaries and complex habitats (Jensenetal.,2013).Bottlenecks in new invading regions,limitation of dispersal in island as well as extreme climate factor may disturb population genetic diversity of offshore species (Martínkováetal.,2013).Some reports showed that mammals and birds in island have lower genetic diversity than mainland populations (Frankham,1997;Brekkeetal.,2011).This study of population diversity among different geographic populations ofT.melanocephalumwas based on estimations obtained for 10 microsatellite loci.Our results showed that the averageARof island populations HBD and DAD and mainland populations MZ and SJ were similar (Table 5).
The variation ofFSTsuggests moderate differentiation between island and mainland populations.Populations MZ and HBD showed the highest differentiation (FST=0.185),and lower gene flow (1.099)than other paired populations (Table 6).
We also confirmed that among individuals within populations explained 50.21900% of molecular variance (Table 7).There were many reports from natural barriers such as forests,river banks,swamps and land masses isolated by seas indicating restricted gene flow (Hussenederetal.,2014).Based on an analysis employing four microsatellite markers and mtDNA,Mengetal.(2008)reported thatChilosupressalisexhibited restricted gene flow in China due to the Yangtze River.It was confirmed that population genetic differentiation was higher between island populations due to gene flow restricted population bottlenecks (Jensenetal.,2013).Despite the moderate level of differentiation was observed in our study,low or restricted gene flow was found between populations separated by a 400-km distance.
The biological characteristics ofT.melanocephalum,such as intranidial mating and colony founding by budding,led this species to forming large colonies without distinct boundaries and to adapting to different habitats (Smith,1965).Once supercolonies are formed in social insects,gene flow would be limited between colonies and genetically distinct between supercolonies.Assortative mating appearing in one supercolony is a response to lower level aggression in the same colony (Thomasetal.,2010).Buczkowskietal.(2004)reported that lower genetic diversity and bottlenecks are beneficial for reduced intercolony aggression and easier to form unicolonial,forming large supercolonies.T.melanocephalumalso established new colonies with only a few individuals (Williams,1994).
From this point of view,for invasive social insects,founder effects,bottlenecks effect and geographic isolation would cause low genetic diversity.We could further explore the colony structure and breeding system of island populations using these developed microsatellite loci,which may help understand the process of evolution and mechanism of this species invasion.
ACKNOWLEDGEMENTSWe thank YI Chun-Yan from South China Agricultural University for offering statistical analysis software,and also thank WANG Gu-Qian and HUANG Yu-Quan from South China Agricultural University for help collecting all samples.We also would like to thank Shanghai Personal Biotechnology Co.,Ltd.for technical support.

