Integrated silicon-based suspended racetrack micro-resonator for biological solution sensing with high-order mode*
Tao Ma(馬濤) Yong-Sheng Tian(田永生) Shao-Hui Liu(劉少暉)Jia-He Ma(馬家赫) Heng Liu(劉恒) and Fang Wang(王芳)
1College of Electronic and Electrical Engineering,Henan Normal University,Xinxiang 453007,China
2Henan Key Laboratory of Optoelectronic Sensing Integrated Application,Xinxiang 453007,China
3Academician Workstation of Electromagnetic Wave Engineering of Henan Province,Xinxiang 453007,China
Keywords: micro-resonator,suspended racetrack,biological sensor,limit of detection
1. Introduction
Silicon is a main material for the design and fabrication of photonic integrated circuit (PICs) due to the complementary metal-oxide semiconductor (CMOS) compatibility.[1,2]Silicon-based photonic micro-resonators (MRs) have been widely investigated in various research fields, such as optical modulations, optical interconnects, wavelength convertors, nano-linear optics, THz technology, optical detections,and optical sensors.[3-9]Furthermore, the large refractive index(RI)difference of silicon-based waveguide can greatly reduce the cross section of waveguide to nanometer scale,which greatly reduces the amount of solution for detection. Hence,the silicon-based MRs are widely adopted as sensors which show great potential applications in the clinical diagnostic assays and biochemical detections. The silicon-based MRs including ring,disk,racetrack,toroids,have been widely investigated due to their remarkable enhancements of light-matter interaction and widespread applications in sensing,metrology and nonlinear optics.[10-15]
The racetrack micro-resonator (RTMR)-based sensors rely on the evanescent waves,which spread into the surrounding medium to detect the presence of solutions or molecules.The resonance characteristics and sensing performances of the RTMR-based sensor can be adjusted by flexibly controlling the coupling strength at the straight part in the RTMR.The improvement in sensitivity of the RTMR-based sensor depends mainly on loss,polarization,and the interaction between light and the surrounding medium. Recently, several different materials,composite structures,and polarization states have been investigated to enhance the sensitivity of the integrated RTMR.An RTMR with the quasi-TM guided mode is investigated for the RI and biological sensing. The design parameters are optimized to obtain the highest sensitivity(~270 nm/RIU)with the help of the Multi-Project Wafer (MPW) foundries.[16]To enlarge the overlap between mode and the surrounding solution, silicon is replaced by silicon-oxy-nitride (SiON) for the core material.[17-19]The sensitivity of a single SiON-based RTMR is~434.94 nm/RIU with an ultrahigh figure of merit(FOM) of~4.6×10⁴RIU?1, and a dual SiON-based MR can greatly improve the limit of detection (LOD) which is~1.81×?6RIU. The porous silicon (PS)-based RTMRs are investigated for biosensing due to the advantages of the PS,such as the large internal surface and biocompatibility.[20,21]As a porous material, PS is a favorable host to various molecules and allows a direct interaction between the light and molecules to be detected.A theoretical sensitivity of 1170 nm/RIU is calculated,and the experimental results verify that a sensitivity of~560 nm/RIU with a limit of detection of~8×10?5RIU is obtained. Combined with the subwavelength grating (SWG),an SWG-based RTMR is proposed for ultrasensitive sensing with the TM mode.[22]The theoretical and experimental results demonstrate that a sensitivity of~429.74 nm/RIU and a limit of detection of~3.71×10?4RIU are achieved by optimizing the structure parameters. A T-shape suspended silicon nitride MR is experimentally demonstrated for an optical sensing with a sensitivity of~247 nm/RIU.[23]Compared with unsuspended sensing structures,the suspended MR enhances the interaction between light and the surrounding solutions. An RTMR sensor based on a plasmonic metalinsulator-metal (MIM) structure is designed, which achieves an RI sensitivity of~4650 nm/RIU and a temperature sensitivity of~0.33 nm/°C.[24]The plasmonic structure greatly reduces the size of the sensing device,which can break through the diffraction limit.

2. Structure model and method
The schematic of the silicon-based SRTMR is shown in Fig. 1(a). The suspended silicon layers (RI~3.5) are etched above the bottom silica substrate(RI~1.45). Considering the biological sensing applications, the surrounding dielectric of the silicon layer is set to be aqueous solution whose RI is~1.33. The cross-section(xyplane)of the SRTMR is shown in Fig. 1(b). As shown in Figs. 1(a) and 1(b). the bending radius and straight part length of the SRTMR areRandL0,respectively. The width and thickness of the waveguide arew0andh0, respectively. The height of the suspended structure above the silica substrate ish1. The gap between the bus waveguide and MR isw1.
To evaluate the transmission performances of the SRTMR, the quality factor (Q) and extinction ratio (ER) are used, which can determine the spectral resolution and affect the sensing performances in the measurement of spectral shift.[25]TheQfactor can be calculated from[26]

whereλresis the resonant wavelength and ?λFWHMis the full width at half maximum of the resonant peak. AndERis defined as

whereP2maxandP2minare respectively the maximum value and minimum value of the output power from port 2 of the SRTMR.
The sensitivity of an SRTMR-based sensor is defined by the ratio between the wavelength shift (?λres) at the resonant peak and the change of the solution RI(?nc)as follows:

whereλresis the resonance wavelength of the resonance peak andncis the solution RI in the microfluidic channel. The sensitivity can be calculated by using the linear fitting.[27]The mode characteristics and sensing performances of the SRTMR will be investigated by the commercial software COMSOL Multiphysics based on the FEM which is widely used to simulate the characteristics of integrated photonic devices. The mode characteristics can be calculated by the 2D mode analysis,and the coupling properties,transmission properties,and sensing performances can be simulated by the 3D frequency domain analysis.

Fig.1. Schematic diagram of suspended racetrack micro-resonator(SRTMR),showing(a)3D model and(b)cross-section of coupling part.
3. Characterization of SRTMR
3.1. Mode characteristics
The mode effective RIs (neff) of the guided modes in the SRTMR with different values ofw0andh0are shown in Figs. 2(a)-2(c) at an operating wavelength of 1550 nm, and the field distributions of two fundamental modes and three high-order modes are shown in Fig. 2(d). According to the Marcatili’s method,the guided modes in a rectangular waveguide are classified as two groups:mode andmode,wherexandyeach represent the direction of electrical polarization,mandnare the numbers of the electric field maximum values alongxandyaxes. Themode and themode are also known as quasi-TE and quasi-TM mode,respectively.The electrical polarization directions of the modes are shown by the black arrows in Fig.2(d). As shown in Figs.2(a)-2(c),the number of modes increases withh0increasing whenw0remains unchanged. Whenw0andh0are chosen to be 400 nm and 350 nm, only the first three low-order modes (E,and) exist in the waveguide. The mode effective RIs increase sharply and then change slowly ash0increases. The modes will degenerate whenh0andw0satisfy certain conditions.

Fig.2. Calculated mode effective RIs(neff)and field distributions of guided modes()versus h0 at wavelength of 1550 nm when h1=200 nm: w0=400 nm(a),500 nm(b),600 nm(c),and(d)field distributions at w0=400,h0=350 nm,and h1=200 nm.
In order to evaluate the optical field confinement,the confinement factor(Γ)is used,which is defined as[28]

Fig.3. Confinement factors in core and cladding versus h1 of SRTMR with different values of h0 and w0 for(a) mode,(b)mode,and(c) mode,and(d)confinement factors when w0=400 nm and h0=350 nm.
3.2. Coupling property


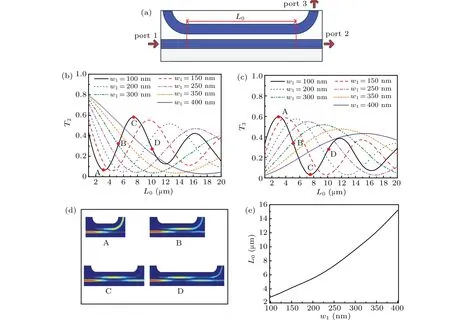
Fig.4. (a)Coupling section of SRTMR,(b)normalized output power of port 2,(c)normalized output power of port 3,(d)field distributions of mode at points A,B,C,and D,and(e)L0 versus w1.

3.3. Transmission properties
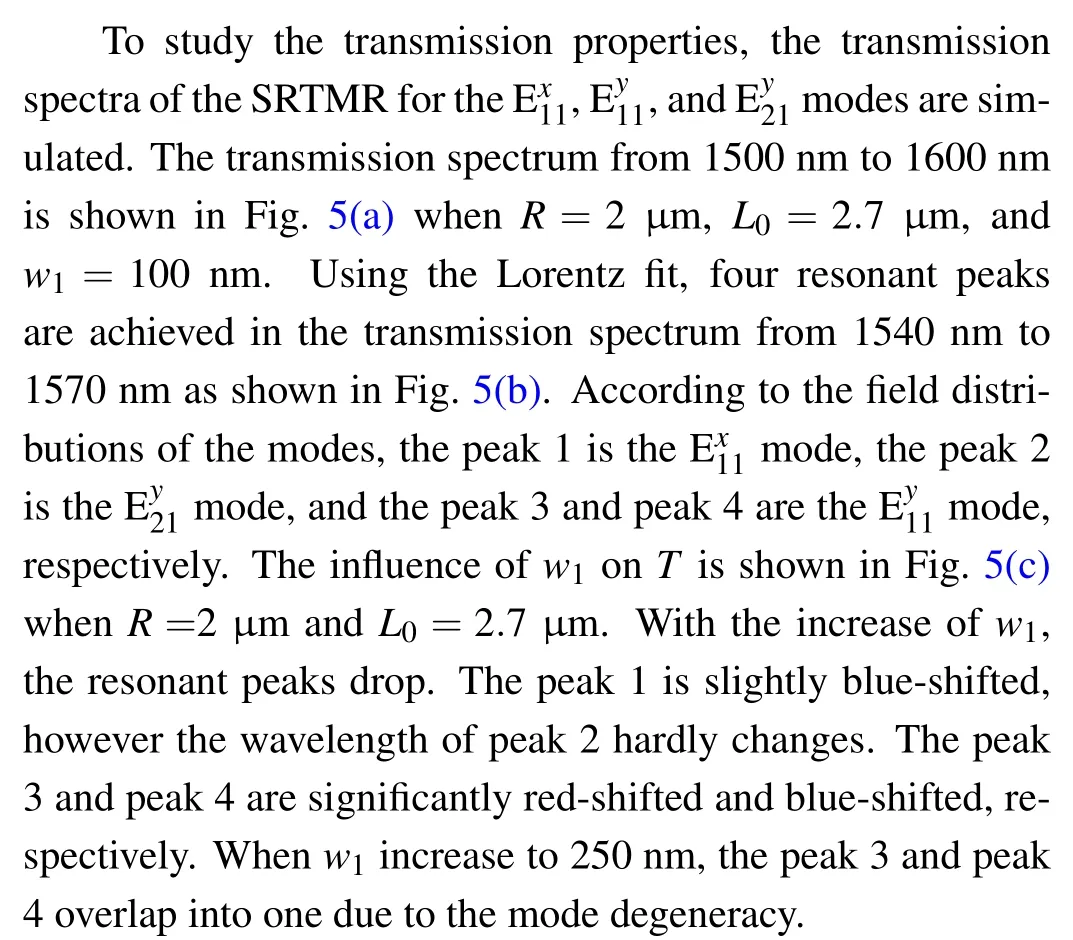

Fig.5. (a)Transmission spectrum when R=2μm,L0=2.7μm,and w1=100 nm,(b)fitting peaks of transmission spectrum,(c)transmission spectrum with different values of w1,Q,and ER with different values of w1 when L0=2.7μm(d),5.4μm(e),and 9.6μm(f).



4. Sensing performances
In applications,the sensing structure based on an SRTMR can be designed as shown in Fig.6. The SRTMR is immersed in the flowing solution which is injected into the microfluidic channel from the fluid inlet.[29]Meanwhile,the probe optical signal can be coupled into (out of) the optical input (output)of the bus waveguide from (into) an optical fiber via an inplane grating coupler.[30]The solutions with different RIs(ncvalues) are pumped into a fluid reservoir, and flow along the microfluidic channel through the suspended micro-racetrack into another fluid reservoir. Here,the RI(nc)value of the biological and chemical solutions both vary from 1.33 to 1.41.

Fig.6. Schematic diagram of sensing structure based on SRTMR combined with microfluidic channel.
The SRTMR can be fabricated on an SOI wafer by using the standard CMOS technique and nanoimprint technique.[30,31]To fabricate a partly suspended structure, an additional etching for the silica substrate should be carried out under being carefully controlled.[32-34]The SRTMR can be sealed with a pre-fabricated flexible microfluidic channel.[35]The microfluidic channels can be fabricated with polyethylene(PE),polypropylene(PP),polydimethylsiloxane(PDMS),SU-8, and PMMA, which can ensure fluidic confinement within the channels, easy interconnection with external microfluidic control devices,simple and inexpensive fabrication,and good ability to handle a variety of specimen sizes from biological applications.[36-40]

whereδλis the resolution of a spectrometer, which characterizes the smallest possible spectral shift for accurate measurement. For a commercial spectrometer,δλis~0.001 nm.The sensor based on the SRTMR achieves an LOD of~4.7×10?6RIU.The RI sensing performances of the sensing structures based different racetrack resonators are listed in Table 1.
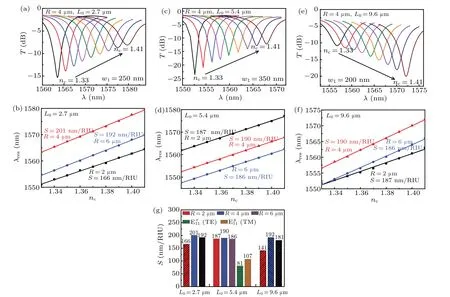
Fig.7. Sensing performances of SRTMR,transmission spectra of mode with different values of nc at a fixed R of 4μm and L0=2.7μm(a),5.4μm(c),9.6μm(e),the changes of λ with nc at L0=2.7μm(b),5.4μm(d),9.6μm(f),and RI sensitivity contrast(g).
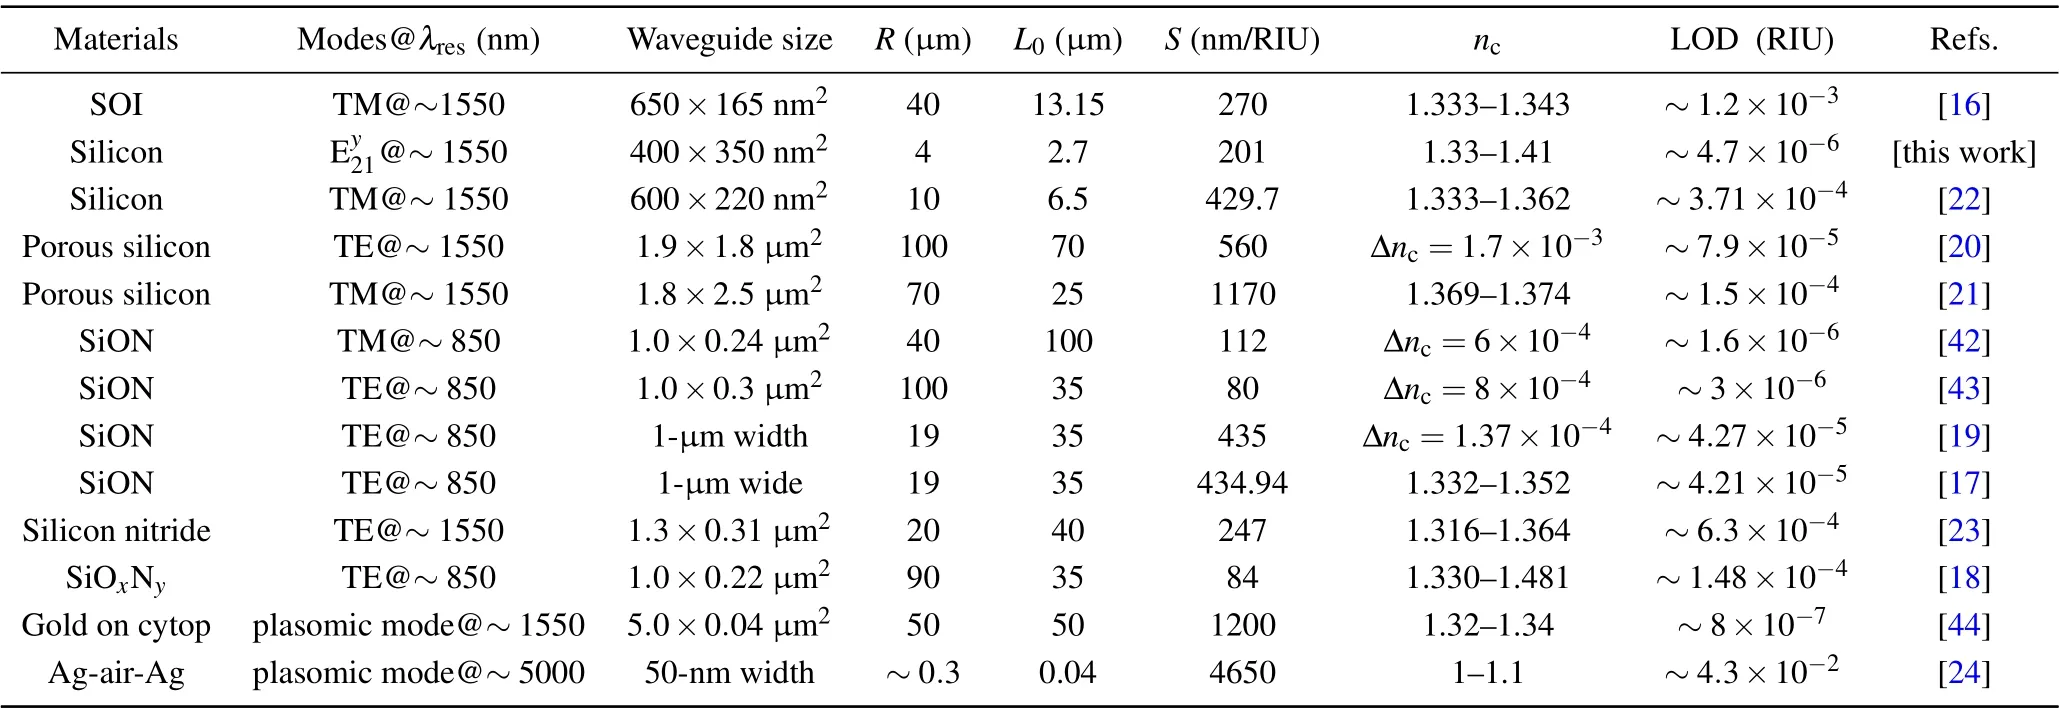
Table 1. Comparison of RI and temperature sensing performances among different configurations.
5. Conclusions
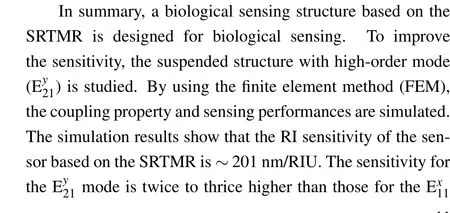
- Chinese Physics B的其它文章
- Numerical investigation on threading dislocation bending with InAs/GaAs quantum dots*
- Connes distance of 2D harmonic oscillators in quantum phase space*
- Effect of external electric field on the terahertz transmission characteristics of electrolyte solutions*
- Classical-field description of Bose-Einstein condensation of parallel light in a nonlinear optical cavity*
- Dense coding capacity in correlated noisy channels with weak measurement*
- Probability density and oscillating period of magnetopolaron in parabolic quantum dot in the presence of Rashba effect and temperature*

