
SR4R: An Integrative SNP Resource for Genomic Breeding and Population Research in Rice
2020-11-06 01:04:06JunYanDongZouChenLiZhangZhangShuhuiSongXiangfengWang
Jun Yan, Dong Zou, Chen Li, Zhang Zhang, Shuhui Song,*,Xiangfeng Wang
1 Department of Crop Genomics and Bioinformatics, College of Agronomy and Biotechnology, China Agricultural University,Beijing 100094, China
2 China National Center for Bioinformation, Beijing 100101, China
3 National Genomics Data Center & CAS Key Laboratory of Genome Sciences and Information, Beijing Institute of Genomics, Chinese Academy of Sciences, Beijing 100101, China
4 University of Chinese Academy of Sciences, Beijing 100101, China
5 Rice Research Institute, Guangdong Academy of Agricultural Sciences, Guangzhou 510640, China
KEYWORDS Rice;SNP;Database;HapMap;Panel
Abstract The information commons for rice (IC4R)database is a collection of 18 million single nucleotide polymorphisms (SNPs) identified by resequencing of 5152 rice accessions. Although IC4R offers ultra-high density rice variation map, these raw SNPs are not readily usable for the public.To satisfy different research utilizations of SNPs for population genetics,evolutionary analysis,association studies,and genomic breeding in rice,raw genotypic data of these 18 million SNPs were processed by unified bioinformatics pipelines. The outcomes were used to develop a daughter database of IC4R–SnpReady for Rice(SR4R).SR4R presents four referenceSNP panels,including 2,097,405 hapmapSNPs after data filtration and genotype imputation,156,502 tagSNPs selected from linkage disequilibrium-based redundancy removal, 1180 fixedSNPs selected from genes exhibiting selective sweep signatures, and 38 barcodeSNPs selected from DNA fingerprinting simulation. SR4R thus offers a highly efficient rice variation map that combines reduced SNP redundancy with extensive data describing the genetic diversity of rice populations. In addition, SR4R provides rice researchers with a web interface that enables them to browse all four SNP panels,use online toolkits,as well as retrieve the original data and scripts for a variety of population genetics analyses on local computers. SR4R is freely available to academic users at http://sr4r.ic4r.org/.
Introduction
Rice(Oryza sativa)is the first crop with genome sequenced.In the past decade,thousands of rice accessions in the germplasm banks worldwide have been genotyped [1] and numerous rice variation databases have been constructed. One of these databases is the rice variation database(RVD;http://variation.ic4r.org/), a daughter database of the Information Commons for Rice consortium (IC4R) [2]. RVD is a collection of 18 million single nucleotide polymorphisms (SNPs) identified from 5152 rice accessions based on whole-genome resequencing data,and offers an ultra-high-density rice variation map,with about one SNP per 20 bases on average. The information contained in this high volume of raw SNPs is not ready for use until it has been processed to remove low-quality SNPs,such as those with missing/low-frequency genotypes, or redundant SNPs identified due to linkage disequilibrium (LD). In addition, different types of research activities require different magnitudes of SNPs to ensure efficient computation and accurate results.For example,requirements are different for evolutionary studies using comparative genomics and pan-genome analysis,gene mapping by quantitative trait loci(QTL),genome-wide association study (GWAS) analysis, molecular breeding by markerassisted selection(MAS)and genomic selection(GS),as well as variety protection by DNA fingerprint barcoding.
Construction of a reference haplotype map (HapMap) to represent the maximal population diversity for a species is the first step.The 18 million raw SNPs in RVD provide an initial variation data set to generate a reference HapMap for rice.According to the human HapMap from The International Genome Sample Resource (https://www.internationalgenome.org/), which contains over 3.1 million high-quality SNPs, a density of one SNP per 100 bases is sufficient for performing genotype imputation, GWAS analysis, and mapping of causal variations [3]. Because the genome size of rice is ~400 Mb,about two million high-quality SNPs may offer an ideal density of one SNP per 200 bases.Such density of a reference rice HapMap is especially useful for molecular breeders to perform genotype imputation to infer missing genotypes or increase SNP density, as low-density genotyping platforms are mostly used in rice to lower genotyping expense.
For population genetics studies in which thousands of individual samples are assessed,millions of SNPs in an entire Hap-Map are excessive. The redundant SNPs in a HapMap extensively increase computing costs, and may also reduce the accuracy of results. To circumvent these challenges,a subgroup of SNPs whose genotypes are significantly correlated with other SNPs in the same LD region is selected; these are known as tagging SNPs. The number of tagging SNPs may vary between species and populations, depending on the lengths of LD regions in each group [4]. Based on the data in RVD, LD length in rice ranges 100–500 kb; thus 100,000 SNPs, which yields a density of one tagging SNP per 3–5 kb,is sufficient for various genetic diversity analysis.
The expense of genotyping is an important factor to consider in crop molecular breeding, as molecular breeding typically requires the rapid genotyping of thousands of samples,often within days or even hours. Therefore, low SNP density genotyping technologies, such as SNP chip or Kompetitive Allele Specific PCR (KASP)-based platforms, are usually preferred by industrial seed companies.These methods offer great flexibility by combining the rapid identification of low numbers of SNPs (several to a few dozen) with the ability to multiplex hundreds to thousands of DNA samples.However,these methods suffer from lack of precision.
Modern breeding methods demand the efficiency and stability of a highly concise marker panel containing around 1000 SNPs. SNPs used to select plants for breeding typically occur in genes or genomic regions that are associated with agronomic traits believed to be subjected to selective pressures[5].Genes with variations exhibiting selectively fixed signatures can be identified based on the θπ andFstvalues computed by selective sweep analysis[6].This magnitude of SNPs is suitable for synthesis on low-density SNP chips, which are then used for conducting certain types of molecular analyses, such as MAS,seed purity or heterozygosity testing,genetic component analysis,and subpopulation classification.For intellectual protection of commercial rice varieties, DNA fingerprinting typically uses only 12–36 SNPs, to generate a combination of barcodes with maximal resolution to distinguish commercial varieties in the seed industry or germplasm accessions in Gen-Bank. Simulation of all possible combinations of a set of candidate SNPs has to be tested in a large germplasm population to ensure the maximal resolution with fewest markers,such as the MinimalMarker algorithm [7].
To enhance the ability of researchers to effectively use the RVD in IC4R, we developed SnpReady for Rice (SR4R), a daughter database of IC4R. SR4R enables researcher to readily retrieve SNPs that are relevant to their own research activities, thus saving time and computational resources. In SR4R,the 18 million SNPs have been divided into four categories:hapmapSNPs, tagSNPs, fixedSNPs, and barcodeSNPs (Figure 1). SR4R allows users to browse the information associated with each SNP panel, and also to download each set of genotype files for local use.SR4R also offers 18 bioinformatics tools and pipeline scripts, enabling users to run the tools locally to perform genotype imputation, basic statistical analysis, genotype file format conversion, SNP filtration and extraction, population structure analysis, genetic diversity analysis,rice subpopulation classification,DNA fingerprinting analysis, and other additional functions.
Database content and analytical modules
The hapmapSNP panel
RVD in IC4R is a collection of 18 million SNPs with related annotation information, identified from previously published whole-genome resequencing of 5152 rice accessions [2]. Such a high-density rice variation map, which identifies one SNP per 20 bases on average, offers the possibility to generate a high-density HapMap for the rice research community.Generation of such a high-density HapMap was the first step to create SR4R described in the current study.
To ensure the quality of HapMap, we performed an initial filtration of samples and SNPs on the raw data set of 5152 accessions (Materials and methods). First, a total of 2556 accessions with genotype missing rate <20% were selected;each selected accession has been documented with explicit subpopulation classification and origins (Table S1). Then, SNPs with genotype missing rate ≥0.1 and minor allele frequency(MAF) ≤0.05 were removed. Genotype imputation on theresulting 2,883,623 SNPs in the selected 2556 accessions yielded a high-quality HapMap containing 2,097,405 SNPs,without any missing genotypes using the software Beagle(version 3.3.2)[8].These 2,097,405 SNPs were regarded as the hapmapSNP panel and were used as the initial data set for generating the other three SNP panels (Figure 2A–D).
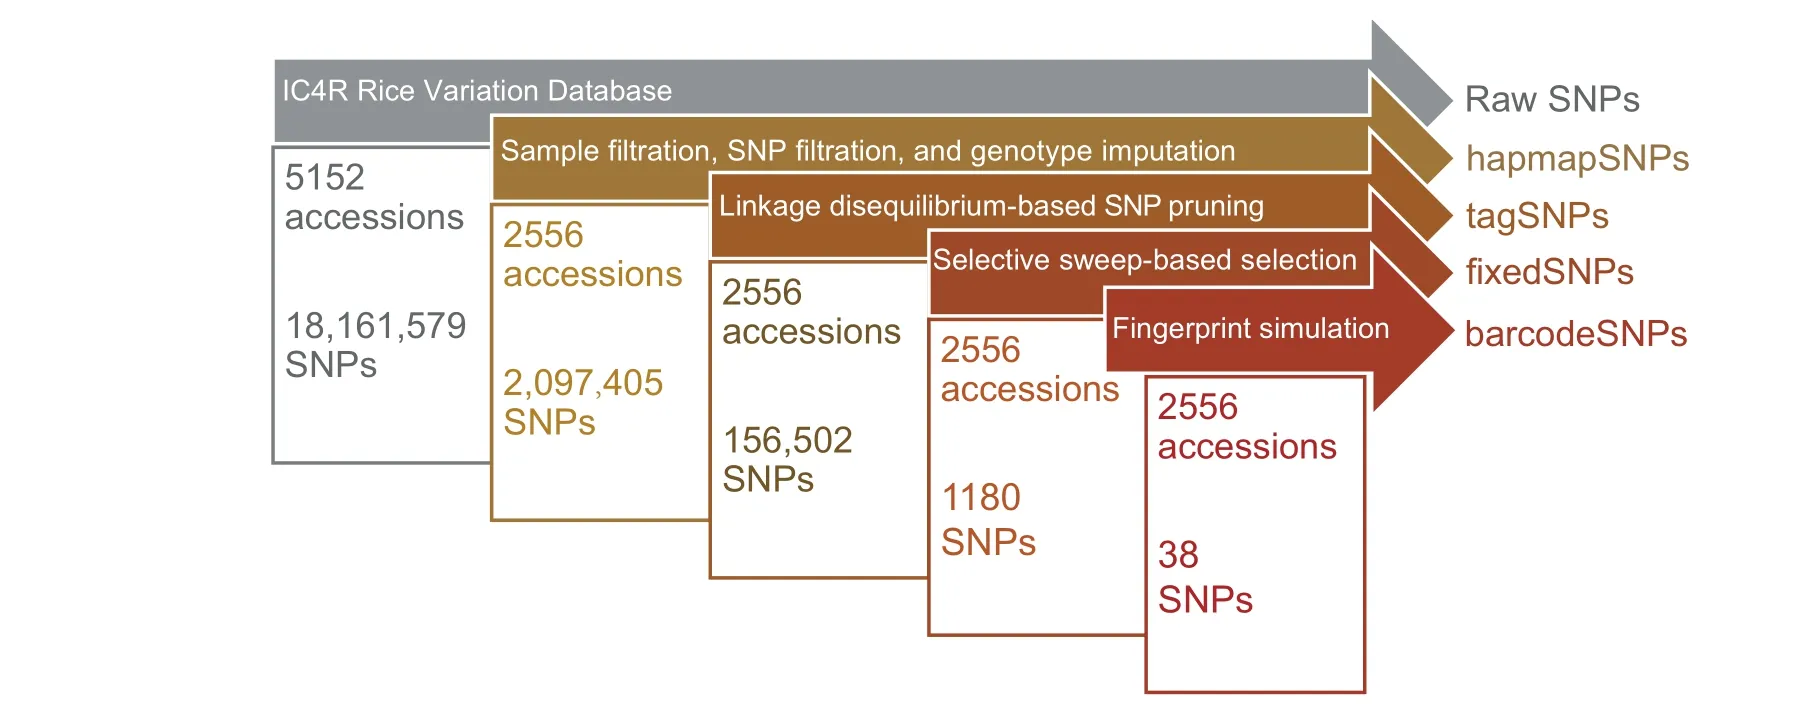
Figure 1 An overview of the four SNP panels of the SR4R database
The generated reference HapMap of rice has an average density of one SNP per 200 bp with a heterozygosity rate of 1.75% (Figure 2E). Genome-wide distribution statistics showed that 58.34% of the hapmapSNPs are present in the intergenic regions, 12.52% in the intronic regions, 11.79% in the exonic regions, 0.02% on the splicing sites. Also, 10.55%and 6.78% hapmapSNPs are found to be located in the upstream and downstream regions (1 kb away from transcription start site and transcription end site,respectively)of a gene territory,respectively(Figure 2F).The 2,097,405 hapmapSNPs with genotypes of 2556 accessions are available to download,enabling users to perform genotype imputation on local genotype data to increase the density of SNPs generated from lowdensity genotyping platform.
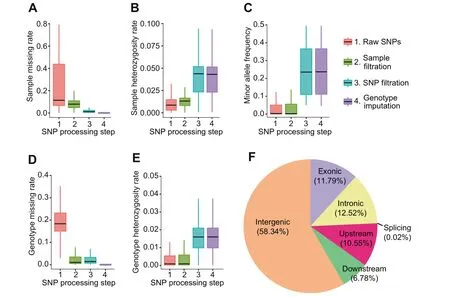
Figure 2 Basic statistics of the rice hapmapSNPs after four steps of genotype processing
The tagSNP panel
High SNP density is beneficial to precise mapping of traitrelated genes with GWAS analysis,but is not suitable for population genetic analysis, because SNP redundancy may add unnecessary computational costs and introduce bias to the results[9].Since SNPs within the same LD region possess correlated genotypes forming one haplotype block, a representative SNP is usually selected as a tag to solve the redundancy issue. We adopted an LD-based SNP pruning procedure to infer haplotype tagging SNPs (tagSNPs) from the hapmapSNPs (Materials and methods). As a result, 156,502 tagSNPs were identified. To verify whether the tagSNP panel properly represents the genetic diversity of the population,phylogenetic analysis using the 156,502 tagSNPs was performed on the 2556 rice accessions, which were explicitly documented with subpopulation classification and origins.As shown in Figure 3A, the resulting phylogenetic tree clearly exhibited six major clades, representing the five cultivated rice subpopulations and one wild rice subpopulation. The five cultivated rice subpopulations includeindicarice (Indfor short)containing 1655 accessions,Ausrice (Aus) containing 182 accessions,Aromatic(Aro)rice containing 56 accessions,tropicaljaponicarice (TrJ) containing 318 accessions, and temperatejaponicarice (TeJ) containing 327 accessions, whilst the wild rice subpopulation contains 18O. rufipogon(Oru) accessions. In addition, principal component analysis (PCA)-based (Figure 3B) and admixture-based analysis (Figure 3C)showed the same pattern,with the subpopulation classification as the phylogenetic tree indicated. For population admixture structure analysis, a predefined parameter of ‘‘K value” was used to mandatorily estimate the number of subpopulations and for each K value,in which each subpopulation was represented by a unique color to visualize the genetic composition.Because the optimal number of subpopulation is usually unknown, a common way is to use a series of K value to estimate the optimal K parameter. It is worth noting that thejaponica,Ind, andAussubpopulations were explicitly separated with K = 3, while the six subpopulations were clearly separated with K=8.In addition,with K=4–7,theIndsubpopulation showed clear structure divided into six subgroups,denoted as S1 to S6,as indicated by both PCA and admixture analysis(Figure 3D,S1A and B).The genetic structures of the six rice subpopulations and the sixIndsubgroups are consistent with previous reports [10].

Figure 3 Population structure analysis of the 2556 rice accessions using tagSNPs
Genetic diversity analysis with the tagSNP panel
The tagSNP panel represents a subset of the hapmapSNPs after approximately 92.5% of the genetic redundancy was removed. To test the effectiveness of the 156,502 tagSNPs,we performed another series of standard genetic diversity analyses and examined whether the results agreed with previous reports. First, we found that the count of homozygous SNPs and the heterozygosity rate of the accessions in the six subpopulations showed opposite trends: while the accessions in theTeJsubpopulation had the highest count of homozygous SNPs and lowest heterozygous rate, the accessions in theIndsubpopulation had the lowest count of homozygosity SNPs and highest homozygosity rate(Figure 4A and B).The identity by state(IBS)analysis is a commonly used method to measure the similarity of alleles in a designated population, which may reflect the genetic diversity of the whole population and subpopulations. Comparison of the IBS values among different subpopulations may help understand the degree of genetic differentiation in different subpopulations. In order to validate whether the IBS results generated from the tagSNPs are consistent with previous reports regarding the genetic diversity in different subpopulations, pairwise computation of the IBS values between each pair of accessions within the same subpopulation was performed, and the results showed thatTeJrice has the highest IBS values,while theIndrice has the lowest ones (Figure 4C). In addition, runs of homozygosity (ROH)analysis indicated that theTeJrice has the highest number of and longest ROH regions, while theIndrice has the fewest and shortest ROH regions (Figure 4D). This pattern agreed with the result from LD decay analysis showing thatTeJrice has the slowest LD decay rate while theIndrice has fastest decay rate (Figure 4E). Computations of θπ andFstare commonly used methods to measure genetic diversity within population and between population, respectively (Materials and methods). The within-subpopulation diversities of the six rice subpopulations areOru(θπ = 0.218),Ind(θπ = 0.216),Aus(θπ = 0.182),Aro(θπ = 0.145),TrJ(θπ = 0.116), andTeJ(θπ = 0.068) (Figure 4F). Using the wild rice subpopulation as reference,the genetic distances of the five types of cultivated rice subpopulations to wild rice areTeJ(Fst= 0.476),TrJ(Fst= 0.419),Aus(Fst= 0.299),Ind(Fst= 0.266), andAro(Fst= 0.241), suggesting the highest domestication level ofjaponicarice compared to other rice (Figure 4F and G).The collective results from multiple angles of standard genetic diversity analyses were consistent with previous reports thatIndrice has a more complicated genetic composition and origin compared to the other five subpopulations [11].
GS analysis with the tagSNP panel
GS has been widely used in industrial animal and crop breeding programs [12], which usually employs a best linear unbiased prediction (BLUP) model. The BLUP model is first trained with known genotypes and phenotypes of reference population samples, usually accounting for 20%–50% of a breeding population, and then used to predict the unknown phenotypes of the remaining genotyped samples(the candidate population).The predicted phenotypes,known as the genomic estimated breeding values (GEBV), are ranked from high to low,and can be used to assist in deciding upon a hybridization plan. Although GS may significantly shorten the breeding cycle, the cost for genotyping has been a vital factor because the GS model has to take genome-wide SNP markers as input,especially from crop breeding in which thousands to hundreds of thousands of individuals need to be genotyped. In order to lower genotyping cost, compilation of a set of thousands of SNPs that may best represent the overall genetic backgrounds of a breeding population is of great importance.
Because the 156,502 tagSNP category is a high-quality marker set after removing redundancy at most while preserving maximal genetic diversity, it may be considered as a marker pool for selecting high-efficiency SNPs for genomic selection.To test the effectiveness, we analyzed a previously published data set containing 414 rice parental lines with non-missing genotypes of 29,434 SNPs profiled by the Illumina rice 44 K SNP chip, and nine phenotype traits (flowering time, panicle fertility, seed width, seed volume, seed surface area, plant height,flag leaf length,flag leaf width,and florets per panicle).To perform GS, we built a model using the ridge regression BLUP (rrBLUP) algorithm [13], and prediction accuracy was evaluated with Pearson correlation between observed and predicted traits by five-fold cross validation. The evaluation was performed using five different SNP combinations: Set-1, original 29,434 SNPs on the 44 K chip;Set-2, 1090 SNPs overlapping between the 156,502 tagSNPs and the aforementioned 29,434 SNPs in Set-1; Set-3, 1090 SNPs randomly selected from the aforementioned 29,434 SNPs; Set-4, 1090 SNPs evenly distributed in the genome(one SNP per 350 kb)selected from the aforementioned 29,434 SNPs;and Set-5,1090 consecutive SNPs localized within a randomly selected genomic region from the aforementioned 29,434 SNPs. Then the rrBLUP prediction was performed on the nine phenotype traits using the five sets of SNPs to compare prediction accuracies (Figure 5). Although prediction accuracies varied greatly,ranging 0.23–0.90 among the nine traits due to different heritability of each trait,the trend of the five SNP sets for the same trait was generally consistent. Except for the trait of panicle fertility in which Set-2 (1090 tagSNPs) exhibited the highest prediction accuracy,Set-1(full 29,434 SNPs)showed the highest prediction accuracy for the other eight traits followed by Set-2 in the second position. We further performed pairwise student’st-test for Pearson correlations of Set-2 and the other four sets, we found that Set-2 significantly (P≤0.05) outperforms other randomly selected SNPs in Set-3 to Set-5 for some traits(Figure S2).These results indicate that selection of about 1000 tagSNPs from the tagSNP pool might be a feasible option to lower genotyping budget; for example, these SNPs could inform the synthesis of a new low-density SNP chip rather than using high-density SNP chip.
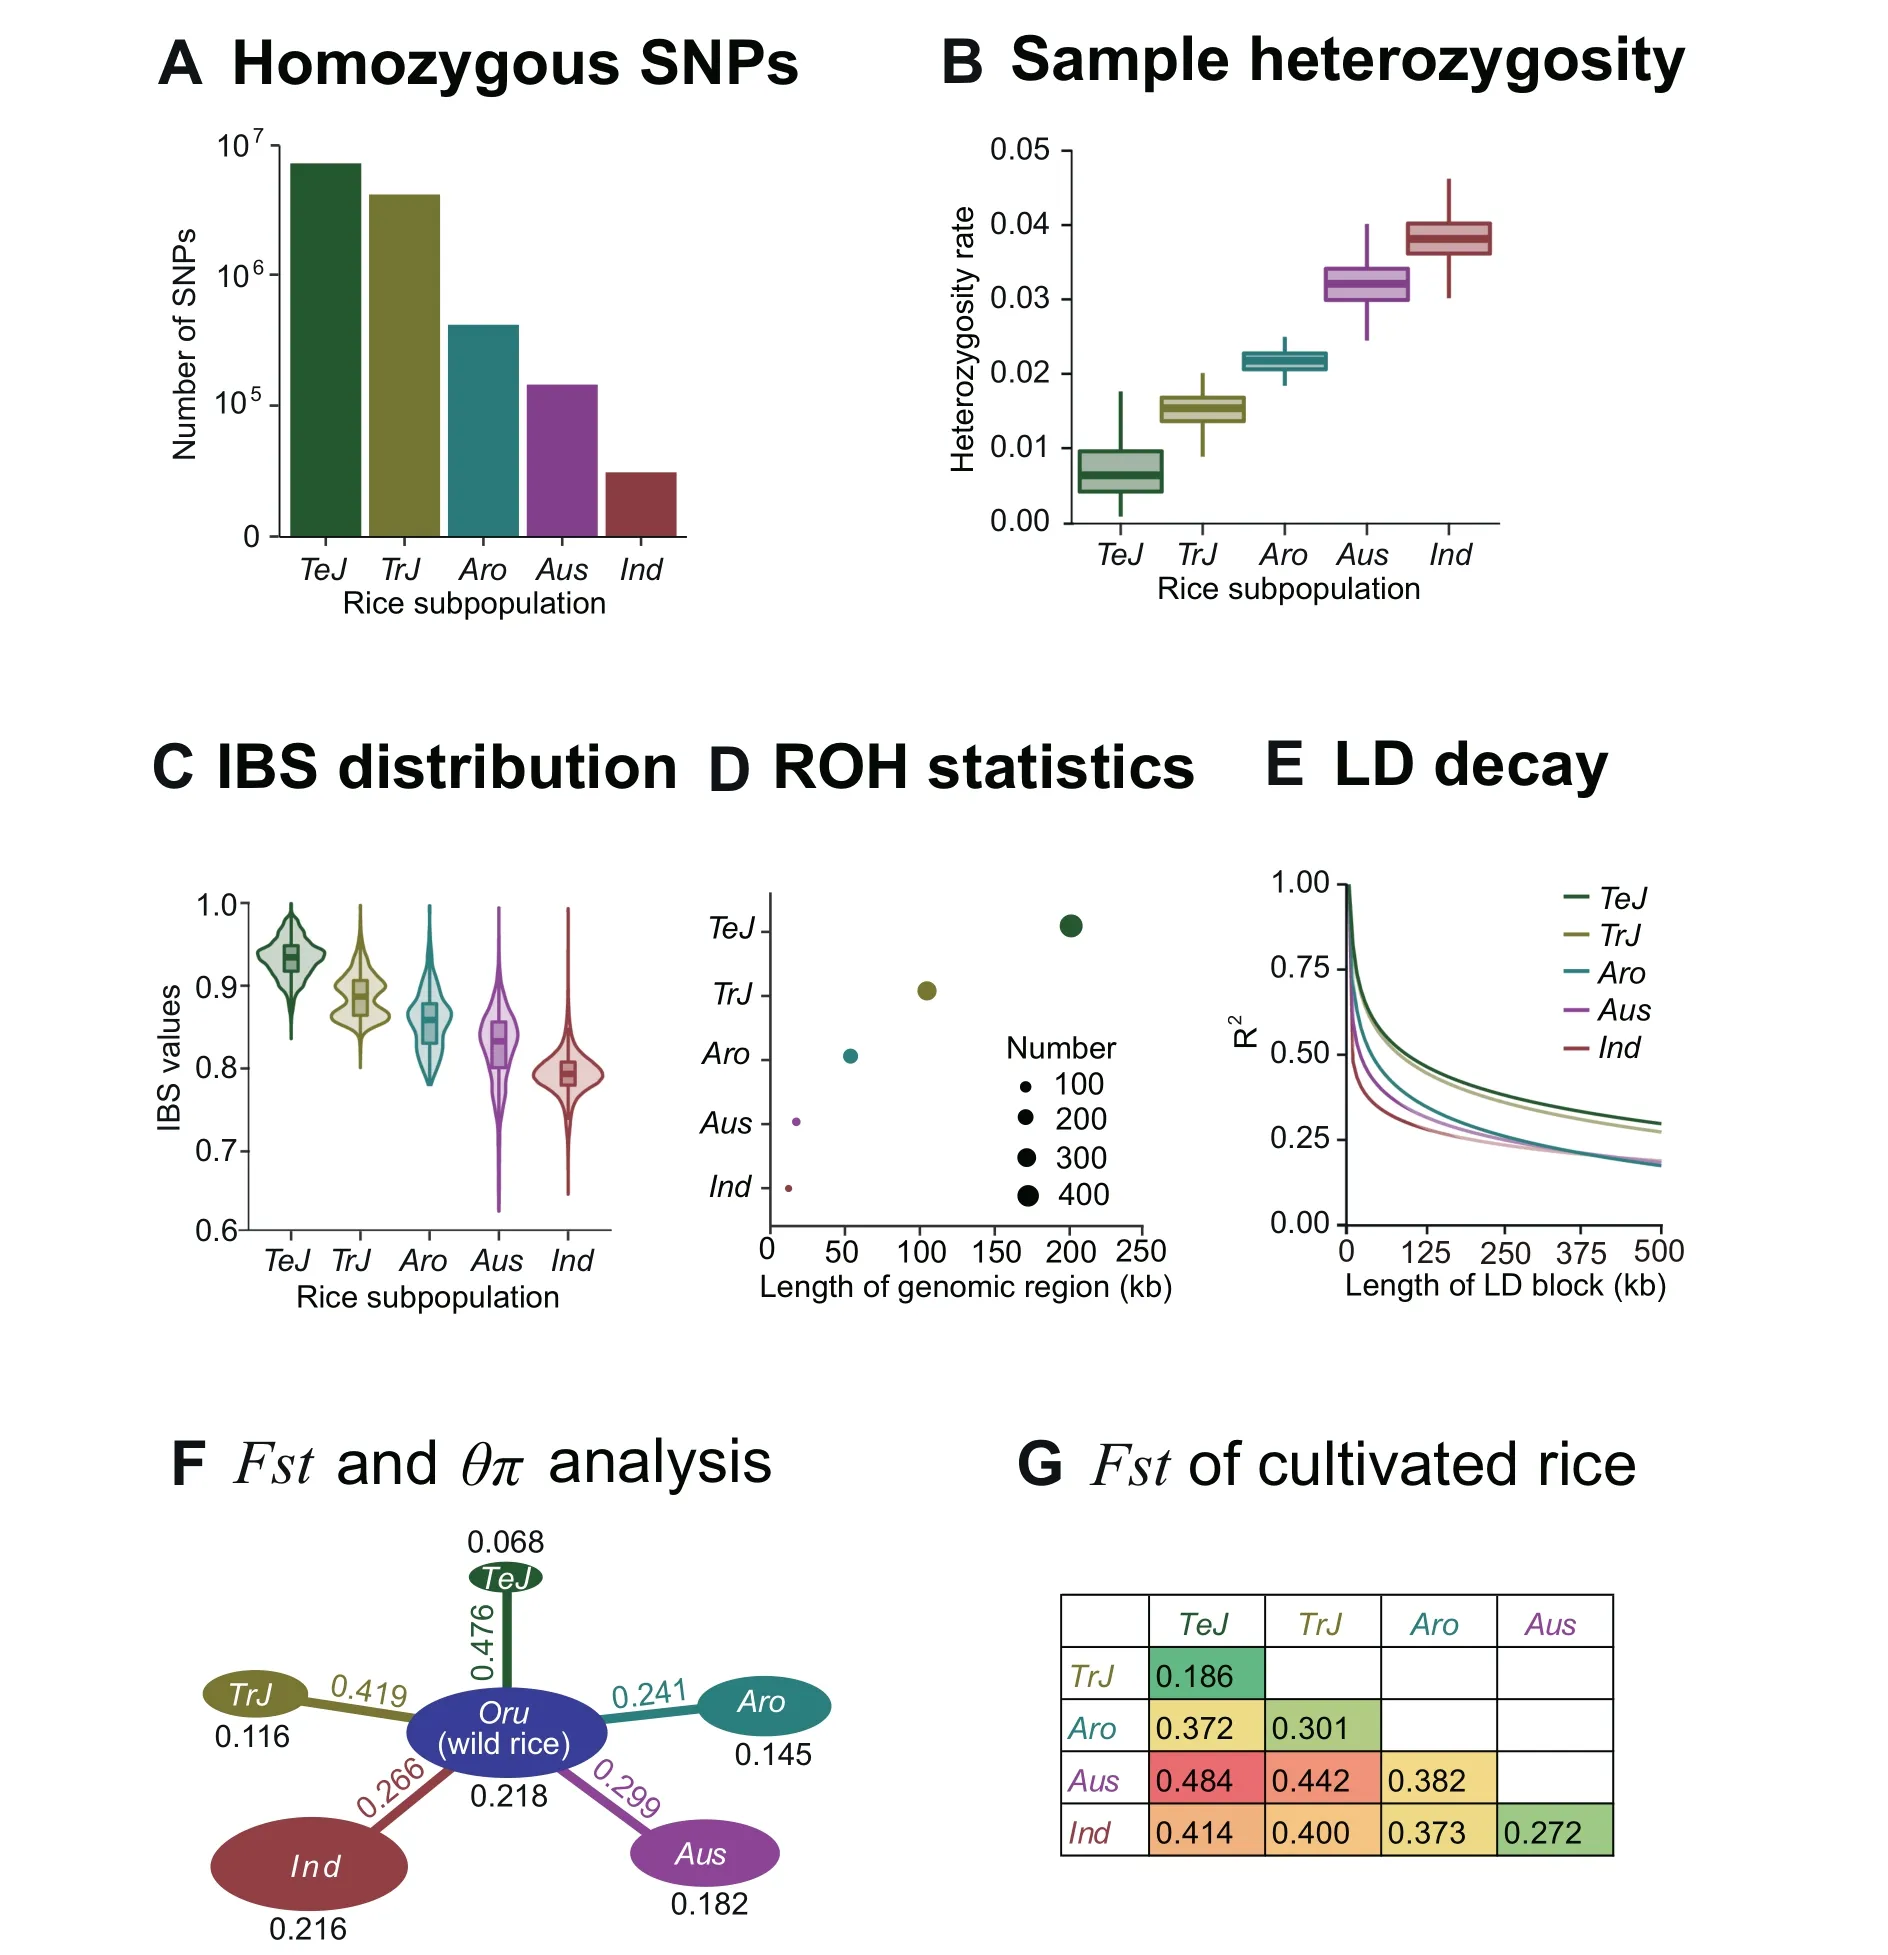
Figure 4 Genetic diversity analysis of rice accessions using tagSNPs
The fixedSNP panel
In the crop breeding industry, genotyping cost per sample is a top-priority factor,since hundreds to thousands of samples are often genotyped in a single day.The data then assists a variety of molecular breeding practices, including GS-assisted phenotype prediction, marker-assisted backcrossing, seed purity or genotype heterozygosity analysis, and subpopulation identification.Cost reduction is usually fulfilled by compiling a highly effective marker panel containing only dozens to hundreds of SNPs that are available for high-throughput genotyping platforms,such as Douglas ArrayTape and LGC Omega-F equipment, using the KASP genotyping assay. These systems allow users to flexibly combine different numbers of SNPs and DNA samples using multiple plates with 96 or 384 wells per run. To meet the industrial demand, further compression of the tagSNP panel must consider not only the genetic relationship between subpopulations and accessions, but also the evolutionary and/or functional significance of SNPs with high diagnostic effectiveness and stability.
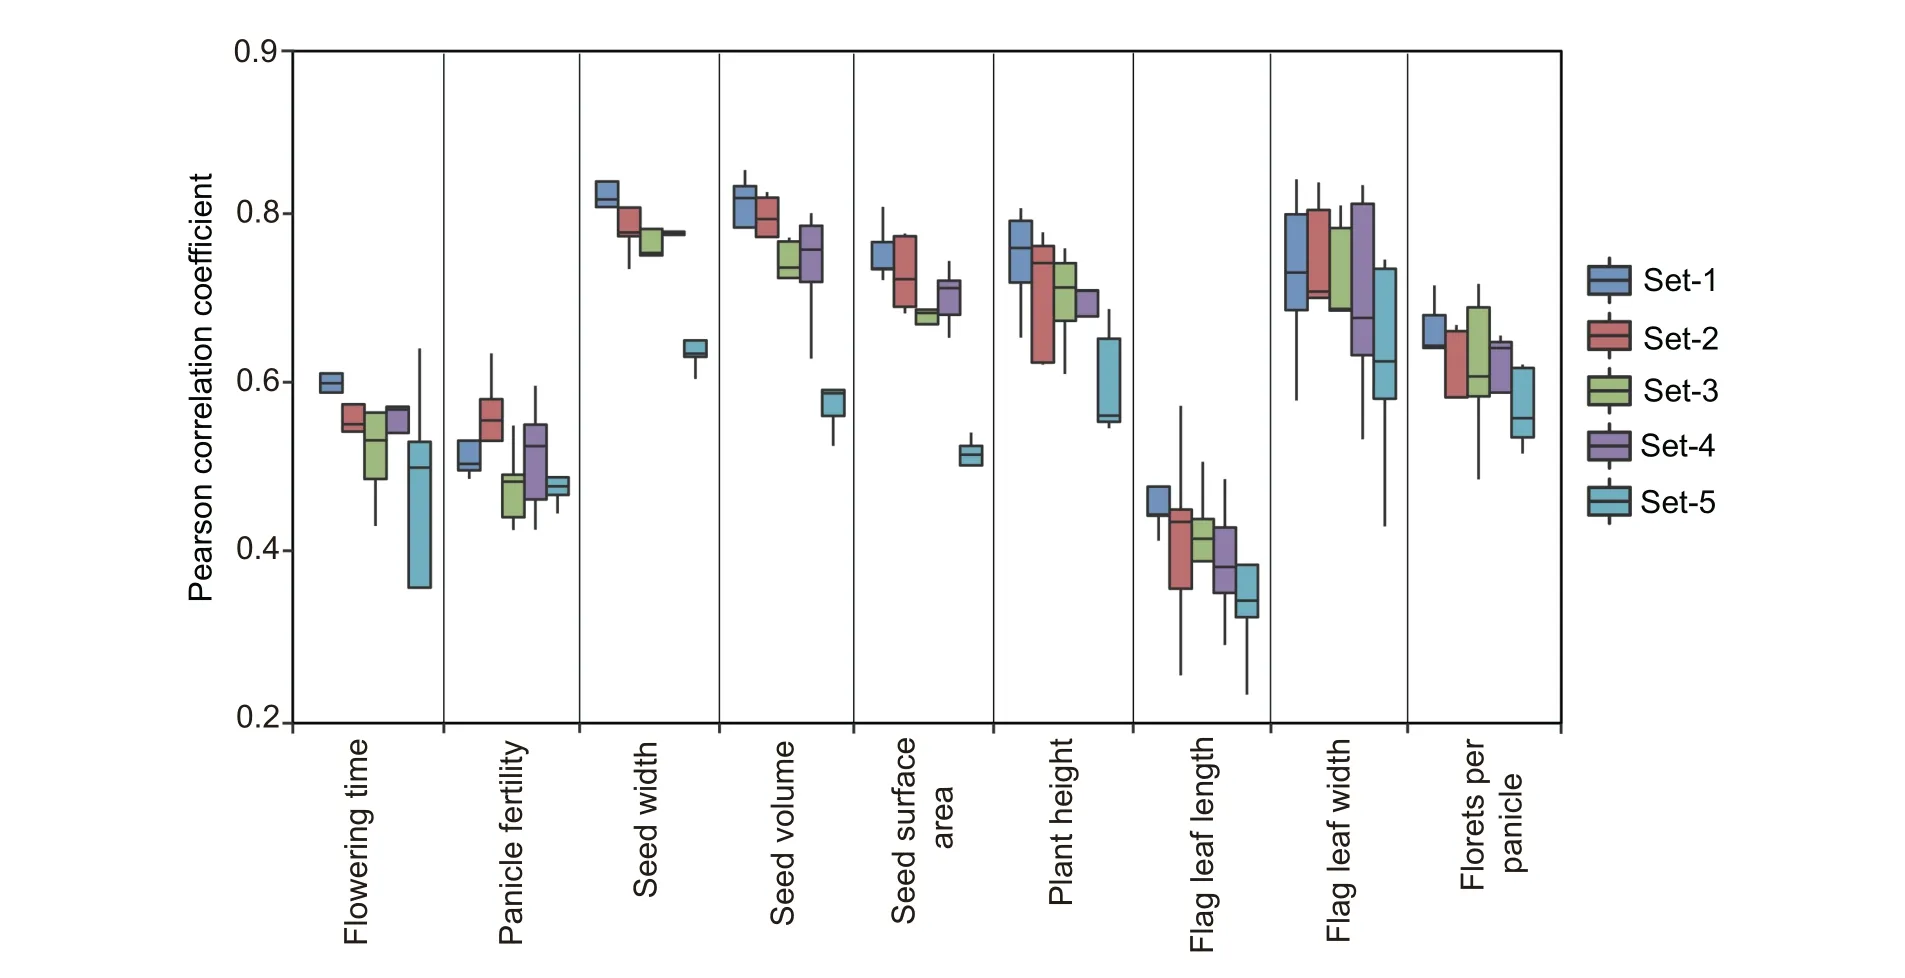
Figure 5 GS-based phenotype prediction using tagSNPs
TheFstand θπ values are commonly used indicators of genomic regions demonstrating signatures of selective sweeps,caused by domestications, artificial selections, or environmental adaption. SNPs in selective sweep regions are usually evolutionarily fixed with strong positive selection signals. To generate the fixedSNP panel, we first identified the selective sweep regions that are specific to each subpopulation or common to the six subpopulations by ranking within the top 5%of bothFstand θπ ratios based on the comparison of the cultivated subpopulations against the wild rice population(Materials and methods) (Figure 6A). Using 100-kb and 10-kb windows, large and small genomic regions showing selective sweep signals were identified, respectively. In total, 227 (cultivatedvs.wild subpopulations), 381 (Ind vs.wild), 333 (Aus vs.wild), 296 (Aro vs. wild), 256 (TrJ vs. wild) and 269 (TeJ vs.wild) identified regions showed significantly (t-test;P≤0.05)smallerTajima’ Dvalues compared to other genomic regions(Figure 6B).Subsequently,genes located in the selective sweep regions and their corresponding gene set enrichment analysis(GSEA) terms were further identified for each subpopulation.We found that ~50% of GSEA terms are specific to each subpopulation,whilst only 27 GSEA terms co-exist in the five cultivated rice subpopulations (Figure 6C). Finally, a total of 1180 SNPs occurring within the genes in the selective sweep regions were selected to generate the fixedSNP panel.
Subpopulation classification analysis with the fixedSNP panel
To evaluate the fixedSNP panel, subpopulation classification with phylogenetic tree analysis was performed using the 1180 fixedSNPs, and the results were compared with the results obtained using the 156,502 tagSNPs on the same population of 2556 accessions. All of the accessions were assigned to the correct subpopulations with tagSNPs and the phylogenetic tree showed consistent structure with the tree constructed using fixedSNPs (Figure 6D). To further evaluate the universality of the fixedSNP panel,we performed subpopulation classification on two external populations genotyped by SNP chips [11,14].One chip data set contained 880 cultivated rice accessions genotyped by the Affymetrix 700 K SNP chip, while the other contained 351 cultivated accessions genotyped by the Illumina 44 K SNP chip. Both external chip data sets have been documented with clear subpopulation classifications and origins,and possess relatively high genetic diversity. Only 314 and 63 SNPs from the 700 K and 44 K chips,respectively,were found in the 1180 fixedSNP panel. For the chip data set containing 880 accessions, 877 accessions were correctly assigned to their documented subpopulations; threeTeJaccessions(IRGC121549, IRGC121520, and IRGC121535) were incorrectly assigned to theTrJsubpopulation (Figure 6E). As for chip data set containing 351 accessions, 348 were assigned to the correct subpopulation; threeTeJaccessions (NSFTV134,NSFTV204, and NSFTV283) were mistakenly assigned toTrJrice (Figure 6F). Overall, 99.8% of the rice accessions examined were assigned to previously documented subpopulation records using markers extracted from the fixedSNP panel,indicating that the fixedSNP panel is an efficient,accurate new tool for subpopulation classification.
The barcodeSNP panel
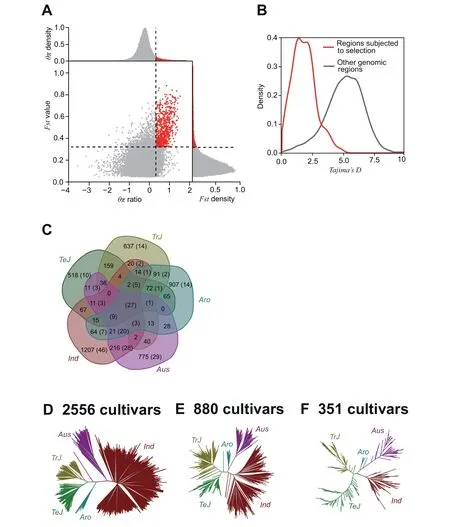
Figure 6 Screening and validation of fixedSNPs
DNA fingerprinting technology using a small set of SNPs to generate a series of genotype combinations,referred to as barcodes, has become an economical means to protect commercialized varieties. Thus, the barcodeSNP panel must be able to uniquely identify these barcodes to distinguish each of the rice varieties on the market. To ensure highest uniqueness using lowest count of barcodeSNPs, we applied the MinimalMarker algorithm on the fixedSNP panel to exhaustively traverse all possible genotype combinations that would distinguish the 2556 accessions (Materials and methods). The MinimalMarker algorithm generates three sets of minimum marker combinations, in which each set contains 28 SNPs.After merging the three sets, 38 barcodeSNPs were finallyselected to generate the panel (Figure S3A). In addition,upstream and downstream flanking sequences were also provided for users to design primers for KASP genotyping assays.
SR4R also offers a web interface that allows users to identify corresponding accessions or varieties when rice varieties are submitted for genotyping with any number of barcodeSNPs ranging 8–38. The SR4R returns a list of the top 10 best-matched accessions/varieties in the database, and displays associated information including the accession/variety IDs, number of mismatched bases, genomic position of the barcode, genotype heterozygosity, as well as documented subpopulation and origin. Among the top 10 hits, if multiple best-matched varieties with 100% identity are returned using a certain number of barcodes, the users may genotype additional barcodeSNPs until a unique best matched variety is identified. It is worth noting that because the SR4R does not have a complete list of the barcodes for all commercial rice varieties in the database, the aforementioned 38 barcodeSNPs is considered as an initial panel for users to test the best combinations with the optimal sensitivity and specificity using flexible numbers of markers.
Machine learning analysis with the barcodeSNP panel
If a new variety genotyped with barcodeSNPs is not found in the database, SR4R will perform subpopulation classification.The traditional method of subpopulation classification first integrates the genotype of the submitted variety with the genotypes of all the varieties in the database, then performs phylogenetic analysis to determine the best assigned subpopulation.This procedure is tedious and computationally inefficient since the database contains hundreds of thousands of accessions.To simplify the procedure for implementation through a web interface, we adopted an alternative method that utilizes machine learning-based subpopulation classification models,using the 38 barcodeSNPs as features. We employed all of the 2556 rice accessions to evaluate seven commonly used machine learning algorithms for performing subpopulation classification, followed by ten-fold cross validation assessment(Materials and methods). The seven machine learning algorithms include decision tree (DT), k-nearest neighbors(KNN), na?¨ve Bayesian (NB), artificial neural network(ANN), random forest (RF), one-vs-rest logistic regression(LR-O), and multivariate logistic regression (LR-M). A series of assessments of the classification precision in the five cultivated rice subpopulations indicated that, out of the seven methods tested, the best one is the LR-M model, whose area under the curve (AUC) values were ≥0.99 for all subpopulations (Figure S3B–H). Additional methods are one-vs-rest logistic regression and the random forest model; where results from each yielded similar classification precision to the LR-M model. Then, we used an independent data set containing 880 rice accessions profiled by the Affymetrix 700 K rice SNP chip for validation. The LR-M model was trained by the 2556 rice accessions, and then predicted the subpopulation classifications on the 880 samples. The AUC values were all ≥0.99 for all subpopulations in this independent data set, indicating robustness of the model (Figure S4A). Moreover, comparison of the original label and the predicted label with the maximal probability for each sample showed that the true positive rate(TPR) and false positive rate (FPR) are also reasonable(Figure S4B). The pre-trained classification models with the seven machine learning algorithms have been implemented on the SR4R server as a web tool, users can perform subpopulation classification when the genotype information of the 38 barcodeSNPs is submitted.
The barcodeIndel panel
Indels are another form of genomic variations(usually <50 bp in length) that can be used as molecular markers for a variety of population analysis. From the 5152 rice accessions, a total of 4,217,174 raw Indels variations were identified using the IC4R variation calling pipeline [2]. After filtering low-quality Indels,109,898 high-confidence Indels were retained with missing rate <0.01 and MAF ≥0.05 within the 2556 rice accessions. Among the 109,898 high-confidence Indels, we further identified 62 subpopulation-specific Indels, which can be used as barcodeIndels to differentiate the six rice subpopulationsTeJ,TrJ,Aro,Aus,Ind, andOru, and the six subgroups ofIndrice S1–S6 (Table S2). The 109,898 high-confidence Indels can be download from SR4R for users’ customized analysis.
Web interface of SR4R database
Using unified bioinformatics pipelines,the genotype data of 18 million raw SNPs identified from 5152 rice accessions were processed to construct four reference panels of SNPs for different utilizations.Because genotype data processing is a complicated and computationally intensive procedure, the four SNP panels are readily usable for a variety of analyses,which would simplify task for rice researchers. For better sharing of SNPs and improvement of the rice variation map utility, we developed the SR4R database. Through the SR4R web interface,users may directly browse the four panels and retrieve detailed information related to the 2,097,405 hapmapSNPs, 156,502 tagSNPs, 1180 fixedSNPs, and 38 barcodeSNPs. In addition,protein-coding genes that exhibit strong selection signatures and are associated with the 1180 fixedSNPs were also included in the SR4R database with detailed functional annotations(Figure 1A). When users retrieve a SNP, such as the first SNP ‘‘OSA01S00001362”, the genomic location and the adjacent gene or the gene containing the queried SNP are displayed. Users may also retrieve a visualized allele frequency map in the six major subpopulations, and the six subgroups ofIndrice (Figure 7B).
The users may also download the four panels of SNPs along with the original genotype files for local analysisviahttp://sr4r.ic4r.org/download. In addition, the ‘‘Tools” module presents 18 handy scripts and pipelines that users may install on their local computers for a variety of analyses,including basic genotype processing,population diversity analysis, rice variety identification, and subpopulation classification. For example, assuming one user may want to perform a genotype imputation of the rice 44 K SNP chip, she or he may first download the file ‘‘hapmapSNPs-genotype.tar.gz(892 MB)” containing the genotypes of the 2,097,405 hapmapSNPs in 2556 rice accessions. Then, the user may use the pipeline and scripts demonstrated in Figure 7C to perform imputation on a local server. SR4R also offers two modules of online analysis. The first module is to use a machine learning-based method to assign the subpopulation type basedon the user-submitted genotype file including no more than 20 samples. The model will return the probability of the type of subpopulation assigned to each sample (Figure 7D). The second module is to perform DNA fingerprint analysis. When the user submits a genotype file containing no more than 20 samples, the model will search the accession database, and return the top three matches of existing varieties with the number of mismatched nucleotide and heterozygosity rate displayed (Figure 7E). The programs and scripts for these two modules along with demo input and output files are also available to download for local analysis of genotypes with large number of samples.
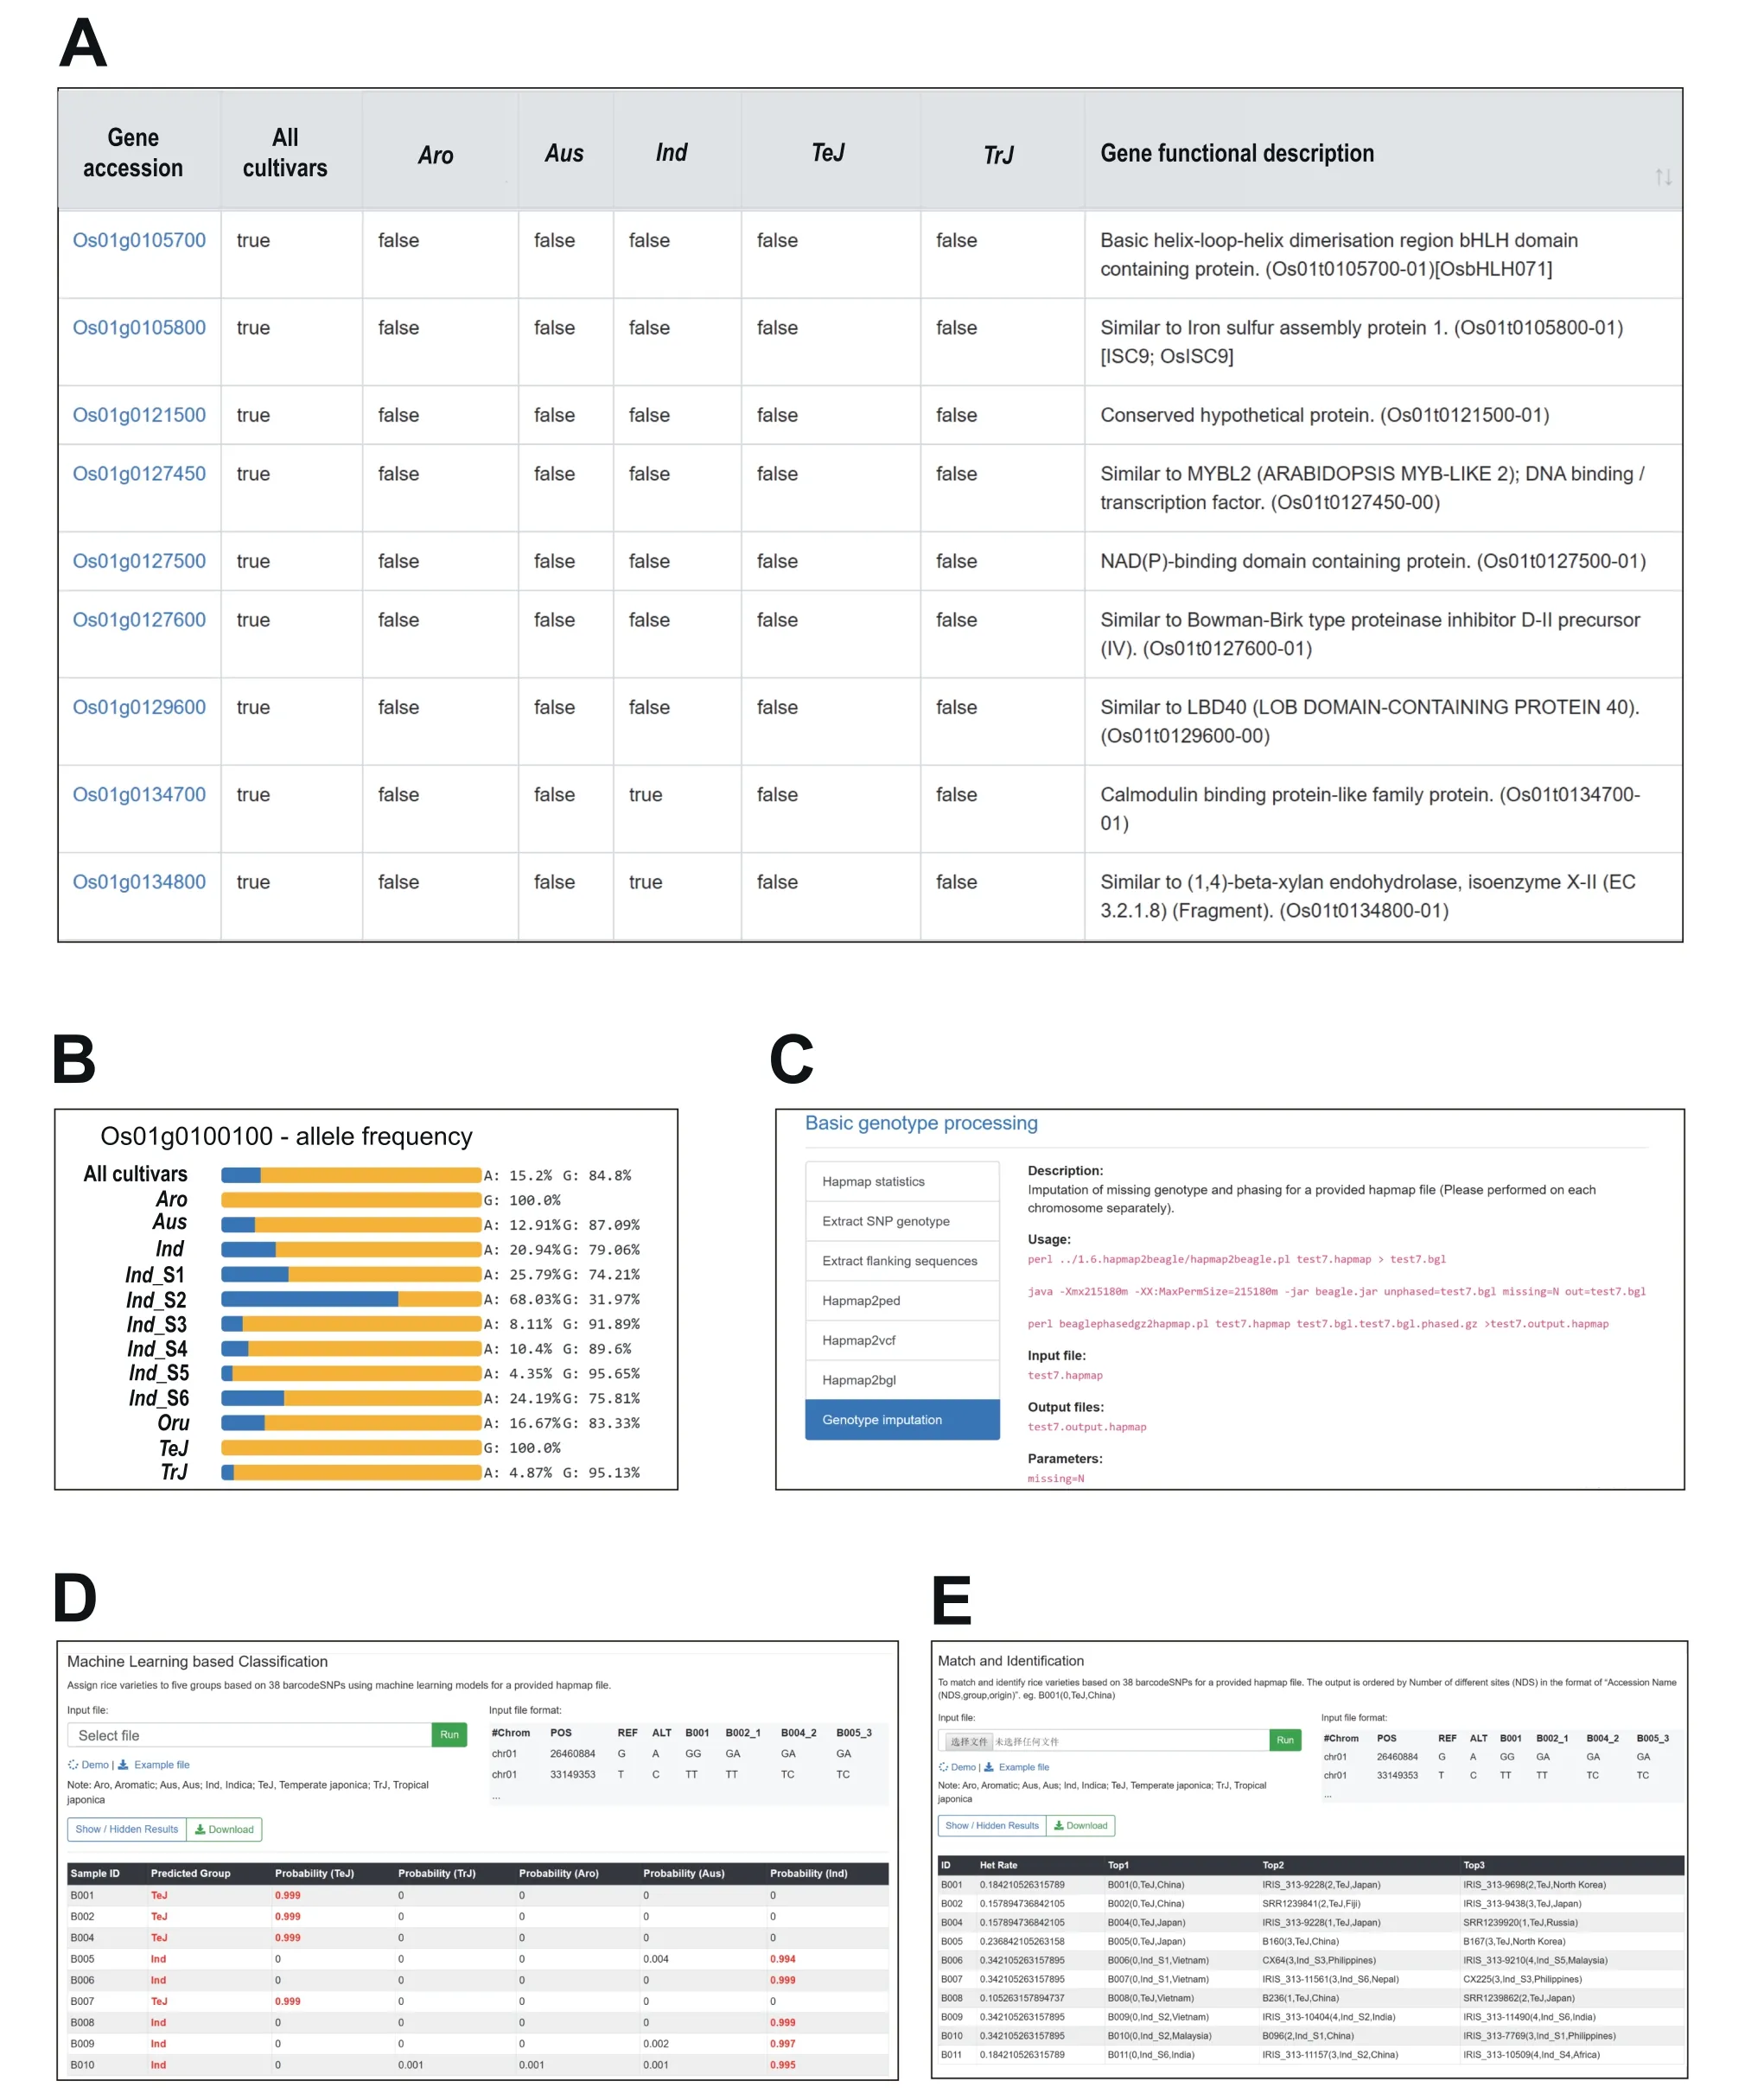
Figure 7 Representative functional modules in SR4R database
Perspectives and concluding remarks
RVD in IC4R collects 18 million raw SNPs identified from resequencing of 5152 rice accessions. To meet the different demands for the rice research community and breeding industry, we further generated four panels of 2,097,405 hapmapSNPs, 156,502 tagSNPs, 1180 fixedSNPs, and 38 barcodeSNPs with standard processing pipelines and uniform analytical parameters(Table S3).The four panels of SNPs can be either accessed online or downloaded for local use from the daughter database of RVD – SR4R. The hapmapSNP panel contains 2 million non-missing genotypes of 2556 accessions,offering a reference HapMap for genotype imputation and high-resolution GWAS analysis. The non-redundant 150 K tagSNP panel is an ideal magnitude for population genetics and evolutionary analysis for research purpose, as well as an ideal marker pool for GS-assisted breeding in rice. For a breeding population with about 500 F1hybrids, 1500–15,000 markers selected from the tagSNP panel can be used to build a GS model, reaching a satisfactory genotype-to-phenotype prediction accuracy. The fixedSNP panel with high effectiveness and stability can be regarded as a marker pool for various molecular breeding practice suitable for low-budget, flexible genotyping platforms,in terms of subpopulation classification,seed purity analysis, and genetic background analysis. The 38 barcodeSNPs selected by MinimalMarker algorithm is an initial marker set for generating DNA fingerprints for commercial rice varieties. Along with the barcodeSNP panel, two web-based tools, one for variety identification and the other for subpopulation classification,are offered in SR4R.In addition,the SR4R database also offers a series of standard pipelines used to construct the four sets of SNPs, and local handy tools to perform rice variety classification, barcode development, and other types of genetic and breeding research activities. With the incremental accumulation of population genotype data in the National Genomics Data Center, these bioinformatics tools can be applied to other animal or plant species such as corn, wheat, and soybeans, for a centralized reference HapMap and SNP panel databases for plants.
Materials and methods
Pipeline to compile hapmapSNP and tagSNP panels
The 18 million raw SNPs with genotype information of 5152 rice accessions were obtained from RVD (http://variation.ic4r.org). Accession filtration, SNP filtration, as well as basic statistics of SNP homozygosity and accession heterozygosity,were performed using in-house scripts. Genotype imputation of missing sites and phasing were performed using Beagle(version 3.3.2)[8].A SNP site with missing genotype was removed if an inferred genotype with a posterior probability was <0.5.Genomic annotation of hapmapSNPs was performed using ANNOVAR (version 20160201) against the rice genome in the International Rice Genome Sequencing Project (IRGSP).Using the reported LD length of rice ranging 40–500 kb, an LD-based SNP pruning method was used to construct the tagSNP category using PLINK with–indepcommand[15,16]. The PLINK (version 2.0) parameters were selected based on the variance inflation factor(VIF), which recursively removed SNPs within a sliding window of 50 SNPs and a step size of 5 SNPs to shift the window.
Tools for subpopulation structure analysis
The tagSNPs for 2556 rice accessions were concatenated as input sequences for constructing the phylogenetic tree using the neighbour joining algorithm implemented in MegaCC with pairwise gap deletion and 100 bootstrap replications [17]. The output tree file for all 2556 rice accessions and the subtree file ofIndrice accessions were visualized in MEGA (version 7.0)[18]. PCA of the 2556 rice accessions was done by flashPCA(version 2.0) [9]. Population admixture structure analysis was done by fastSTRUCTURE (version 1.0) using the variational Bayesian framework,kwas set in the range of 2–8 to infer the admixture of ancestors for the accessions.
Tools for genetic diversity analysis
Genetic diversity related analyses were mostly done using PLINK (version 2.0) [16]. Genome-wide pairwise IBS calculations were performed between each pair of accessions within the same subpopulation in order to deduce the genetic affinity,and an IBS pairwise distance matrix was generated for each subpopulation. The ROH analysis for each subpopulation used a sliding window method to scan the genotype of each accession for a given population at each marker position to detect homozygous segments. The parameters and thresholds applied to define ROH were set as follows: a minimum ROH length of 200 kb and a minimum number of 1000 consecutive SNPs included in an ROH.Correlation coefficient(r2)of SNPs was calculated to measure LD level for each subpopulation. The averager2value was calculated for each length of distance from 0–500 kb, followed by drawing LD decay figures using an R script for each subpopulation. Population diversity of rice varieties was measured by two indexes:θπ andFst.Nucleotide diversity θπ was used as a measurement of the degree of genotype variability within each subpopulation, while subpopulation differentiations were evaluated byFstfor each of the cultivated subpopulations against the wild rice subpopulation and for the cultivated subpopulations compared to each other.Values of θπ andFstwere calculated using sites mode implemented in VCFtools (v0.1.16) [19].
Tools for GS analysis
Genotype and phenotype data sets of the 44 K rice chip were downloaded from the Rice Diversity Website(http://www.ricediversity.org/). Genotype imputation and phasing were then performed using Beagle (version 3.3.2),and the site was filtered if an inferred genotype with a posterior probability was <0.5. GS analysis was performed using RRBLUP mixed model implemented in R package rrBLUP (version 4.6.1) [13] for nine well-measured phenotype traits (flowering time, panicle fertility, seed width, seed volume, seed surface area, plant height, flag leaf length, flag leaf width,and florets per panicle) with five different feature combinations.The prediction accuracy under each feature combination was evaluated by five-fold cross validation and Pearson correlation coefficient. An example of the process is as follows: the original samples were randomly partitioned into five subsets;of the five subsets, a single subset was retained as the validation data,and the remaining four subsets were used as training data.This process was repeated five times,with each of the five subsets used exactly once as the validation data. The Pearson correlation coefficients of the predicted breeding values and the real phenotype values were calculated for each fold.
Pipeline to compile the fixedSNP panel
θπ andTajima’ Dvalues were calculated for the six rice subpopulations (TeJ,TrJ,Aro,Aus,Ind, andOru) in a slidingwindow fashion across the genome using in-house scripts.Fstvalues were calculated for the five cultivated subpopulations against the wildOrusubpopulation,as well as for the five cultivated subpopulations against each other. For each pairwise comparison, the intersection of the top 5% windowed θπ ratios (wild subpopulationvs. cultivated subpopulation),and the top 5% windowedFstvalues correspondingly were selected as strong selective sweep signals.Window sizes of both 100 kb and 10 kb were used to detect large or small selective sweep regions, respectively, followed by merging the results as the candidate selective sweep regions for each subpopulation.Tajima’ Ddistribution was also drawn for the candidate selective sweep regions against the whole genomes for each pairwise comparison.Genes located within the candidate selective sweep regions were extracted for each comparison, and GSEA was performed for each gene listed by PlantGSEA web tools [20]. Genic SNPs located in the candidate selective sweep regions identified from the abovementioned pairwise comparisons were merged as fixedSNPs.
Pipeline to compile the barcodeSNP panel
The 1180 fixedSNPs were used as the initial marker set to select the minimal number of barcodeSNPs that can maximally distinguish the 2556 rice accessions using a heuristic mode implemented in MinimalMarker [7]. Three minimal sets each containing 28 SNPs were generated, and after merging the three sets, 38 unique SNPs were selected as barcodeSNPs for generating DNA fingerprints for each accessions.
To identify commercialized rice varieties using the combination of 38 barcodeSNPs, seven machine learning-based methods were used: DT, KNN, NB, ANN, RF, LR-M, and LR-O algorithms in the Python sklearn library (https://scikit-learn.org/stable/). The precision of each model was assessed using ten-fold cross validation method.Specifically,the original sample set was randomly partitioned into ten subsets,in which nine subsets were used for training model and the remaining subset was used as the testing model;this procedure was repeated ten times and the average prediction accuracy was computed from the overall performance of the tested models. Five one-hot codes (10000, 01000, 00100, 00010, and 00001) label the five subpopulations for classification using machine learning models. Then, the predicted label with the maximal probability was compared with the original label for each sample. If the predicted label is identical with the original label,the prediction result was regarded as correct.Then,the ratios of positive and negative rate were computed to plot receiver operating characteristic(ROC) curves and compute AUC values.
Pipeline to compile the barcodeIndel panel
Raw Indels were identified using the IC4R variation calling pipeline from the origin 5152 rice accessions[2].Then,the Indels from the 2556 rice accessions with high sequencing coverage(depth ≥5)present in SR4R database were extracted using customized Python scripts, followed by using VCFtools (v0.1.16)[19] to filter Indels to generate a high-confidence Indel data set, with parameters of missing rate <0.01 and MAF ≥0.05.Finally, using customized Python scripts, Indels that have the same sequence type within each subpopulation were retained to generate the subpopulation-specific barcodeIndel panel.
Availability
SR4R is freely available at http://sr4r.ic4r.org/.
Authors’ contributions
XW, SS, and ZZ conceived the project; JY and CL collected the data sets; JY conducted the data analysis; DZ developed the database; JY, XW, SS, and ZZ wrote the manuscript. All authors read and approved the final manuscript.
Competing interests
The authors declare no competing interests.
Acknowledgments
We are grateful to users for reporting bugs and providing suggestions in improving SR4R. This work was supported by the National Natural Science Foundation of China (Grant No. 31871706), the Department of Agriculture of Guangdong Province (2018-36), Science and Technology Program of Guangdong Province (Grant No. 2019B030316006), The Strategic Priority Research Program of the Chinese Academy of Sciences (Grant No. XDA24040201), and the Youth Innovation Promotion Association of the Chinese Academy of Sciences (Grant No. 2017141).
Supplementary material
Supplementary data to this article can be found online at https://doi.org/10.1016/j.gpb.2020.03.002.
ORCID
0000-0002-3806-6457 (Yan, J)
0000-0002-7169-4965 (Zou, D)
0000-0001-6702-6860 (Li, C)
0000-0001-6603-5060 (Zhang, Z)
0000-0003-2409-8770 (Song, S)
0000-0002-6406-5597 (Wang, X)
 Genomics,Proteomics & Bioinformatics2020年2期
- Genomics,Proteomics & Bioinformatics的其它文章
- SuccSite: Incorporating Amino Acid Composition and Informative k-spaced Amino Acid Pairs to Identify Protein Succinylation Sites
- HybridSucc: A Hybrid-learning Architecture for General and Species-specific Succinylation Site Prediction
- BGVD: An Integrated Database for Bovine Sequencing Variations and Selective Signatures
- IC4R-2.0: Rice Genome Reannotation Using Massive RNA-seq Data
- iGMDR: Integrated Pharmacogenetic Resource Guide to Cancer Therapy and Research
- MosaicBase: A Knowledgebase of Postzygotic Mosaic Variants in Noncancer Disease-related and Healthy Human Individuals